Productivity and Misallocation
The starting point of a large body of recent research on economic growth is the notion that differences in aggregate total factor productivity (TFP) may not be driven solely by technology but rather in part by allocative efficiency. The key building block of this literature is the idea that firms differ, and we do not necessarily want all the resources to be allocated to one firm. For example, suppose that there are a number of firms in a country and the output Yi of each firm is given by a standard production function,
where Ki is the firm's capital stock (equipment and structures), Li is the firm's labor input (skill-weighted hours worked by its employees), F is the production function which combines capital and labor, and Ai is residual firm productivity.
If each firm produces different products, we do not want all the inputs allocated to the firm with the highest Ai, as we value having access to a variety of differentiated products. Instead, what we want is for resources to be allocated across firms to equalize the revenue productivity of the firm, or PiAi. Resources are misallocated when revenue productivity differs between firms. Reallocation increases aggregate TFP and generates growth when resources flow to firms with high revenue productivity.
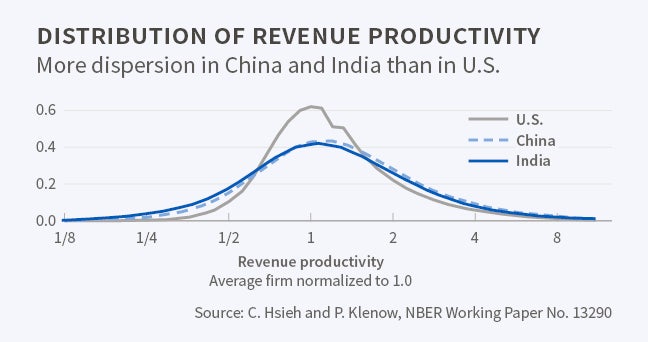
Micro-data from manufacturing censuses suggest substantial gaps in revenue productivity across firms within India and China.1 The gaps are also present in U.S. data, but are much smaller. Figure 1 plots the dispersion of revenue productivity in the three countries. In India and China, revenue productivity of firms in the 90th percentile exceeds that of firms in the 10th percentile by a factor of five. In the U.S., the equivalent gap in revenue productivity is a factor of three. These gaps in revenue productivity between firms may contribute to substantial gaps in aggregate TFP. In a standard model, aggregate TFP would increase by 43 percent in the U.S. in 1997, by 115 percent in China in 1998, and by 127 percent in India in 1994 if resources were to be reallocated to equalize revenue productivity across firms.
We now have a large body of evidence on gaps in revenue productivity at the micro-economic level, largely thanks to the detailed, firm-level data available for a growing number of countries. A project spearheaded by Santiago Levy at the Inter-American Development Bank provides detailed evidence on these gaps for a large number of countries in Latin America.2 There is similar evidence from microeconomic data for a number of countries in Europe.3 These studies find wide gaps in revenue productivity, consistent with substantial misallocation.
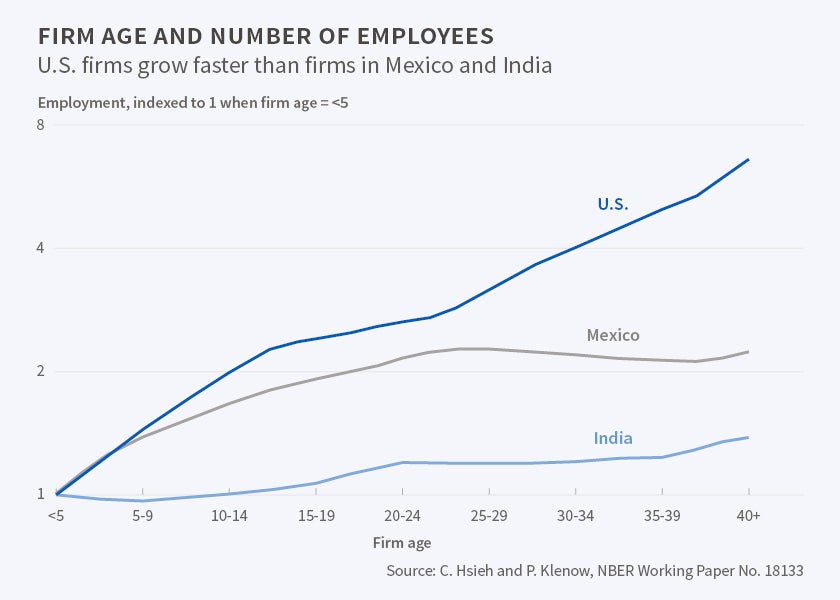
The literature has largely focused on measuring the static effects of firm-level gaps in revenue productivity, but the firm-level gaps are likely to also have important dynamic effects. If more-efficient establishments face larger distortions, it undermines firms' incentives to invest in better technology. Put differently, there are two effects of resource misallocation—the static effect and the dynamic effect of resource misallocation on growth in firm productivity. This has been highlighted in several case studies.4 Evidence from firm-level censuses in India and Mexico is also consistent with the presence of dynamic misallocation.5 Figure 2 shows that, by the age of 40, U.S. firms grow by a factor of eight while Mexican firms only double and Indian firms do not appear to grow at all.
The challenge that follows from these studies is to identify the precise policies and institutions behind the revenue productivity gaps in the micro data. The potential list of explanations is large. We will limit our discussion to five forces that might be important and for which we have some evidence.
Substantial Costs to Adjusting Labor and Capital Inputs6
Evidence on whether adjustment costs might be responsible for the differential gaps in revenue productivity between rich and poor countries is limited. Across a number of countries, the dispersion in capital productivity is correlated with productivity volatility, although the underlying sources of productivity volatility are not known.7 There is much less volatility in employment in Indian than in U.S. manufacturing, almost as if Indian firms face large costs to adjusting employment. This is consistent with evidence on the effects of rigid licensing laws in India.8
Ownership of Firms by the State or the Politically Connected
State-owned firms in China had substantially lower revenue productivity in the late 1990s than their privately-owned counterparts, but the gap narrowed after the closure and privatization of many state-owned firms. A detailed study in India shows substantial gaps in labor productivity between state-owned firms and privately-owned firms in the same sector.9 In telecoms, labor productivity is three times higher in private than in state-owned firms. In the retail banking sector, labor productivity is more than five times higher in private than in state-run firms.
The Presence of a Large Informal Sector 10
This is an important feature of many poor countries. Take retail trade. Modern firms account for 67 percent of retail employment in the U.S. The equivalent numbers are only 21 percent in Brazil, 15 percent in El Salvador, 23 percent in Mexico, 15 percent in the Philippines, and 19 percent in Thailand.11 In all these countries, labor productivity in modern retail is significantly higher than in informal retail stores. The labor productivity of modern retailers is three times higher than that of informal retailers in Brazil, four times higher in El Salvador, three-and- a-half times higher in Mexico, six times higher in the Philip-pines, and four times higher in Thailand.
The pervasiveness and low productivity of the informal sector is also seen in manufacturing in India and Mexico. Informal manufacturing establishments in India, defined as establishments that are not formally registered, accounted for 80 percent of total Indian manufacturing employment in 2005. In Mexico, almost all manufacturing establishments are formal in the sense of being formally registered, but if we define informal firms as those which are not paying Social Security taxes—either legally by only employing unpaid family workers or illegally by explicitly not paying the required social security tax—informal establishments accounted for 30 percent of total Mexican manufacturing employment in 2008. Informal establishments in India and Mexico are significantly smaller than formal establishments. Figure 3 plots the distribution of establishment size in India and Mexico for informal and formal establishments. The typical informal establishment employs four workers in India and about 10 workers in Mexico, while formal establishments employ 20 workers on average in India and about 50 in Mexico.
All of this suggests that a proximate reason poor countries are poor is that modern formal firms find it difficult to obtain resources and/or capture market share. We still have a very limited understanding, however, of the exact forces behind the prevalence of informal and unproductive establishments. The Inter-American Development Bank, and Levy in particular, have argued that the patterns of informality, at least in Latin America, are due to the nature of the tax systems and social-protection programs.12 A glance at the World Bank Doing Business indicators suggests that high costs of doing business may also be a factor.
Social Forces May Distort the Allocation of Talent across Occupations and Firms
These forces may reflect the legacy of gender and race discrimination in the U.S., caste discrimination in India, discrimination based on economic and ethnic background in some Latin American countries, or the effect of second-generation managers in family firms in many countries.13 In the U.S., for example, the fraction of white women who work in high-skilled occupations—lawyers, doctors, engineers, scientists, architects, and executives or managers—increased from six percent in 1960 to 21 percent in 2008.14 The share of black men who work in those high-skilled occupations increased from three percent in 1960 to 15 percent in 2008. By comparison, the share of white men in these occupations increased much more modestly, from 20 percent in 1960 to 25 percent by 2008. We estimate that the convergence in occupations between white men and the other groups might explain around 15 percent of the growth in aggregate productivity in the U.S. from 1960 to 2008.
Such forces are surely present, and perhaps even more important, in other countries. In India a generation ago, women from disadvantaged castes completed 4.1 years less schooling than women in non-disadvantaged castes; disadvantaged-caste men completed 2.3 years less school than men from non-disadvantaged castes.15 The gap is still present today, but has shown a marked decline. In 2004, the caste schooling gap for women had declined to 2.2 years; for men it had declined to 1.7 years.
Internal Trade Barriers Likely Play an Important Role in the Efficiency of Resource Allocation
Internal trade barriers can be very large in poor countries such as Ethiopia and Nigeria.16 In the agricultural context, there is evidence that lowering transportation costs led to large gains in agricultural productivity in the U.S. historically, and in places such as Sierra Leone more recently.17 In the industrial sector, internal trade costs could be similarly costly. If access to input and output markets is critical for modern industrial firms, then barriers that make it difficult for firms to access these networks will affect the incentives of firms to invest in better technology.
This review only touches on a few of the myriad micro forces that may matter for macro productivity. Low allocative efficiency may be "death by a thousand cuts."18 If so, no magic bullet or single policy reform is likely to transform productivity. We suspect there is no substitute for investigating and quantifying the micro sources of low allocative efficiency one by one.
Endnotes
C. Hsieh and P. Klenow, "Misallocation and Manufacturing TFP in China and India," NBER Working Paper 13290, August 2007, and Quarterly Journal of Economics, 124(4), 2009, pp. 1403–48.
C. Pagés, The Age of Productivity: Transforming Economies from the Bottom Up, Inter-American Development Bank, New York, NY: Palgrave Macmillan, 2010.
E. Bartelsman, J. Haltiwanger and S. Scarpetta, "Cross-country Differences in Productivity: The Role of Allocation and Selection," NBER Working Paper 15490, November 2009, and the American Economic Review, 103(1), 2013, pp. 305–34.
S. Parente and E. Prescott, Barriers to Riches, Cambridge, MA: MIT Press, 2000; and J. Schmitz, "What Determines Productivity? Lessons from the Dramatic Recovery of the U.S. and Canadian Iron Ore Industries Following Their Early 1980s Crisis," Journal of Political Economy, 2005, 113(3), pp. 582–625.
C. Hsieh and P. Klenow, "The Lifecycle of Manufacturing Plants in India and Mexico," NBER Working Paper 18133, June 2012, and Quarterly Journal of Economics, 129(3), 2014, pp. 1035–84.
R. Caballero, E. Engel, and J. Haltiwanger, "Aggregate Employment Dynamics: Building from Microeconomic Evidence," NBER Working Paper 5042, February 1995, and the American Economic Review, 87(1), 1997, pp. 115–37; and R. Cooper and J. Haltiwanger, "On the Nature of Capital Adjustment Costs," NBER Working Paper 7925, September 2000, and the Review of Economic Studies, 73(3), 2006, pp. 611–33.
J. Asker, A. Collard-Wexler, and J. De Loecker, "Dynamic Inputs and Resource (Mis)Allocation," NBER Working Paper 17175, June 2011, and the Journal of Political Economy, 122(5), 2014, pp. 1013–63.
P. Aghion, R. Burgess, S. Redding, and F. Zilibotti, "The Unequal Effects of Liberalization: Evidence from Dismantling the License Raj in India," NBER Working Paper 12031, February 2006, and the American Economic Review, 98(4), 2008, pp. 1397–1412.
R. La Porta and A. Shleifer, "Informality and Development," NBER Working Paper 20205, June 2014, and the Journal of Economic Perspectives, 28(3), 2014, pp. 109–26.
D. Lagakos, "Explaining Cross-Country Productivity Differences in Retail Trade," forthcoming in the Journal of Political Economy, 2016. https://www.journals.uchicago.edu/doi/abs/10.1086/684718
S. Levy, Good Intentions, Bad Outcomes, Washington, DC: Brookings Institution Press, 2008. http://www.brookings.edu/research/books/2008/goodintentionsbadoutcomes
N. Bloom, C. Genakos, R. Sadun, and J. Van Reenen, "Management Practices Across Firms and Countries," NBER Working Paper 17850, February 2012.
C. Hsieh, E. Hurst, C. Jones, and P. Klenow, "The Allocation of Talent and U.S. Economic Growth," NBER Working Paper 18693, January 2013.
V. Hnatkovska, A. Lahiri, and S. Paul, "Castes and Labor Mobility," American Economic Journal: Applied Economics, 4(2), 2012, pp. 274–307.
D. Atkin and D. Donaldson, "Who's Getting Globalized? The Size and Nature of Intranational Trade Costs," NBER Working Paper 21439, July 2015.
A. Costinot and D. Donaldson, "How Large are the Gains from Economic Integration? Theory and Evidence from U.S. Agriculture, 1880–1997," MIT Working Paper, January 2014. http://economics.mit.edu/files/9841


