Spending Responses to Interest Rate Movements
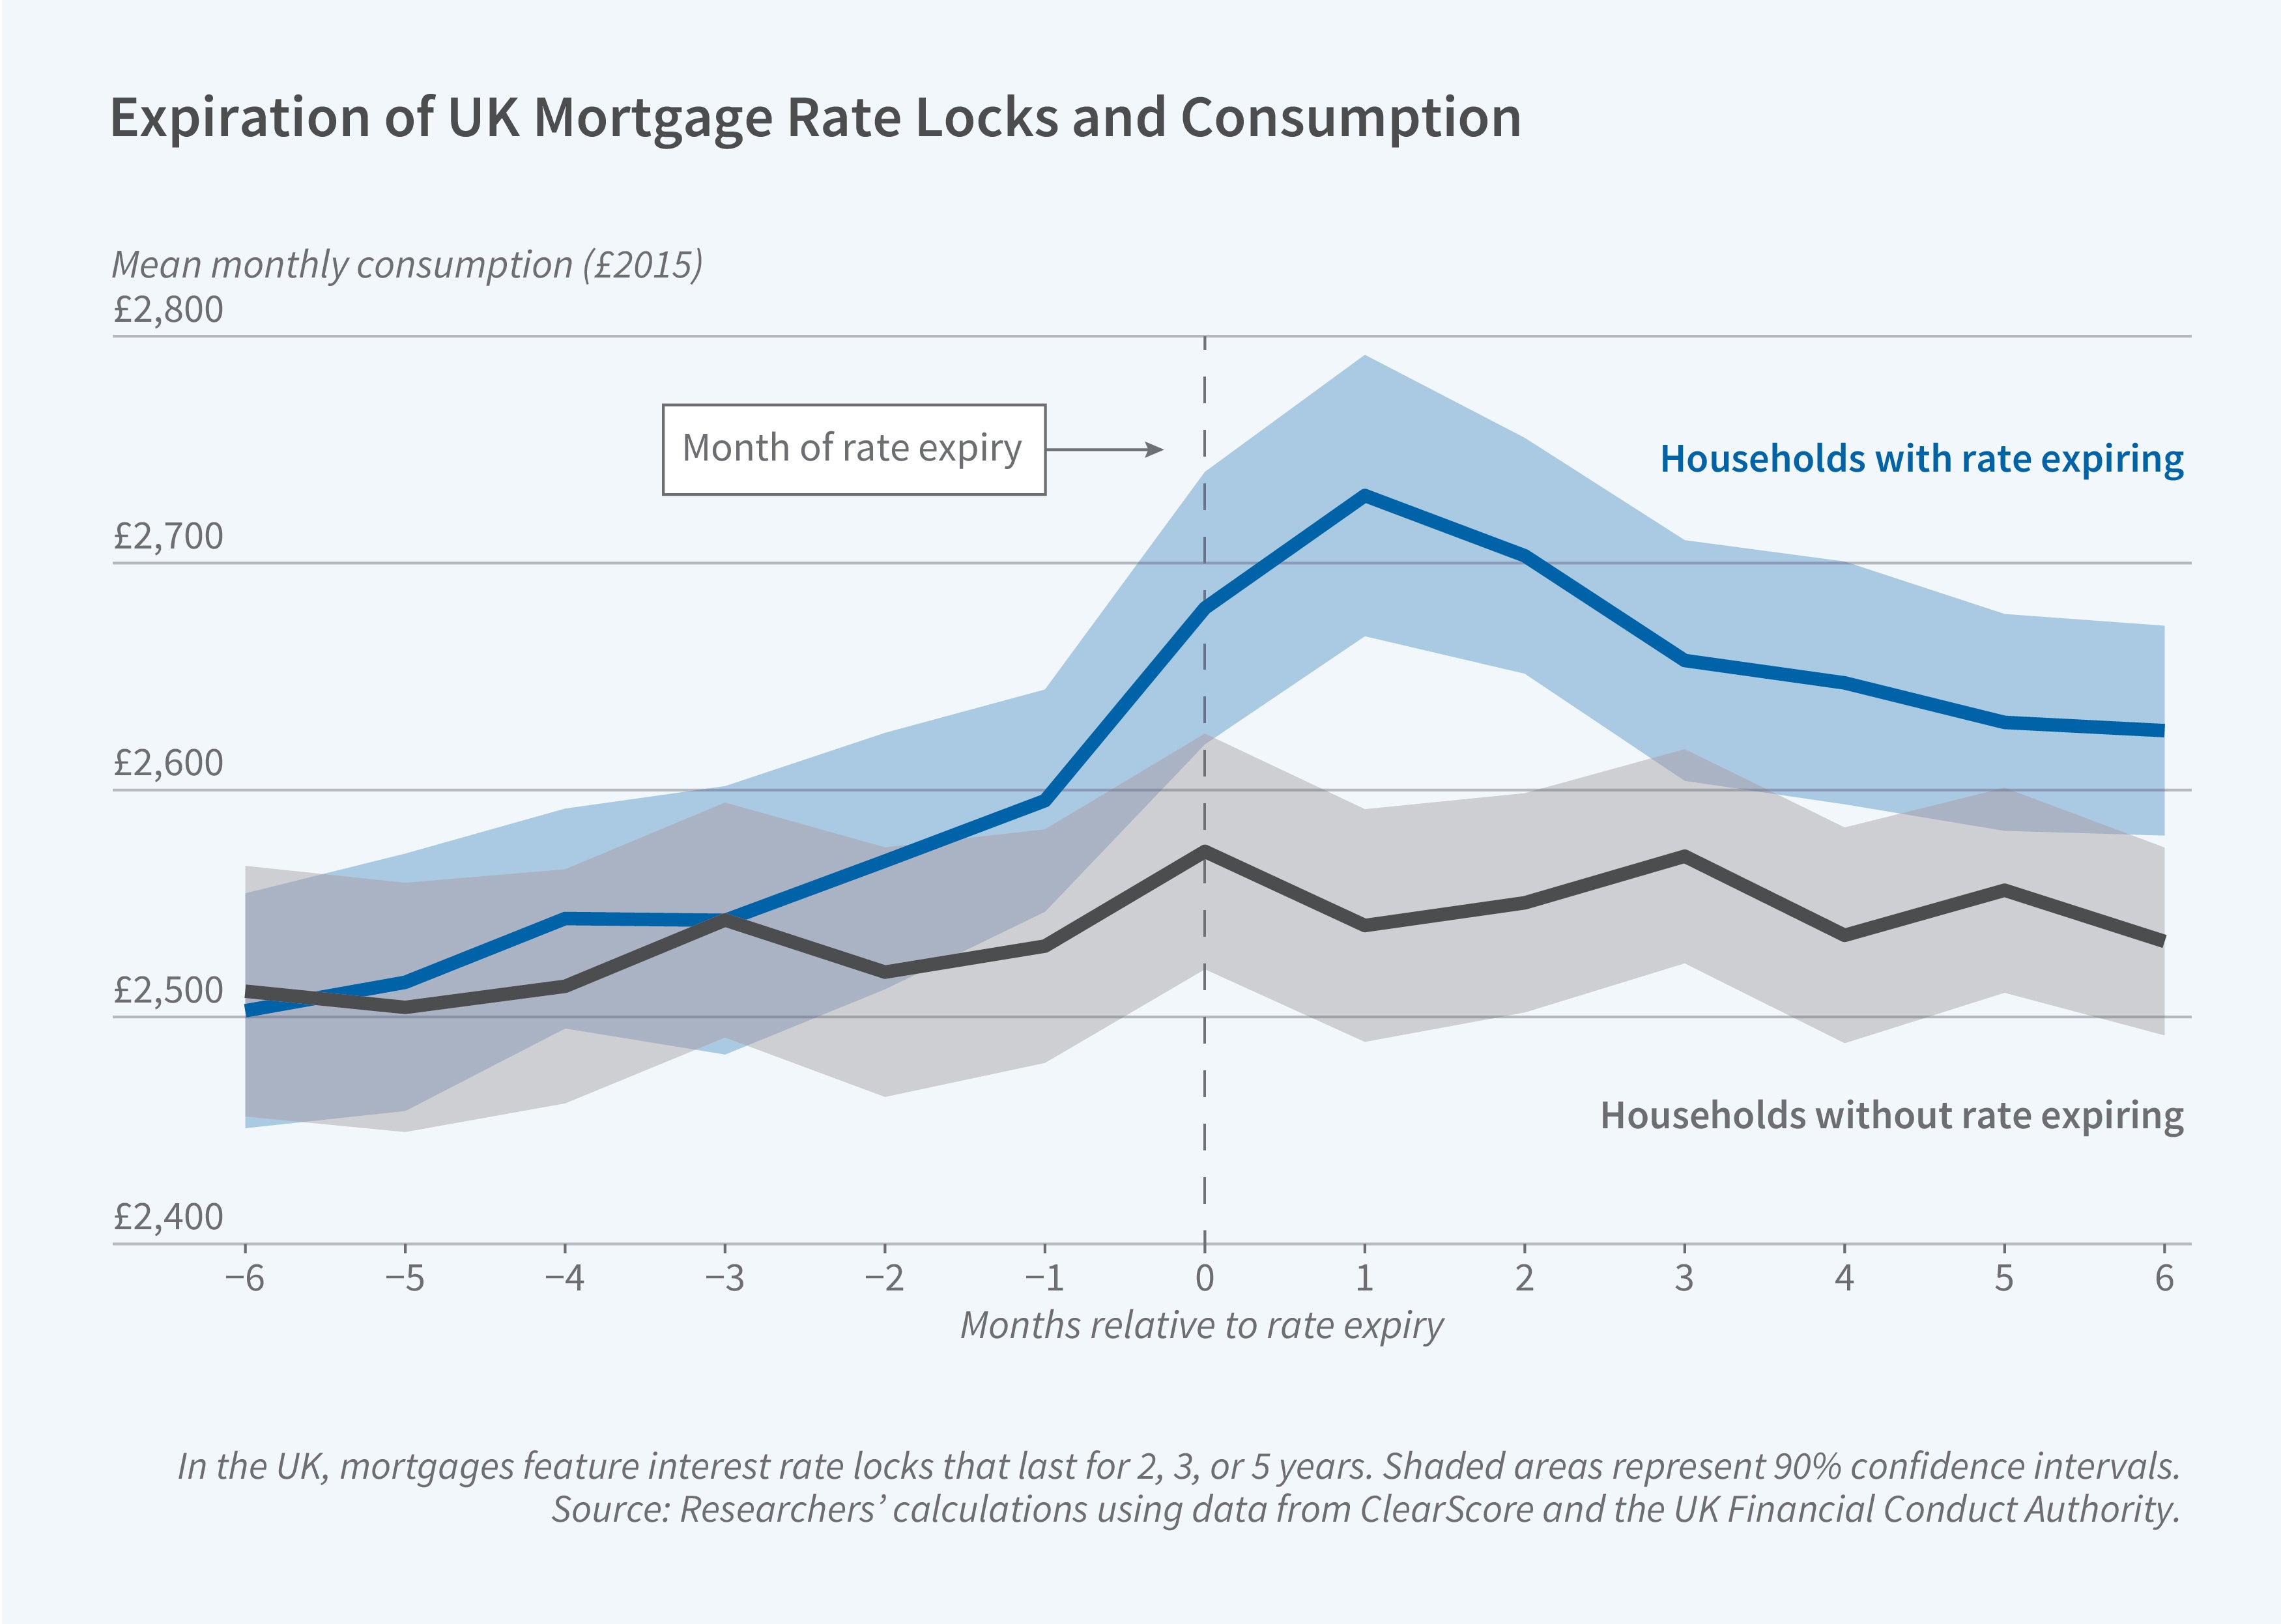
Interest rates on most UK mortgage products are fixed for shorter periods than the interest rates on US mortgages. They typically require borrowers to refinance after two, three, or five years. When a mortgage “deal” expires, the borrower has strong financial incentives to refinance. Because deal lengths vary across households, different borrowers who are refinancing in the same month will experience different interest rate changes, depending on when their expiring deal began. In periods of interest rate decline, for example, borrowers with longer previous deals will experience larger interest rate reductions than those with shorter deals.
In How Do Interest Rates Affect Consumption? Household Debt and the Role of Asset Prices (NBER Working Paper 34911), Angus K. Foulis, Jonathon Hazell, Atif R. Mian, and Belinda Tracey study over 6 million expiring deals in the UK mortgage market over the period 2015 to 2024. They estimate how changes in interest rates, a key element of monetary policy, affect household consumption through their effect on the cost of borrowing and through asset prices.
When UK interest rates fall, household spending rises mainly because rate-driven house price gains expand borrowing. Lower mortgage payments play a secondary role.
A 1 percentage point reduction in mortgage rates is associated with a rise in consumption of about 3 percent—equivalent to roughly 950 pounds—in the six months after deal expiry. Cash on hand, defined as the combined effect of new borrowing and lower debt service, increases by 1,800 pounds, implying a marginal propensity to consume out of rate-induced cash on hand of approximately 0.5 over six months. The researchers estimate that if all deals expired at once, a 1 percentage point drop in interest rates would raise aggregate consumption by 0.7 percent of GDP.
At the six-month horizon, new mortgage borrowing against higher home values—driven by the decline in interest rates—accounts for about two-thirds of the increase in spending, while reduced debt service accounts for the remaining third. This pattern points toward interest-rate-linked revaluation of house prices as a key driver of spending changes. The researchers confirm this by estimating the spending impact of the household debt channel separately across 360 local regions that differ in the extent to which house prices respond to rate changes.
In regions where house prices barely react to interest rates, both the borrowing and consumption responses are roughly half their average size. In the average region, a 1 percentage point rate cut raises house prices by about 6 percent, generating a large borrowing response. Highly leveraged households, particularly those under age 35 with loan-to-value ratios above 70 percent, are especially responsive.
The researchers note that because deals expire at staggered intervals, the aggregate consumption response to a rate cut takes approximately 50 months to play out. The on-impact response of consumption to rate cuts roughly halved between 2016 and 2023 as average deal lengths increased, indicating that the lag structure of monetary policy itself has been shifting over time.
The researchers acknowledge support from the Julis-Rabinowitz Center for Public Policy and Finance at Princeton University.


