China’s Rise in Global Research
Although Western nations have dominated global scientific research since the nineteenth century, recent decades have witnessed profound shifts in where research is conducted, what topics it addresses, and how widely its findings spread across borders. In The Geography of Science (NBER Working Paper 34694), Abhishek Nagaraj and Randol Yao provide a comprehensive analysis of the evolution of global science between 1980 and 2022. Using data on 44 million publications from nearly 12,000 journals, they track where science is produced, based on author affiliations, what science studies, based on geographic references in titles and abstracts, and where science is consumed, based on citation patterns.
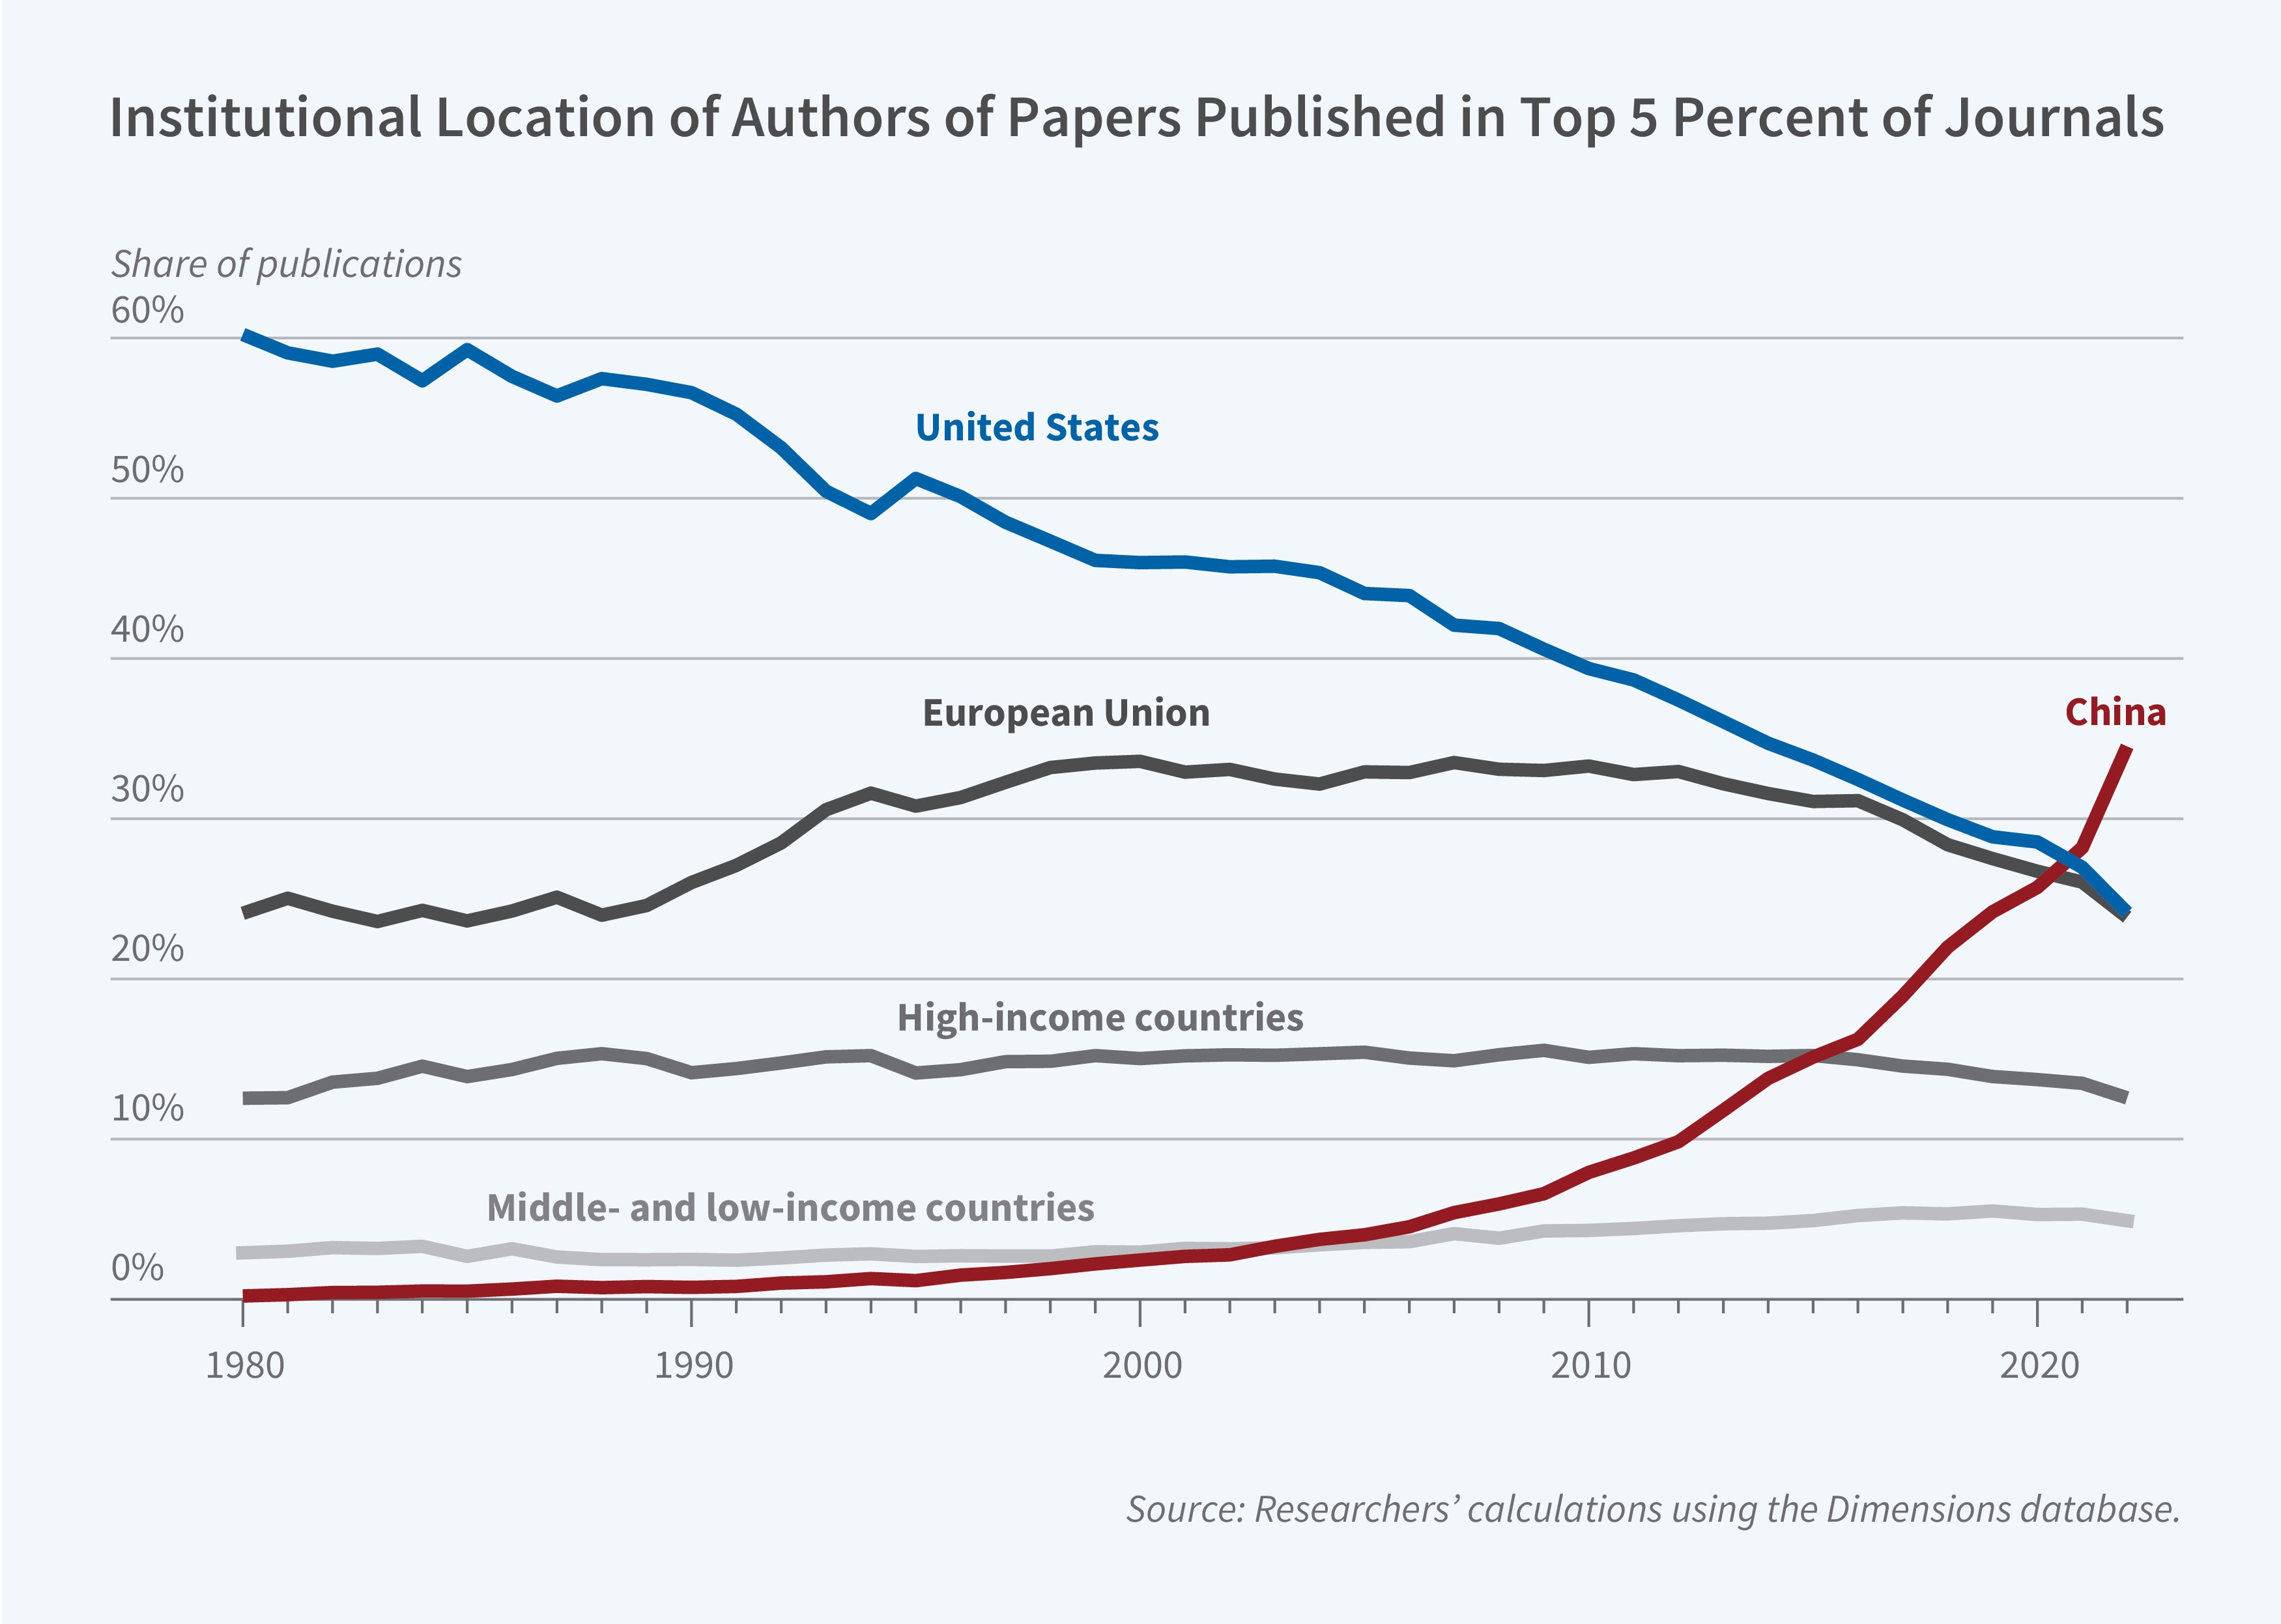
Between 1980 and 2022, China’s share of global research publications in top journals rose from a negligible level to 32 percent, while the US share declined from 60 to about 24 percent.
The researchers geocoded institutional affiliations for over 147 million publication-researcher pairs and identified the geographic focus for approximately 7 million publications in 22 fields of study. They categorized research into five regions: the United States, high-income European Union countries, other high-income countries, China, and other middle- and low-income countries.
The US share of global publications declined from 40 percent in 1980 to 15 percent in 2022, while China's share rose from near zero to 32 percent. In 2022, China produced over 35 percent of the publications in top-tier journals, more than either the US or the EU. Other middle- and low-income countries collectively account for 21 percent of global publications, comparable to high-income EU countries combined.
The shift over the last four decades reflects both expanded researcher numbers in China and increased researcher productivity. Chinese researchers represent 18 percent of all researchers in the sample and 26 percent of researchers in top journals in 2022. Excluding cross-regional collaborations produces similar trends, indicating the patterns are not primarily driven by international co-authorship.
China leads in engineering and physical sciences, particularly chemistry, producing over 60 percent of breakthrough publications in materials engineering, communications engineering, and physical chemistry. The US maintains dominance in biomedical and health sciences, including reproductive medicine and biochemistry. Middle- and low-income countries lead in agriculture, veterinary, and food sciences but remain underrepresented in top-tier journals across most fields.
Among breakthrough publications, over 40 percent focus on US topics, while only 13 percent address topics regarding middle- and low-income countries. However, in lower-tier venues, research attention to these nations has increased, reaching 35 percent of geographically focused publications by 2022, with China accounting for over 20 percent.
Citation analysis reveals fragmentation in knowledge diffusion. Chinese research exhibits the highest concentration of citations within its own borders. Between 58 and 68 percent of citations to Chinese publications come from other Chinese publications, even for breakthrough work. This contrasts sharply with other regions, where cross-border citation rates are substantially higher. Citation concentration across regions declined between 1980 and 2020 for all publication types, indicating increasing globalization, but Chinese publications consistently showed the slowest move toward global diffusion.
The researchers acknowledge support from the Clausen Center for International Business and Policy.


