Understanding the Lag Between CPI Shelter Inflation and Market Rents
Housing costs represent about 35 percent of the Consumer Price Index (CPI), making shelter inflation a critical factor in overall inflation dynamics. The relationship between market rents—what new tenants pay when moving into a dwelling—and CPI shelter inflation has become particularly important as housing costs have significantly influenced inflation trends in recent years.
In Market Rents and CPI Shelter Inflation (NBER Working Paper 34113), researchers Laurence M. Ball and Kyung Woong Koh investigate why CPI shelter inflation responds with substantial lags to changes in market rents. They find three specific reasons. First, about 60 percent of rental dwellings are covered by 12-month leases, meaning rents cannot adjust to market changes until lease renewal. Second, when leases are renewed, landlords typically smooth rent increases for continuing tenants rather than immediately adjust to current market rates. Third, the two largest components of the CPI shelter index, Rent of Primary Residence, which accounts for 21.1 percent of the index, and Owners’ Equivalent Rent of Residences, which accounts for 74.1 percent, are derived by comparing rents in a given month to rents six months earlier. This creates an additional lag in measured inflation.
Landlords’ significant smoothing of rent increases for continuing tenants is a key factor in the CPI shelter index’s slow response to market rent changes.
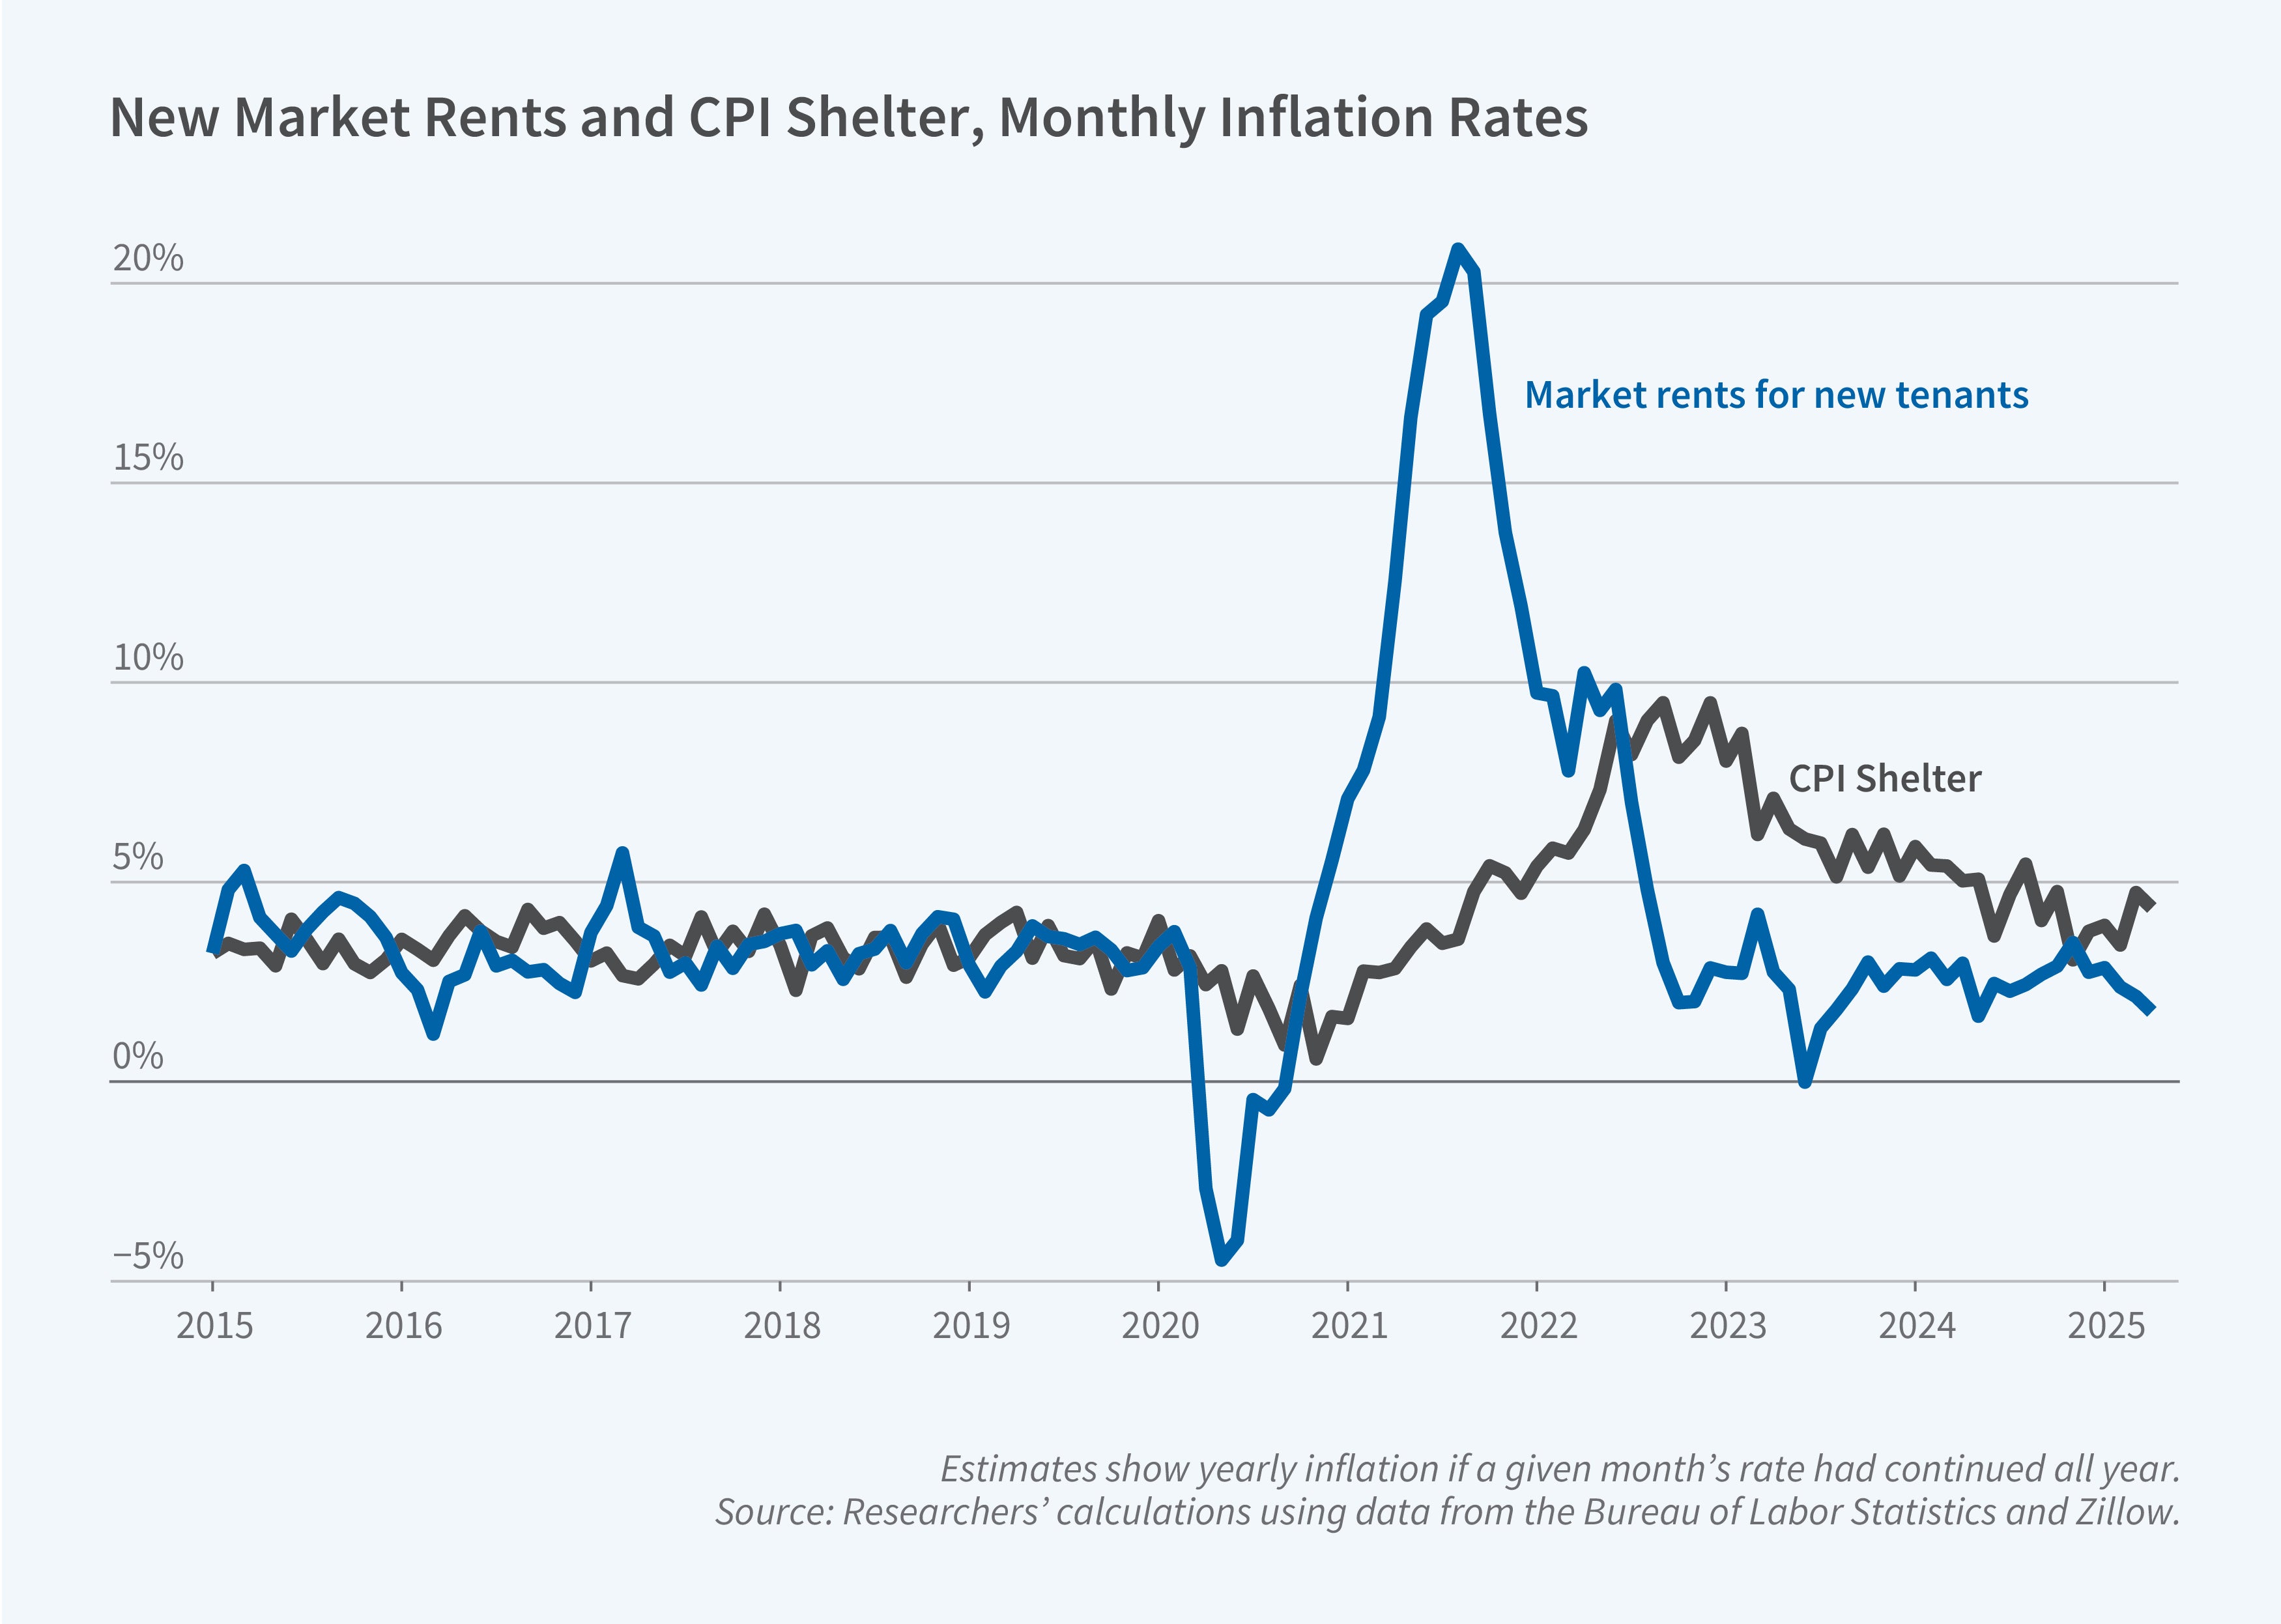
The researchers use monthly data from 2015 to 2025 to develop a model that predicts CPI shelter inflation based on market rent movements. They employ the Zillow Observed Rent Index (ZORI) as their measure of market rents and adjust for differences between ZORI properties and CPI-measured properties.
They use a variety of data sources to estimate three key parameters that affect measured CPI inflation. One is the fraction of tenants who have month-to-month rentals, which they find to be about 35 percent. A second is the tenant mobility rate, which they find to be 1.8 percent per month. The third parameter is the fraction of the change in market rent since a lease was extended that landlords pass through to continuing tenants when they renew their lease. This parameter is estimated by selecting the value that delivers the best fit between their model of CPI inflation and the time series reported by the Bureau of Labor Statistics. The researchers estimate this parameter to be 21 percent, which implies that if market rents have risen by 10 percent since the tenant’s previous lease began, on average, landlords only raise the rent by 2.1 percent.
The researchers’ model sheds light on the lagged responses of CPI shelter inflation to market rent movements, particularly during the period in 2021 when rents rose sharply and the subsequent period when they fell. It suggests that rent smoothing for continuing tenants is essential for explaining the observed data patterns.


