The Amount and Structure of Taxpayer Wealth in Foreign Accounts

Since 2015, the Foreign Account Tax Compliance Act (FATCA) has significantly expanded the amount of information available to the Internal Revenue Service (IRS) regarding wealth held by US taxpayers in foreign accounts. In The Offshore World According to FATCA: New Evidence on the Foreign Wealth of US Households (NBER Working Paper 31055), Niels Johannesen, Daniel Reck, Max Risch, Joel Slemrod, John Guyton, and Patrick Langetieg document the size, distribution, and location of these funds.
FATCA requires foreign financial institutions (FFIs) to report to the IRS when any individual US taxpayer has an account worth more than $50,000. The researchers examine the information returns filed by the FFIs — Form 8966 — between 2015 and 2018. They exclude records containing no financial information, duplicate records, and a small number of observations with extremely large and suspect dollar values. The number of reported accounts grew substantially during this time period: for tax year (TY) 2015, their data include 178 countries, 27,000 institutions, and over 2 million accounts totaling $1.6 trillion in assets; in TY2018, there were reports from 190 countries, 45,000 institutions, and about 4.6 million accounts totaling $3.6 trillion in assets.
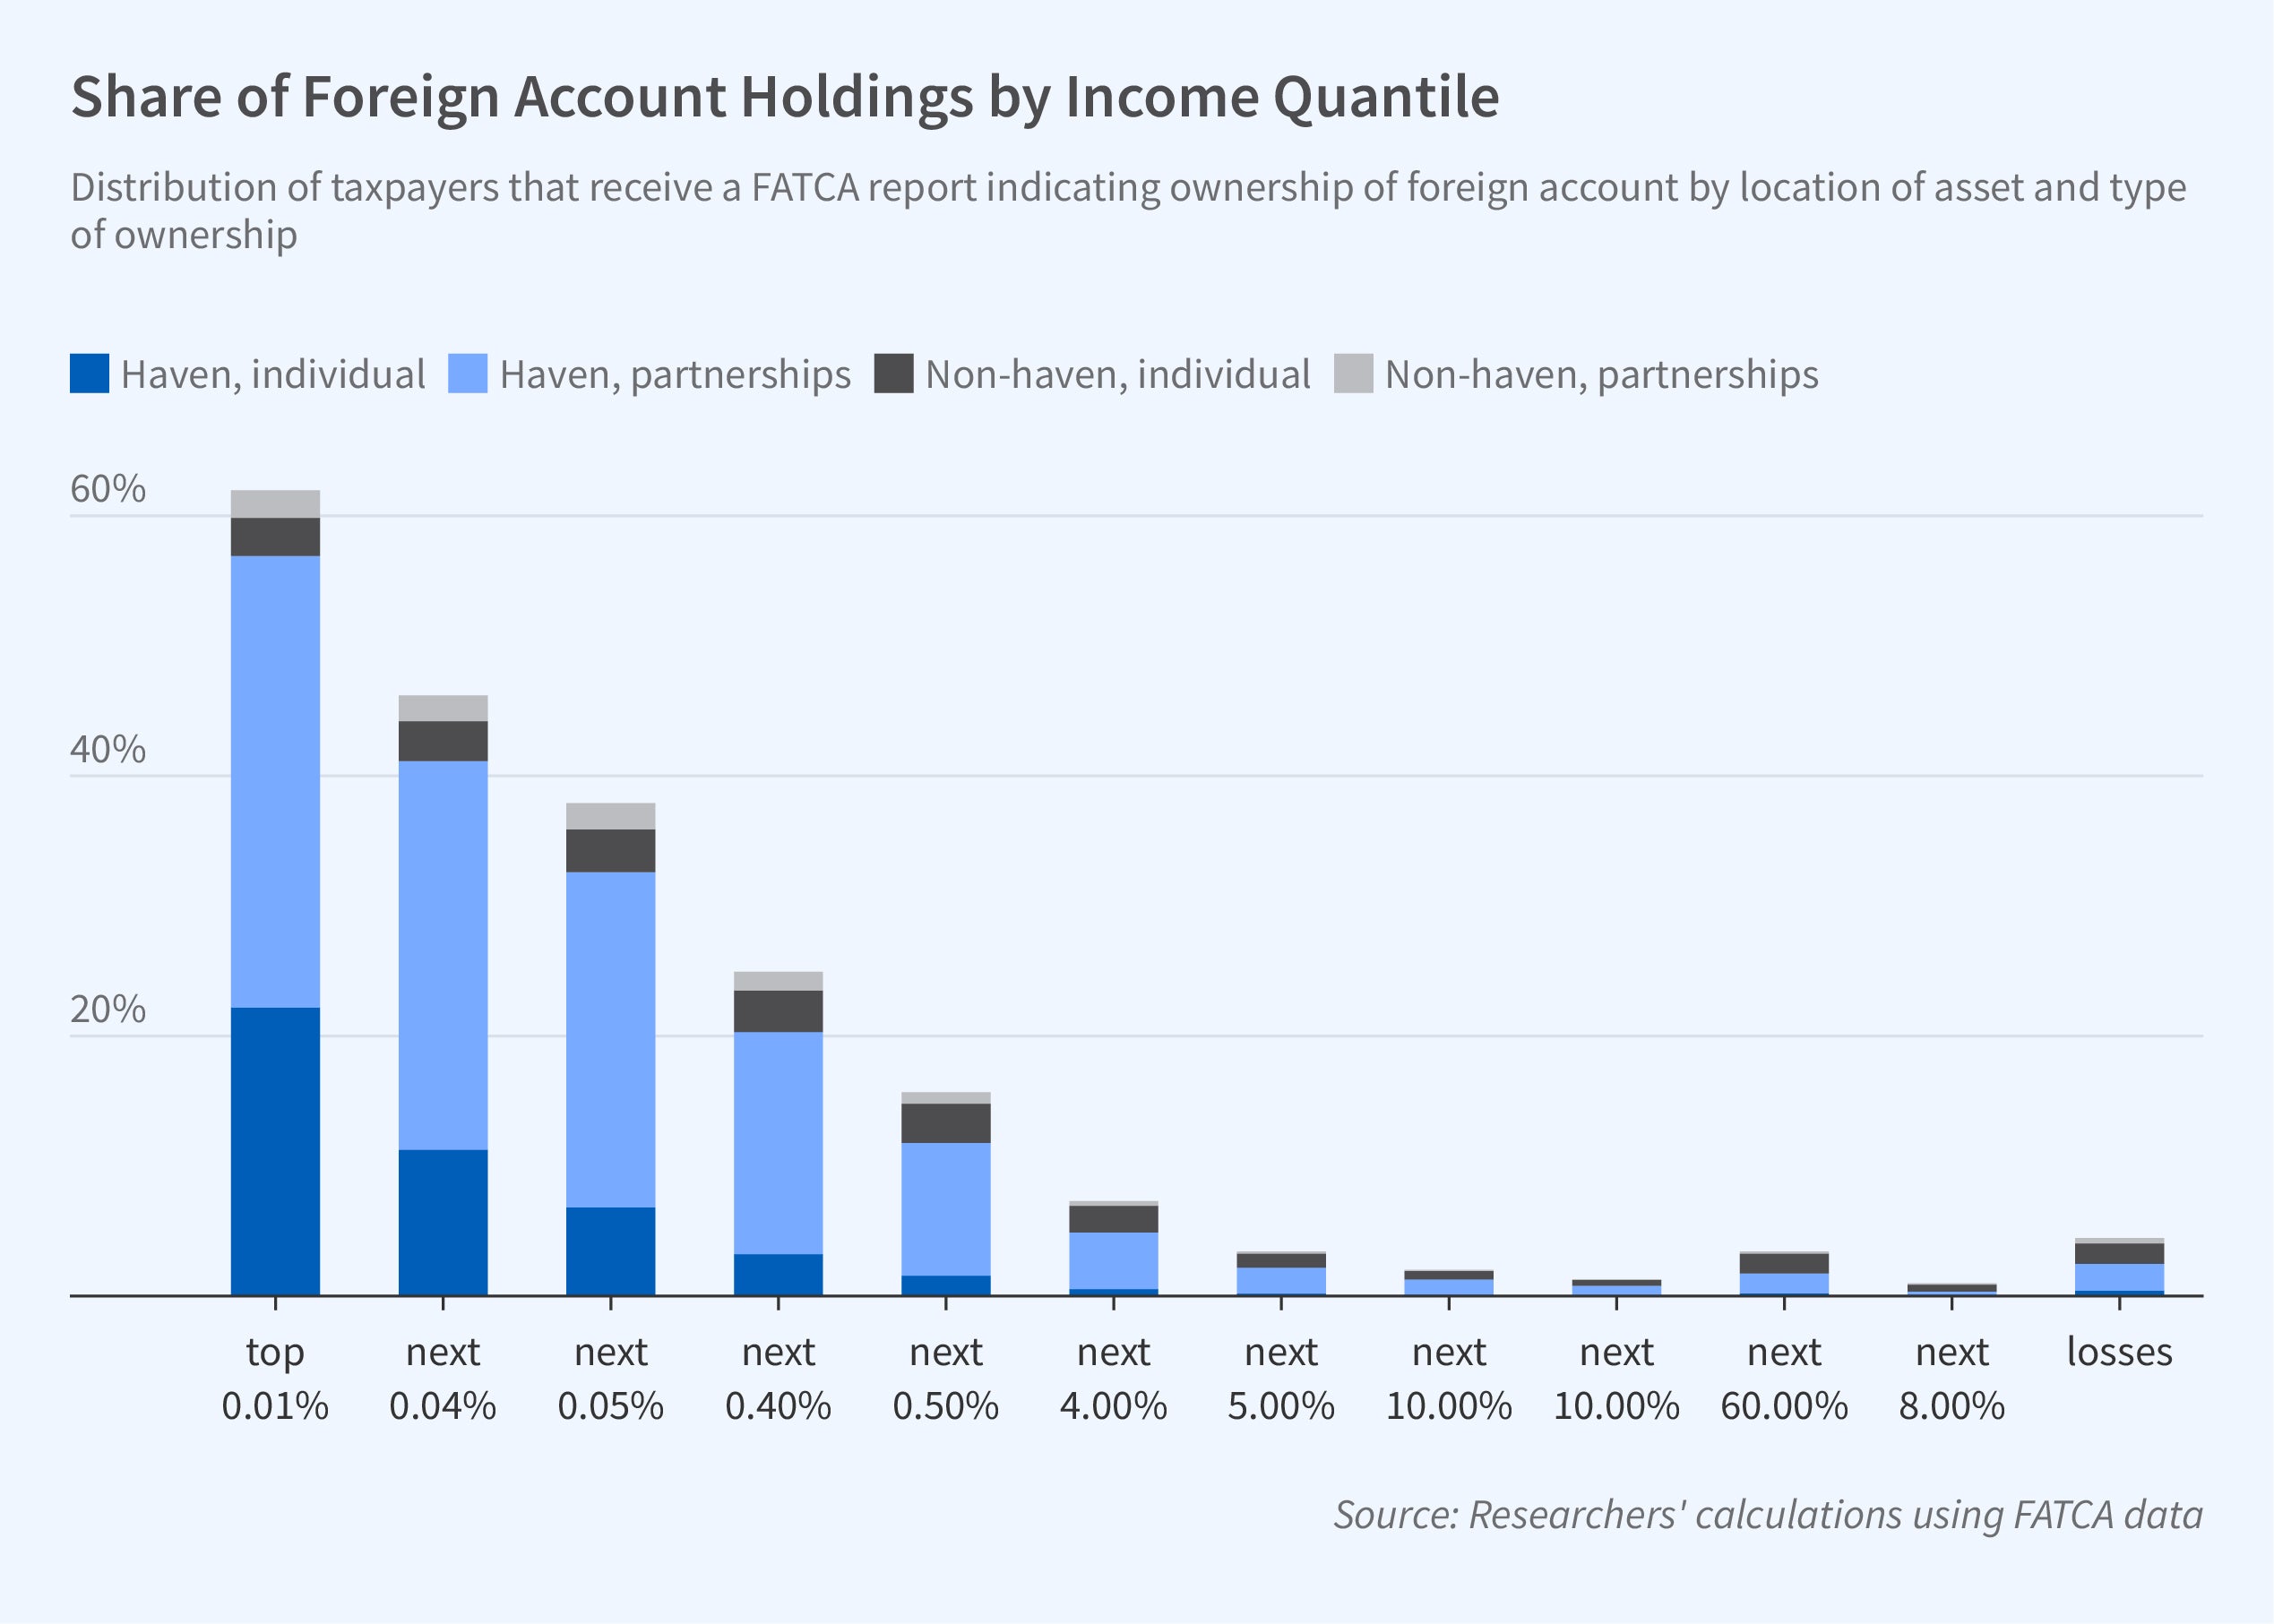
Approximately 22 percent of those in the top 1 percent of the income distribution and 62 percent of those in the top 0.01 percent hold foreign accounts.
FFIs often report only partial owner information. Among forms with complete Taxpayer Identification Numbers (TINs), there were 790,000 distinct owners in TY2015, and 1.5 million distinct owners in TY2018. Moreover, there were many accounts without income information. The forms with available income information in 2018 showed $13.2 billion in reported interest income, $28.5 billion in dividends, $274 billion in gross proceeds and redemptions, and $208 billion in other income.
Most owners of offshore wealth are sophisticated global investors or US taxpayers with close ties to specific foreign countries, such as recent immigrants or expats. Although the median account was not held in a tax haven, larger accounts were more likely to be held there and the researchers find that most of the wealth was owned by sophisticated investors and stored in tax havens and/or owned indirectly by a partnership. The 55 percent of accounts owned by identifiable individuals held 16 percent of total wealth reported on Form 8966, while the 1.4 percent of accounts owned by partnerships held 32 percent. Partnerships owned 52 percent of the $1.9 trillion in total wealth that was reported in tax havens, but only 14 percent of wealth in other locations.
Partnerships are pass-through business entities, meaning income and losses are distributed to and taxed as part of the income of the partners. The researchers allocate reported foreign assets in proportion to each partner’s share of the partnership’s income; when the partnership is owned by another partnership, they repeat this process until the assets are allocated to an ultimate owner. The data show that 43 percent of assets held by partnerships were owned by US individuals, 10 percent by foreign individuals or entities, 8 percent by tax-exempt organizations, and 8 percent by trusts. Twenty percent had no identifiable beneficial owner. When they combine their information on the ownership of foreign accounts, both directly and via partnerships, with taxpayer income on individual tax returns (IRS Form 1040), the researchers find that approximately 22 percent of those in the top 1 percent of the income distribution, and 62 percent of those in the top 0.01 percent, held foreign accounts. Twenty-three percent of all reported foreign assets were held in tax havens by taxpayers in the top 0.01 percent.
—Whitney Zhang


