Racial Health Disparities Among SSI Recipients
Understanding health disparities among Supplemental Security Income (SSI) recipients is crucial for improving healthcare delivery and outcomes for vulnerable populations. In Tracking Racial Health Disparities in the SSI Population Before and During the COVID-19 Pandemic (NBER RDRC Paper NB23-17), researchers Jessica Van Parys and Jevay Grooms examine racial and ethnic health disparities by utilizing Transformed Medicaid Statistical Information System (T-MSIS) Analytic Files (TAF) from 2016 to 2020.
Analysis of Medicaid data from 2016 to 2020 reveals significant racial and ethnic health disparities among SSI recipients, particularly in chronic disease prevalence, healthcare utilization, and COVID-19 outcomes.
They analyze information on nearly 3.5 million SSI recipients aged 18–64 annually. Whites account for 46.7 percent of the study population, Blacks 30.6 percent, Hispanics 13.7 percent, and Asians 2.3 percent. All other groups account for 1.7 percent, with Native Hawaiian and Other Pacific Islander (NHOPI) accounting for 0.3 percent, American Indian and Alaska Native (AIAN) for 1.2 percent, and Multiracial for 0.2 percent.
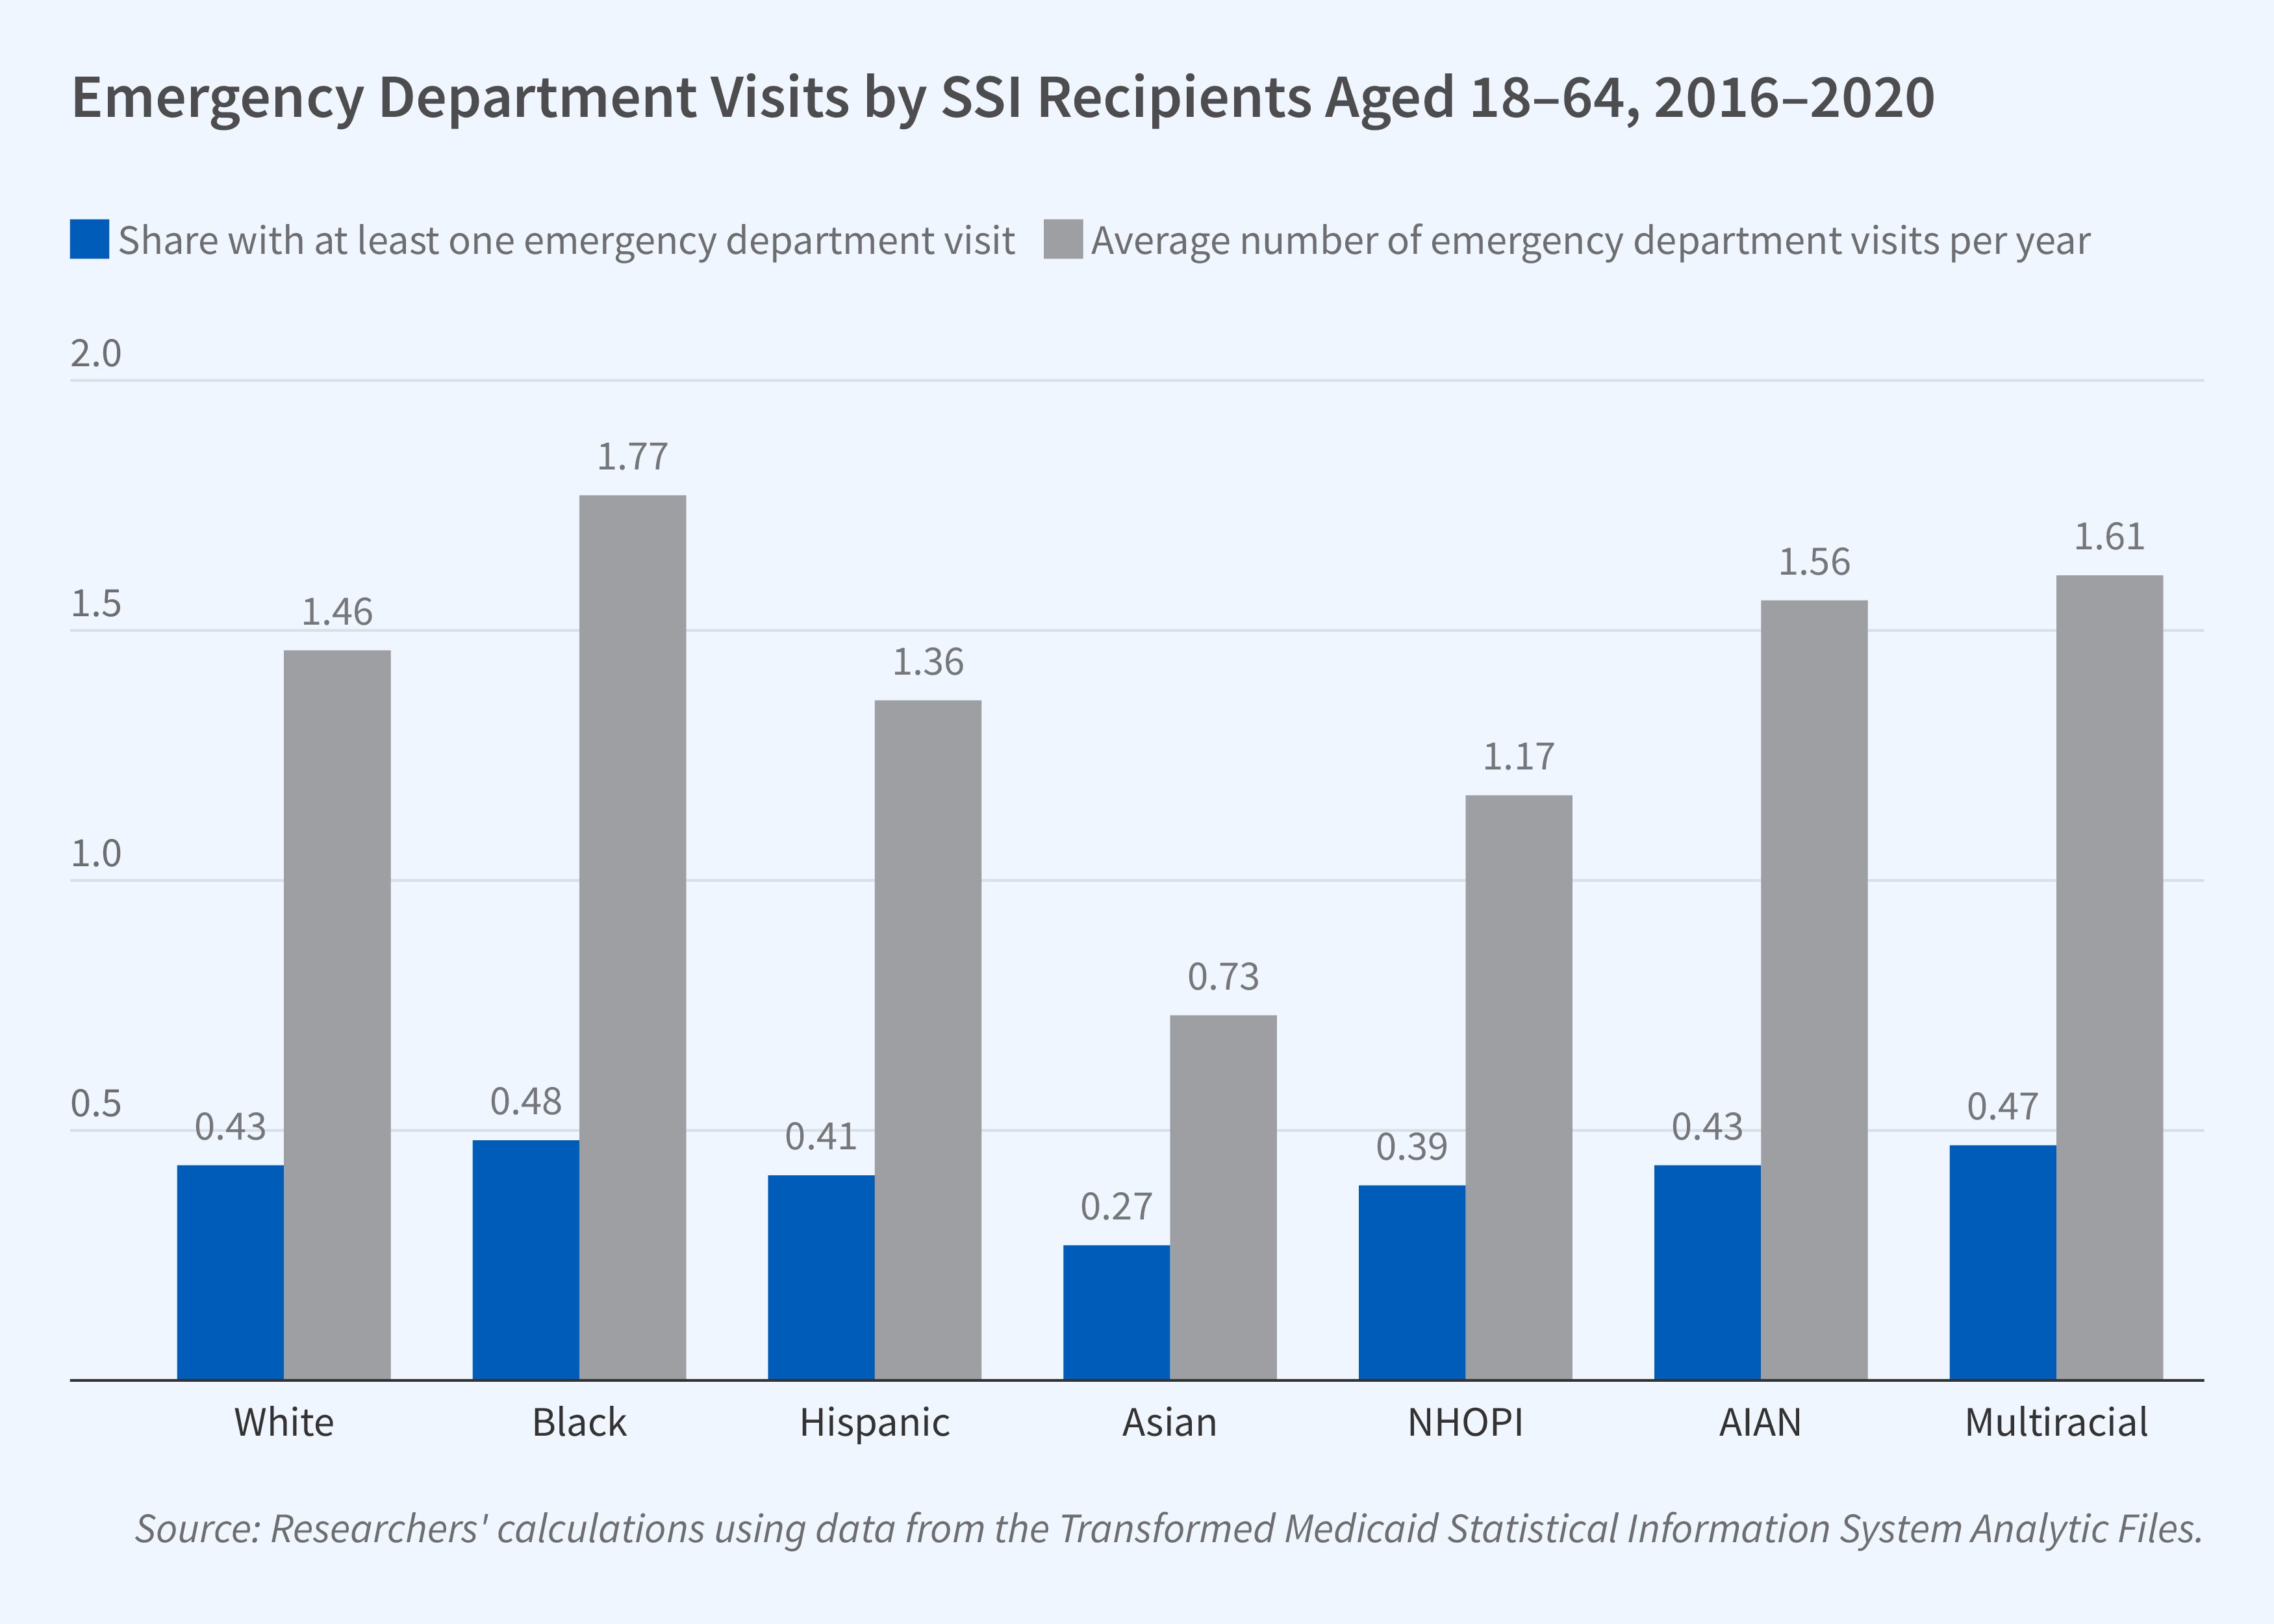
They find significant disparities in health outcomes and healthcare utilization. AIAN and White recipients exhibited the highest mortality rates, about 2.3 percent annually, while Asian and Hispanic recipients had the lowest rates, between 1.3 and 1.6 percent. Emergency department utilization patterns also differed markedly, with 48 percent of Black recipients having at least one visit annually and an average of 1.77 visits per year, compared to 27 percent of Asian recipients having at least one annual visit and an average of 0.73 visits per year.
The prevalence of chronic conditions varied substantially across groups. NHOPI and Asian populations showed the highest diabetes rates, while Black and NHOPI recipients had the highest rates of hypertension. White and Multiracial recipients had the highest rates of chronic obstructive pulmonary disease and depression.
The researchers also find stark disparities in infection rates and mortality during the pandemic. Hispanic SSI recipients had the highest COVID-19 diagnosis rate, at 5.4 percent, followed by NHOPI recipients at 5.0 percent and AIAN recipients at 4.7 percent. However, White recipients, despite having the lowest infection rate (2.8 percent), showed the highest COVID-19-related mortality when infected.
The researchers control for age, sex, living in a metropolitan area, and hospital referral region, and find that adjusted and unadjusted disparities are quite similar. This suggests that observed health differences stem from factors beyond geographic location or demographic characteristics. The study’s findings are particularly robust given that all subjects had Medicaid coverage, eliminating health insurance access as a confounding variable.
The research reported herein was performed pursuant to grant RDR18000003 from the US Social Security Administration (SSA) funded as part of the Retirement and Disability Research Consortium. The opinions and conclusions expressed are solely those of the author(s) and do not represent the opinions or policy of SSA, any agency of the Federal Government, or NBER. Neither the United States Government nor any agency thereof, nor any of their employees, makes any warranty, express or implied, or assumes any legal liability or responsibility for the accuracy, completeness, or usefulness of the contents of this report. Reference herein to any specific commercial product, process or service by trade name, trademark, manufacturer, or otherwise does not necessarily constitute or imply endorsement, recommendation or favoring by the United States Government or any agency thereof.


