Sugar Restriction at Early Ages Mitigates Genetic Obesity Risk
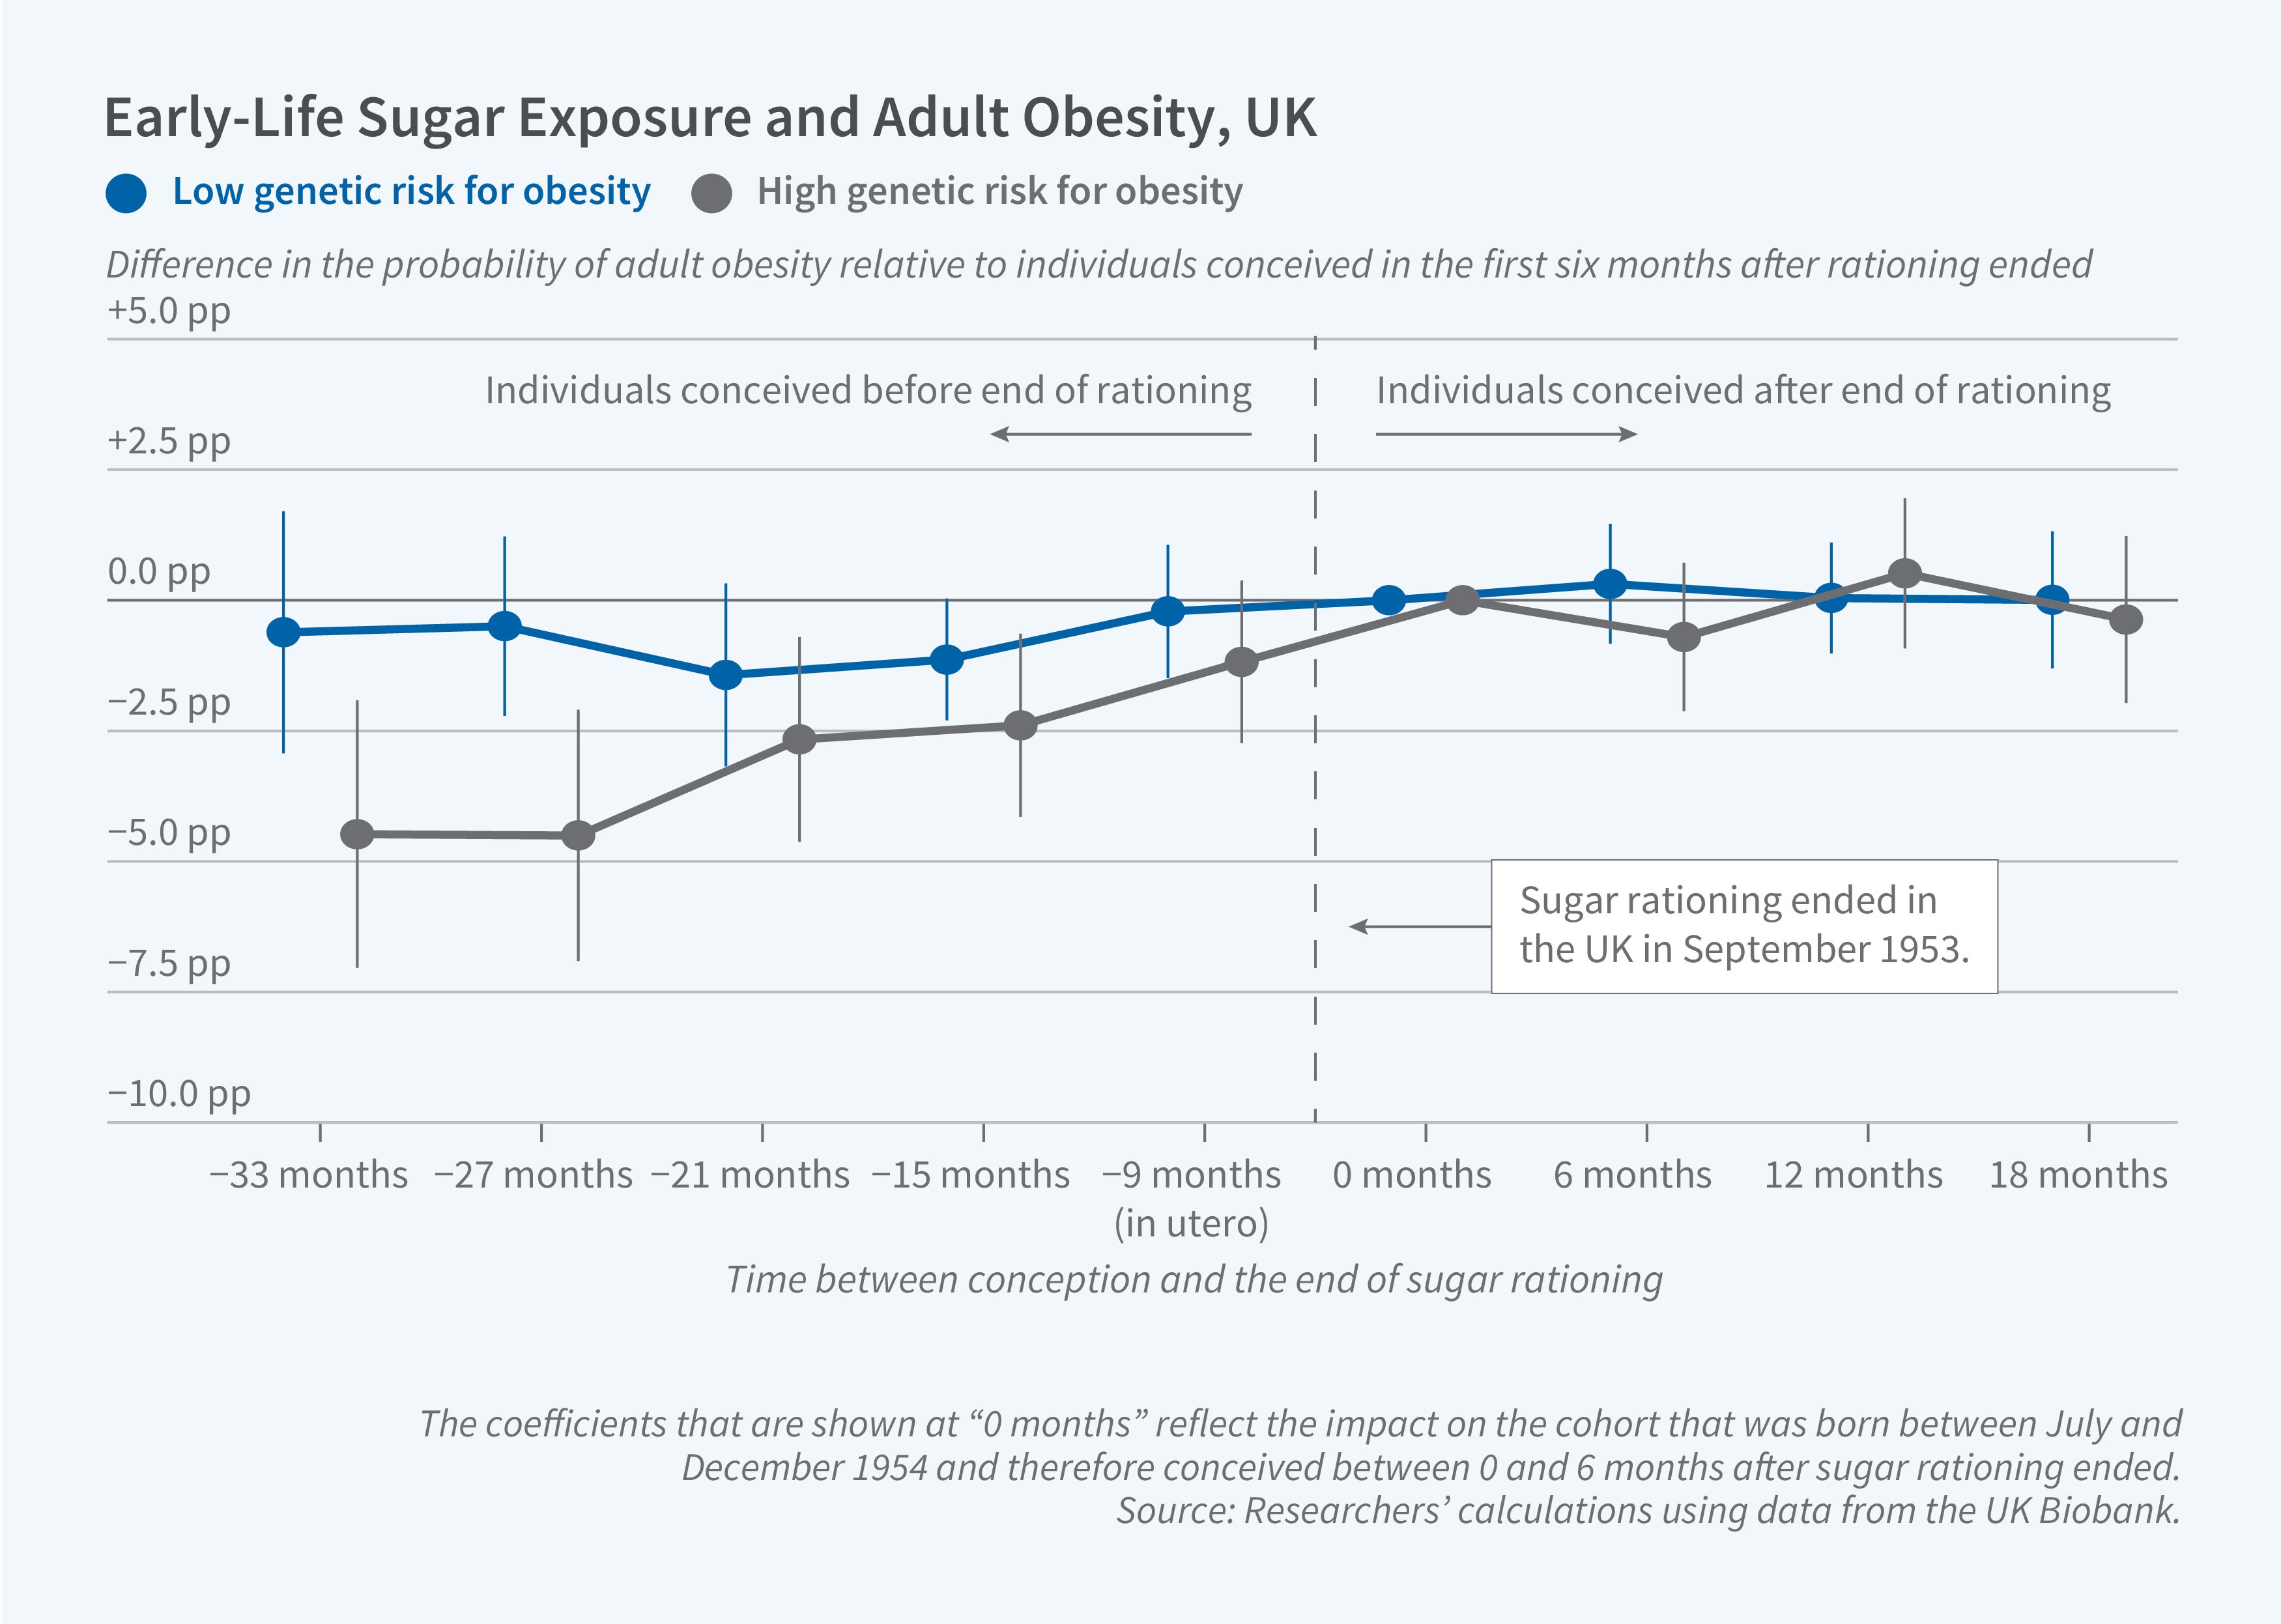
During World War II, the United Kingdom’s sugar rationing policy limited average daily sugar intake to 40 grams for adults and 15 grams for children. When rationing ended in September 1953, sugar consumption rebounded rapidly. In Early-Life Sugar Restrictions Reduce Genetic Disparities in Adult Adiposity (NBER Working Paper 35005), Tadeja Gracner, Claire Boone, Patrick Turley, and Paul Gertler use this dietary variation to test the hypothesis that sugar restriction at young ages counteracts a genetic predisposition for obesity. The researchers compare adult obesity outcomes for individuals conceived before September 1953, who experienced sugar rationing in utero and during early postnatal life, to outcomes for individuals conceived afterwards.
Among individuals genetically predisposed to obesity, sugar rationing in the first year of life reduces the probability of obesity in adulthood by 2.7 percentage points (21 percent).
Using information on 46,914 adults who were born between 1951 and 1956 and contributed data to the UK Biobank between the ages of 52 and 56, the researchers construct a composite index of adiposity. Their index incorporates four normalized measures of body fat: body-mass index, waist-to-hip ratio, body fat percentage, and trunk fat percentage. The researchers identify individuals with index values above the 90th percentile of the never-rationed sample as those with obesity.
They link their adiposity measure to an index of genetic obesity risk, based on genotypes that predict traits associated with obesity. This genetic index explains 8 percent of the variation in the adiposity index. Within the never-rationed sample, the prevalence of obesity was 4 percent among individuals in the lowest tercile of genetic risk, compared to 16 percent in the top tercile.
Adults who were exposed to sugar rationing through age 2 had 0.073 standard deviations less adiposity and 3.2 percentage points (32 percent) lower likelihood of obesity. The health benefits of sugar restriction were concentrated among those with a genetic predisposition to obesity.
Sugar rationing had no impact on the adiposity index or obesity prevalence among adults in the lowest tercile of genetic risk. In contrast, exposure to sugar rationing through age 1 reduced adiposity by 0.082 standard deviations among adults in the two higher-risk terciles, with the magnitude of the effect increasing to 0.117 standard deviations with exposure through age 2. Similarly, higher-risk adults experienced a 2.7 percentage point (21 percent) lower probability of obesity with exposure to sugar rationing through the first year and a 4.5 percentage point (35 percent) lower probability with exposure through age 2.
Because sugar rationing reduced adiposity and obesity among higher-risk adults without affecting lower-risk adults, it decreased the disparity in outcomes between the two groups. Sustained sugar restriction through age 2 narrowed adiposity gaps between the groups by 22 percent and obesity gaps by 40 percent.
The researchers acknowledge financial support from the National Institute on Aging of the National Institutes of Health under grants R01AG065482, P30AG012815, P30AG012839, and T32AG000243.