The Geographic Expansion of Innovative Firms
Most US innovation stems from firms that operate R&D facilities in many local markets. IBM and Google are two prominent examples, with R&D activities—measured by patenting—in approximately 70 and 20 distinct locations, respectively. When a technology company opens an R&D facility in a new location, it may generate knowledge spillovers that benefit nearby firms and inventors. In The Geography of Innovative Firms (NBER Working Paper 34010), Craig A. Chikis, Benny Kleinman, and Marta Prato investigate how the geographic organization of innovative firms affects aggregate economic growth.
Roughly two-thirds of US patenting is done by large firms with R&D facilities in multiple locations. Local innovators in these locations reap spillover benefits from the large firms’ presence.
The researchers merge two comprehensive datasets: PatentsView, which covers the near-universe of US patents since 1976 and includes inventor locations, and Dun & Bradstreet (D&B), which tracks business establishments, with location information. They are able to match 84 percent of US patents over the 1976–2021 period to a business location.
Firms conducting R&D in multiple markets account for approximately two-thirds of all US patenting activity throughout the sample period. Firms appear to pursue technologically similar innovations across their various locations rather than specialize by geography.
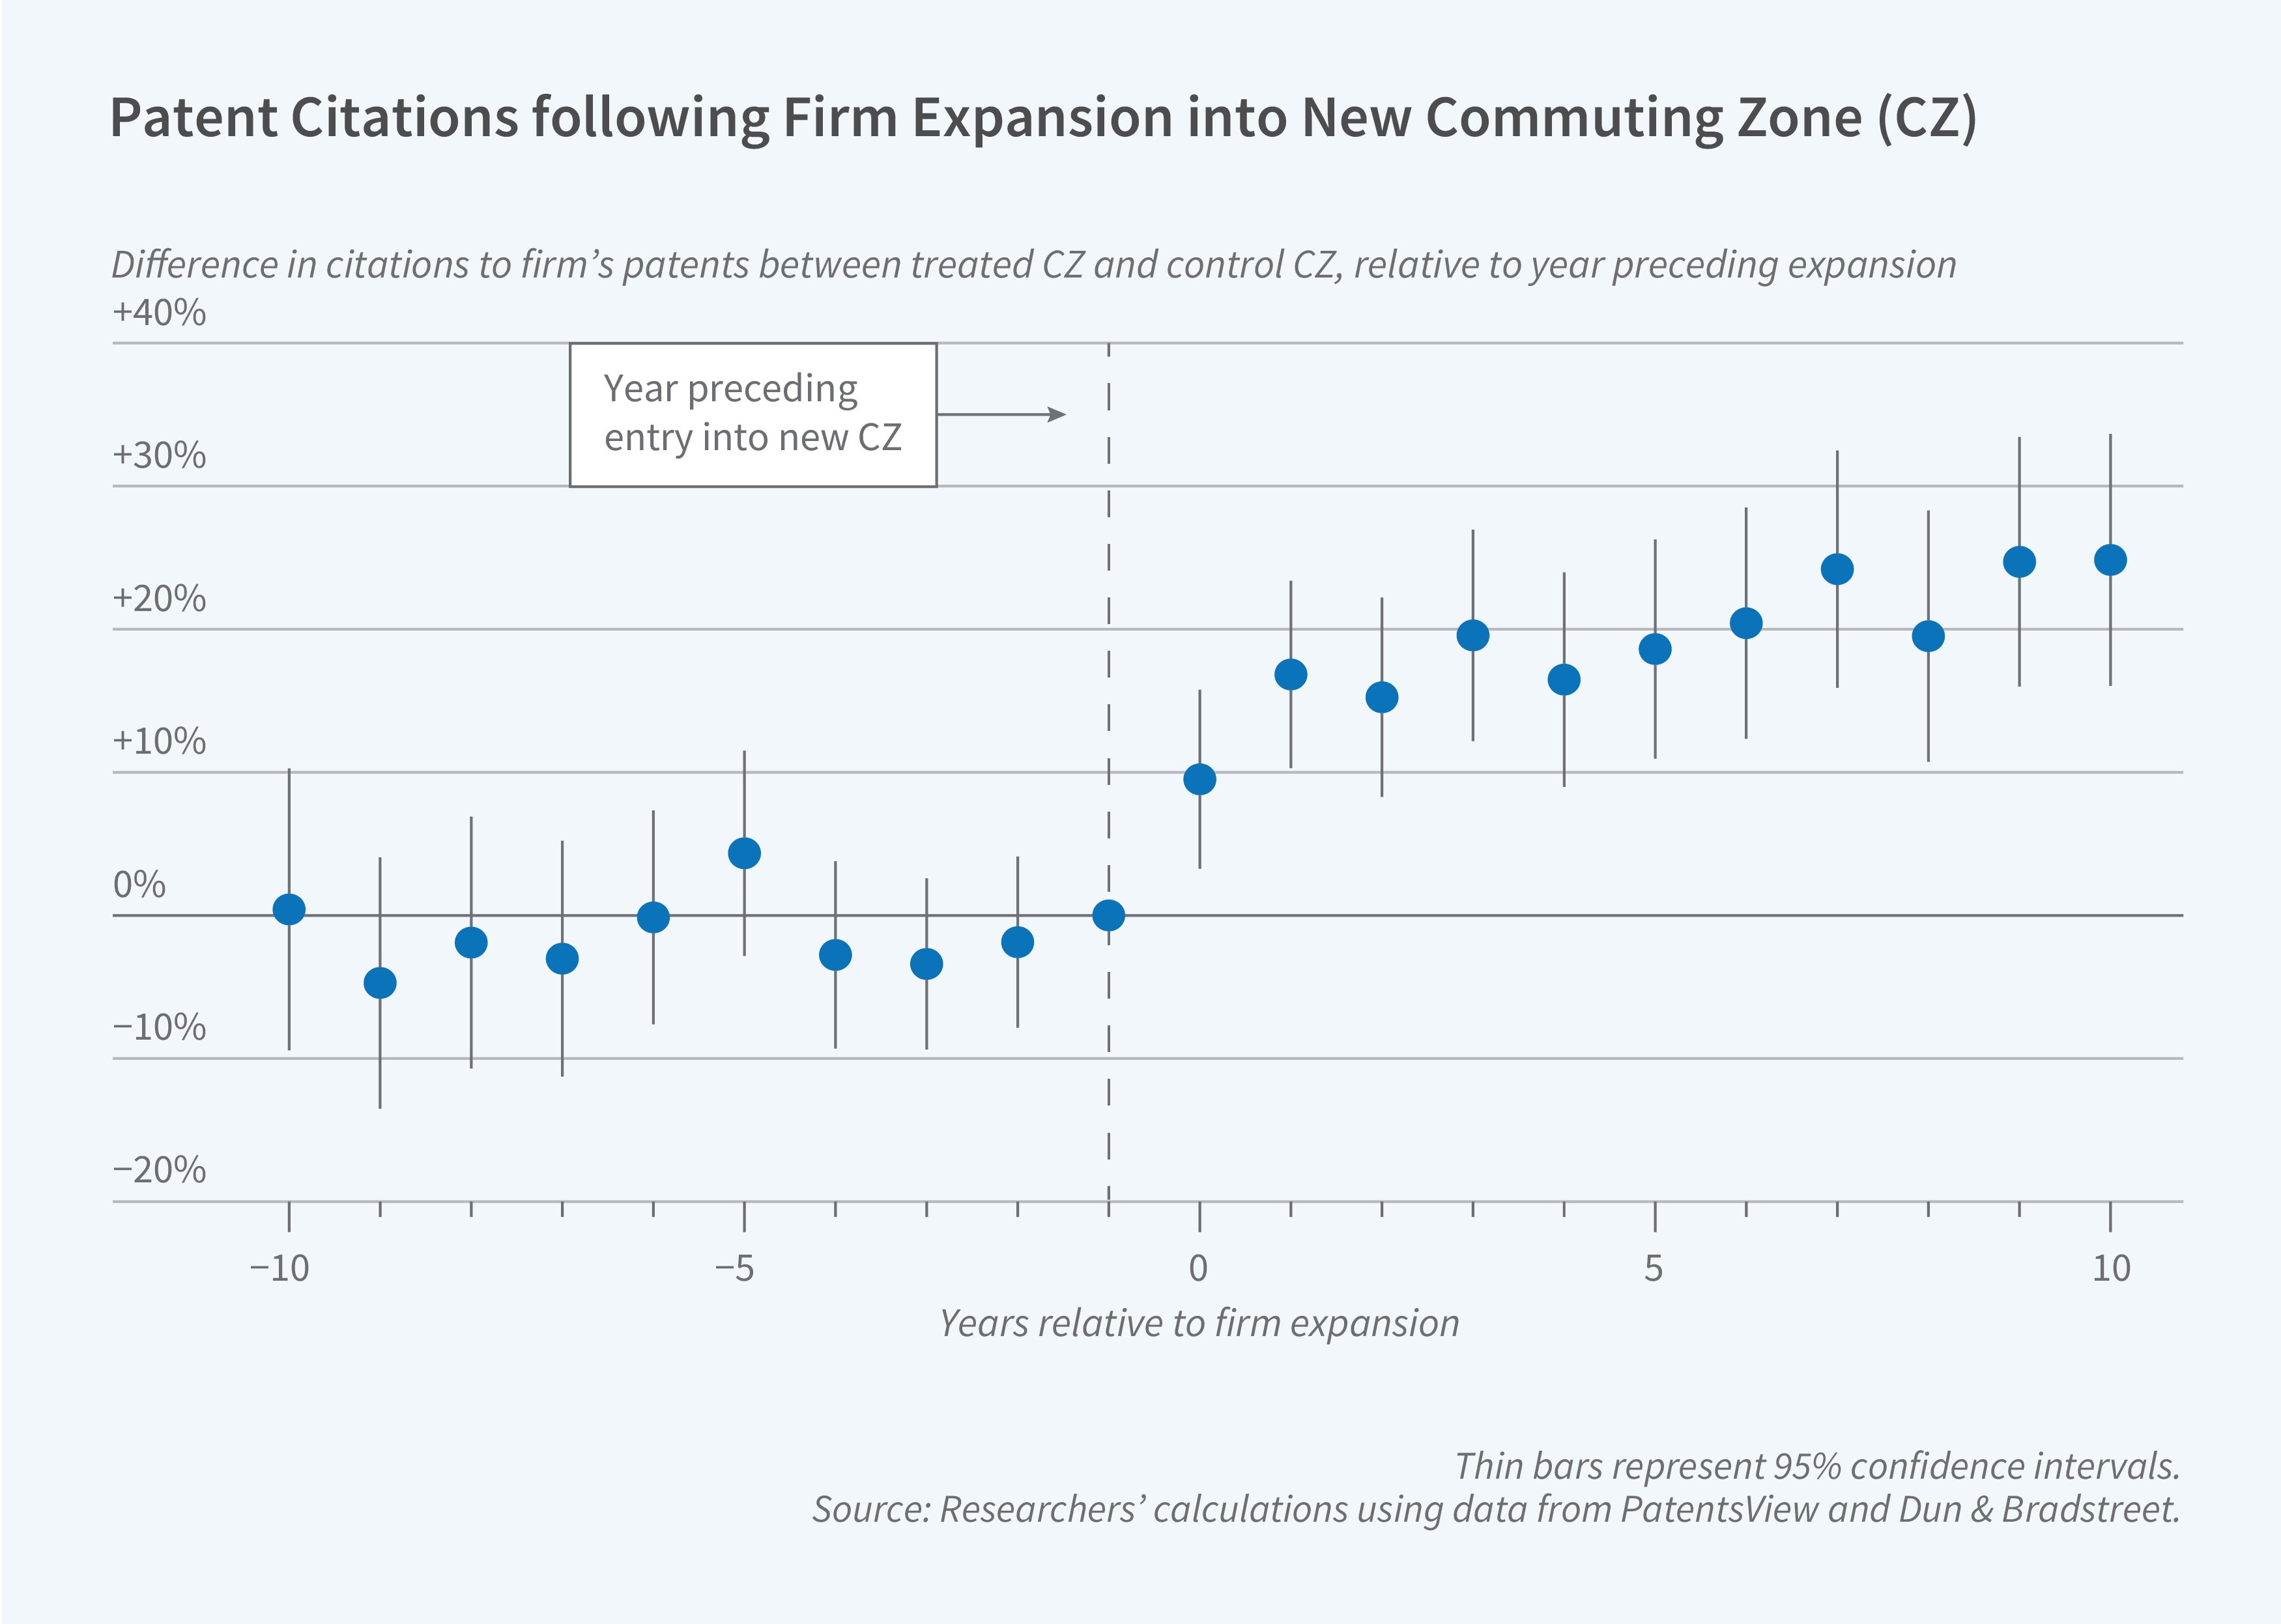
Utilizing an event-study design, the researchers find that when a firm expands into a new commuting zone, there is an increase in external citations to its patents from other inventors in that commuting zone. The increase in the flow of citations grows over time, reaching about 25 percent 10 years after expansion. Patenting efficiency among other firms in the same technology class in that market rises by approximately 10 percent on average. Larger expansions generate greater spillovers, but these spillovers increase less than proportionally with establishment size, suggesting diminishing returns to local firm presence.
The researchers combine their estimates of the spillovers associated with the arrival of a new R&D facility with a quantitative spatial-growth model to examine the potential impact of government incentives designed to encourage greater geographic dispersion of innovative firms. In their model, a standard R&D subsidy costing 0.1 percent of GDP would raise US consumer welfare by 0.15 percentage points relative to a no-subsidy case. In contrast, a subsidy that encourages spatial expansion by innovative firms could raise consumer welfare even more, by between 0.19 and 0.29 percent. Moreover, it would have very different distributional implications. Standard R&D subsidies concentrate wage gains in already high-wage innovation hubs, while subsidizing spatial expansion generates greater wage growth in lower-wage regions, reducing spatial inequality.
The researchers acknowledge research support from the University of Chicago, including the Becker Friedman Institute for Economics, Stanford University, and Bocconi University.


