Rate of Return on Emerging Market Infrastructure Projects
Roughly 1 billion people live more than two kilometers from an all-season road, primarily in emerging-market and developing economies (EMDEs), where limited access to paved roads constrains growth and development. Despite a critical investment shortfall, in the absence of readily accessible data on historical returns, private investors remain reluctant to invest in EMDE infrastructure. Two recent studies construct new datasets to estimate the social and private returns to infrastructure investment in EMDEs.
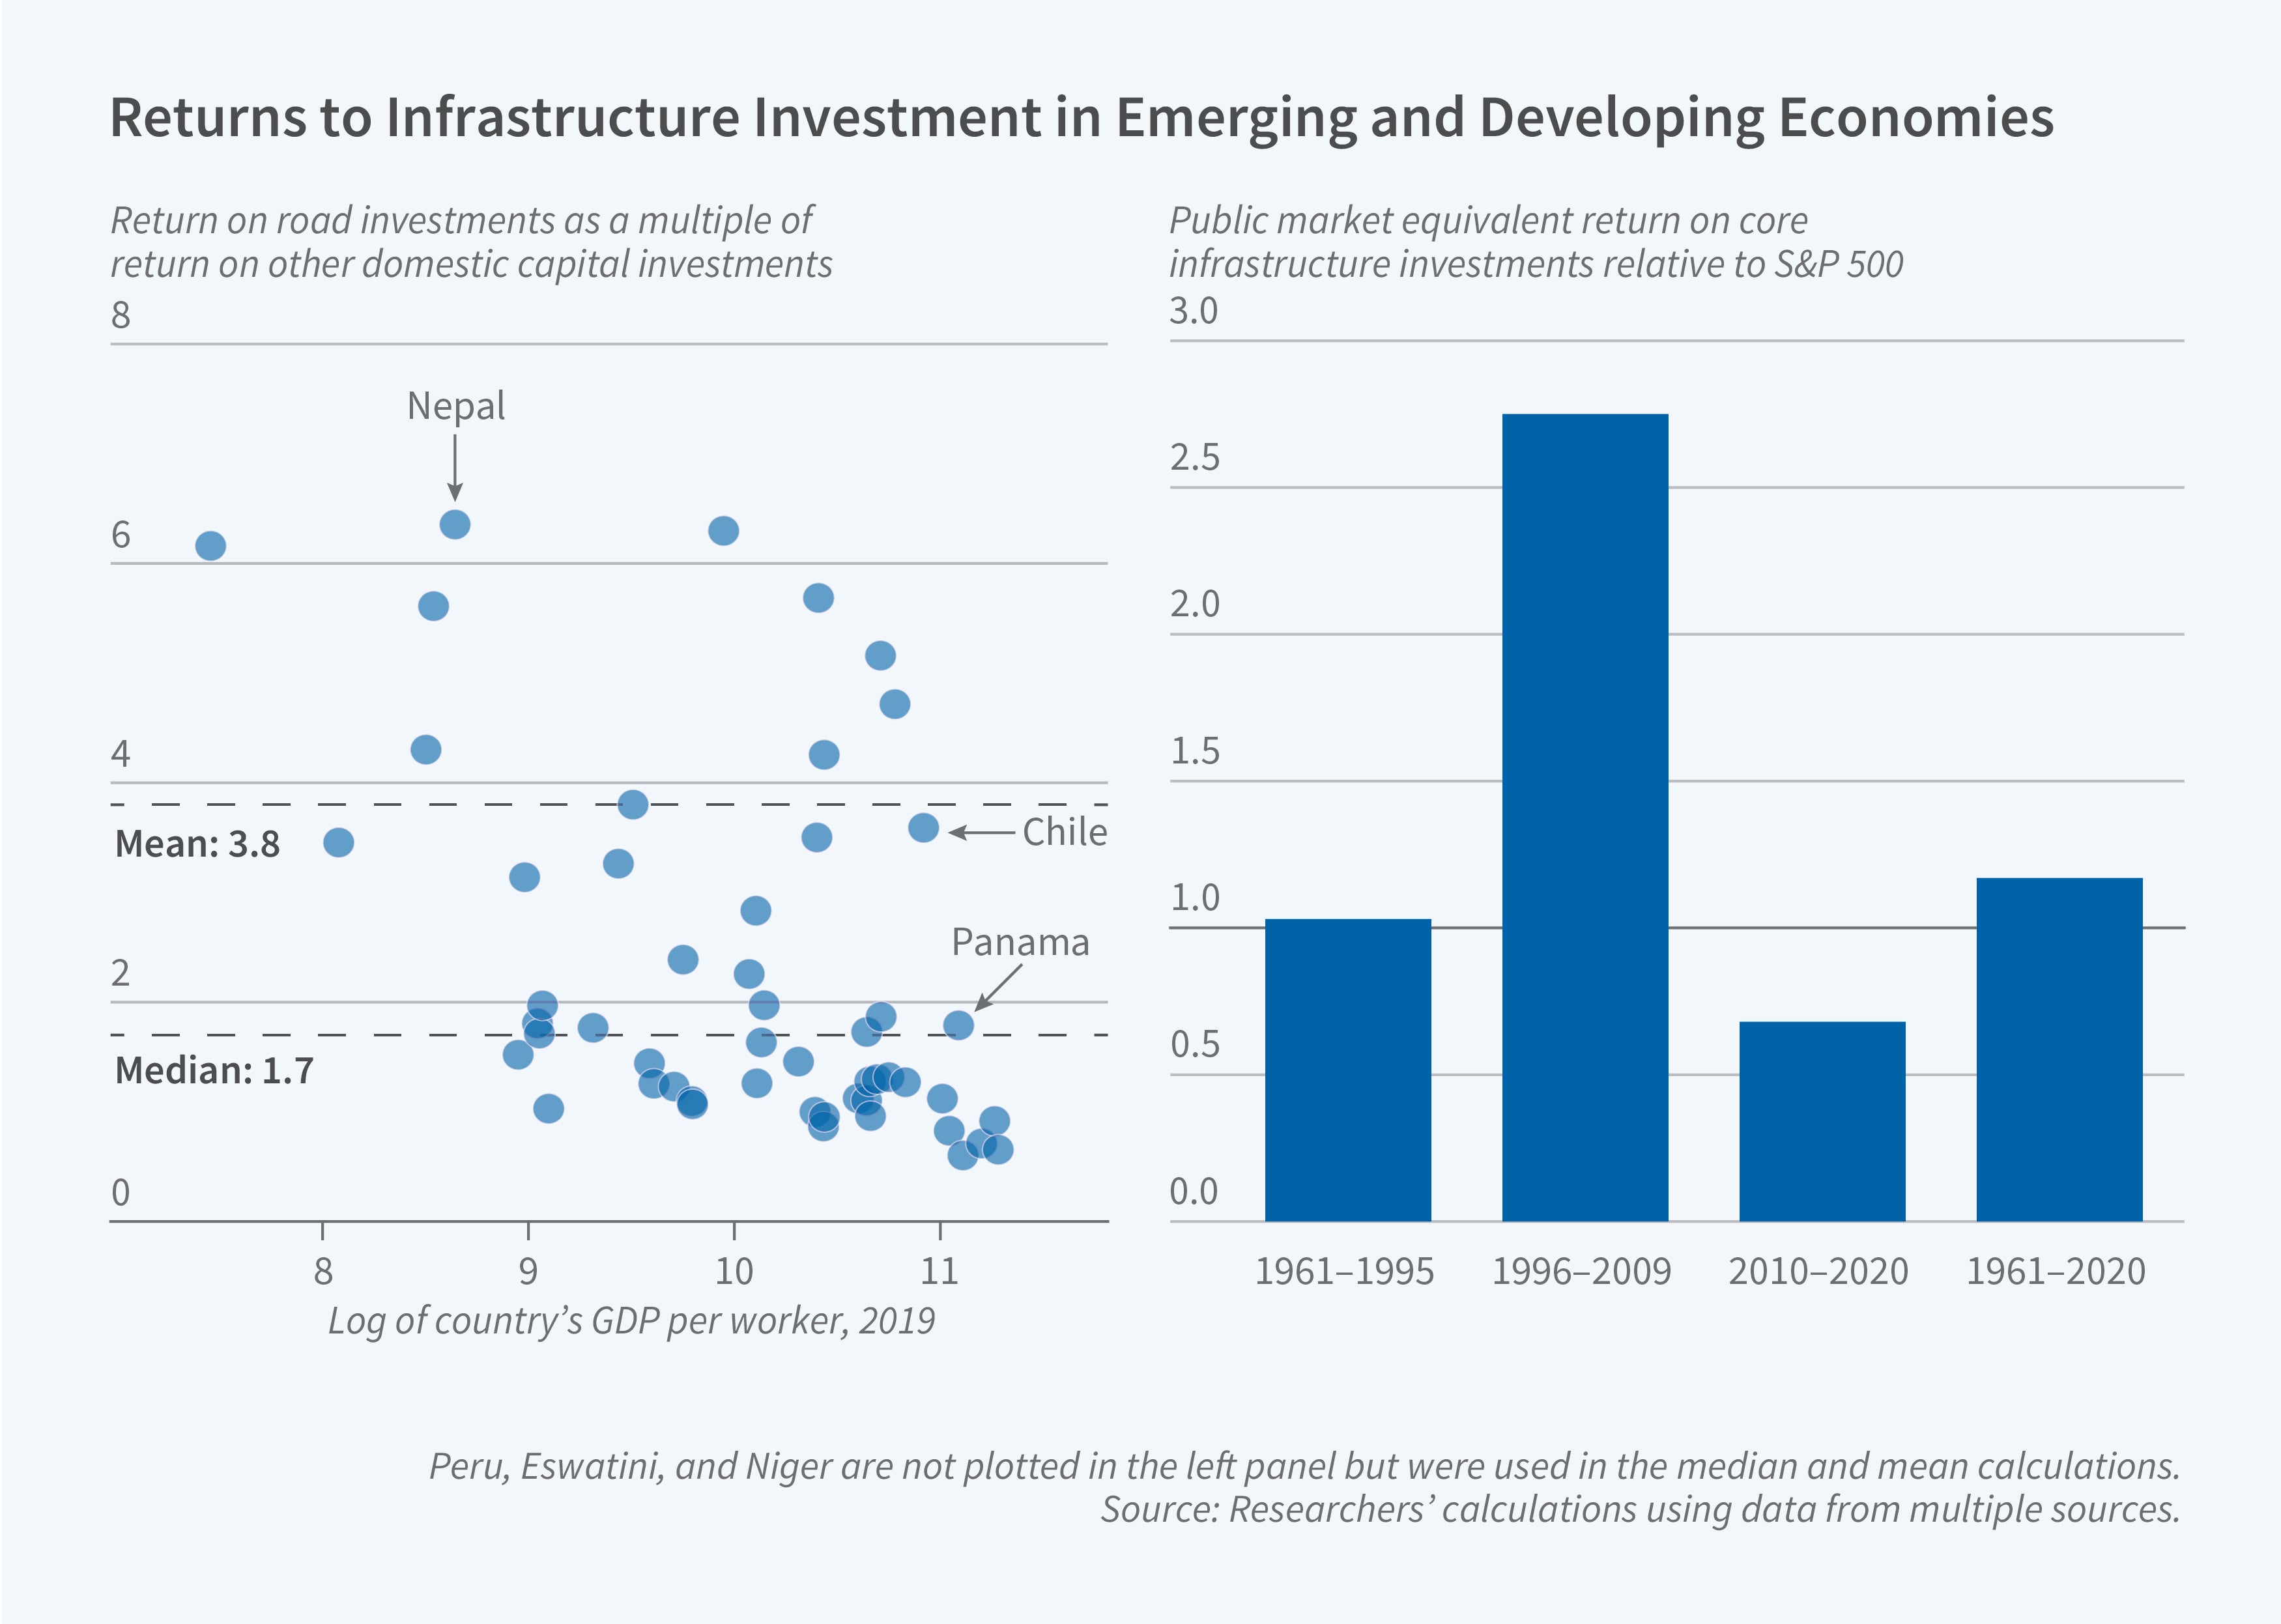
In The Social Rate of Return on Road Infrastructure Investments (NBER Working Paper 34501), Anusha Chari, Peter Blair Henry, and Pablo Picardo estimate country-specific social rates of return to road construction in 55 EMDEs. Using a production-function framework and data from 1960 to 2019, they estimate each country’s marginal product of public capital and combine these estimates with country-specific road construction costs from the World Bank’s Roads Cost Knowledge System.
The researchers find that the median social rate of return to building an additional kilometer of two-lane highway in EMDEs is 55 percent, with a mean of 97 percent, roughly eight and fourteen times the 7 percent social rate of return on private capital in the United States. Although returns on roads vary widely across EMDEs, they exceed the returns on domestic private capital in those same countries. Moreover, the excess social return on roads far exceeds the excess financial return on emerging-market equities that previously incentivized the creation of that asset class.
The marginal product of public capital averages $1.3 million (2017 USD) per kilometer, with a median of $950,000. Average construction costs are $1.89 million per kilometer but vary considerably across countries. Together, these findings suggest potentially large, unrealized gains from reallocating developed-country savings toward public capital formation in EMDEs. The researchers interpret these macro-level estimates alongside complementary micro-level and financial evidence.
In a second study, Financial Returns to Equity Investments in Infrastructure in Emerging-Market and Developing Economies (NBER Working Paper 34537), Chari, Henry, Yanru Lee, and Paolo Mauro examine the financial performance of infrastructure investments made by the International Finance Corporation, the private-sector arm of the World Bank Group, between 1961 and 2020. The researchers analyze equity investments in core infrastructure, which includes electric power, information, transportation, warehousing, and utilities. For each project, the researchers compute a Public Market Equivalent (PME) that compares the project's discounted cash flows to those of a benchmark public equity index. A PME greater than 1.0 indicates outperformance relative to public markets.
Using the S&P 500 as a benchmark, the authors estimate a PME of 1.17 for the portfolio of 266 equity investments, corresponding to an average excess return of about 2.0 percentage points per year over an average eight-year holding period. When benchmarked against the MSCI Emerging Markets Index, the PME rises to 1.26, implying an annual excess return of 2.9 percentage points. Relative to country-specific MSCI indices, the average PME is 1.31. Over the full sample period, these estimates indicate that equity investments in emerging-market infrastructure delivered higher financial returns than portfolios of publicly listed equities.
By contrast, investments initiated between 2010 and 2020 exhibit a PME of 0.68 relative to the S&P 500, indicating underperformance during that decade. The researchers attribute this finding to unusually strong returns in the US equity market, weaker macroeconomic conditions in some emerging markets, and the US dollar's appreciation relative to EMDE currencies. Despite this recent weakness, the researchers find broad-based outperformance over the six-decade sample period, with the infrastructure investment asset class exceeding S&P 500 returns for countries in most World Bank income categories and geographic regions.


