From Cash to Central Bank Digital Currency
Central banks of many countries are seriously considering replacing cash with some form of central bank digital currency — often referred to as CBDC. This will be a large change, perhaps second only in importance to the widespread adoption of fiat currency during the twentieth century. As with any new, untried system, evaluation of it has to rely both on theoretical ideas and on empirical studies that quantify the effects of past reforms that most resemble the proposed change. In this piece I summarize some of the empirical work that various colleagues and I have done to shed light on the potential effects of adopting a CBDC. Most of the work uses either natural or field experiments we thought could help evaluate the cost and benefit of replacing cash with a nationwide, centralized digital payment system.
My research has focused on the loss of private benefits if cash is abolished as a means of payment. The welfare loss of not being able to use cash depends both on the intensity of cash use and on the benefit per unit of cash used. While there are clearly private losses from not being able to use cash, many economists point out that there are also social costs of using cash, such as facilitating tax evasion via an informal sector and also in leading to other crimes. A notable countrywide experiment was the 2016 India demonetization plan, enacted in part to remove from circulation certain large-denomination bills that were used for such purposes. It entailed nonnegligible costs.1 Macroeconomists add to the cost of cash the inability to set negative nominal interest rates, which can be a useful monetary policy tool under special circumstances.2
Estimating the Value of Transacting in Cash
David Argente and I estimate the private welfare costs of banning the use of cash.3 We concentrate on the use of cash to pay for Uber rides in Mexico. While in developed nations Uber rides generally are paid for electronically, in developing countries, including Mexico, it is quite common for a large share of Uber trips to be paid for in cash. On the one hand, Uber rides are only one good or service, so extrapolating our conclusions to other goods and services should be done with caution. On the other hand, we argue that our studies offer a very nice combination of both natural and field experiments to estimate the welfare losses from a ban on cash.
We employ two approaches: quasi-natural experiments, where we examine data from the effects of either cash bans or cash introductions into a particular market, and randomized controlled trials where, for example, riders face different prices depending on their payment method. While our papers contain detailed analysis and review of each experiment, here I only summarize the key findings.
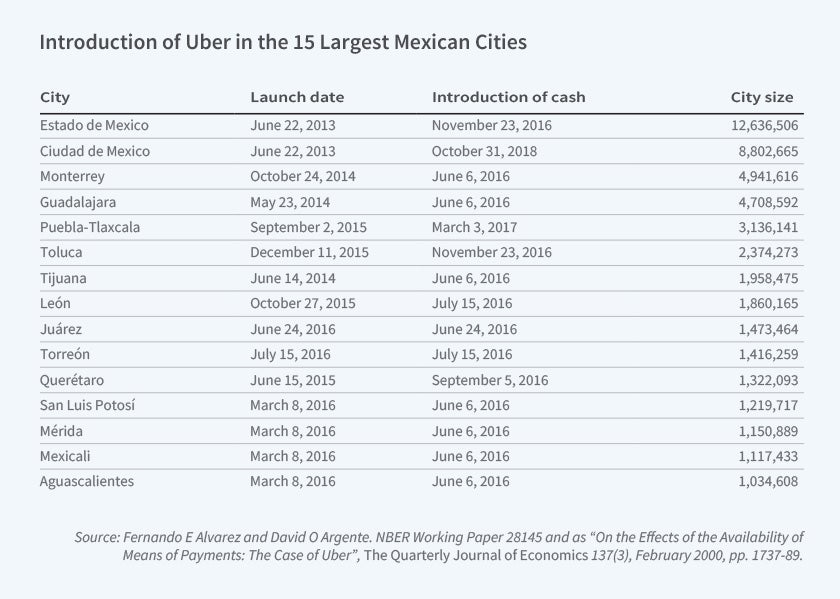
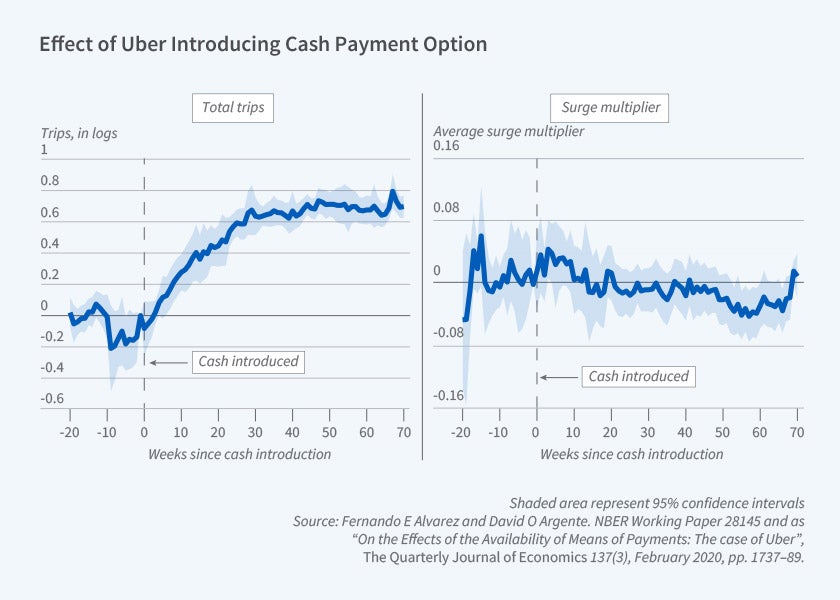
In 15 cities in Mexico, cash was introduced as a form of payment for Uber after the entry of Uber into those cities. For those cities, at first only digital payments were accepted. We use a standard event study to estimate the magnitude of many outcomes of interest after cash became an acceptable means of payment (Figure 1). After the introduction of cash, there was a large increase in the number of trips and total expenditure on Uber rides. The number of drivers increased, but less than the number of riders, with total weekly hours increasing by the same approximate percentage as total fares. While there was a very large increase in rides, about doubling in less than a year, there was no increase in prices or customer wait times for pickup, or in prices of alternative means of transportation such as taxis (Figure 2). These findings suggest that the availability of cash as a means of payment made the ride-hailing service much more valuable to consumers.
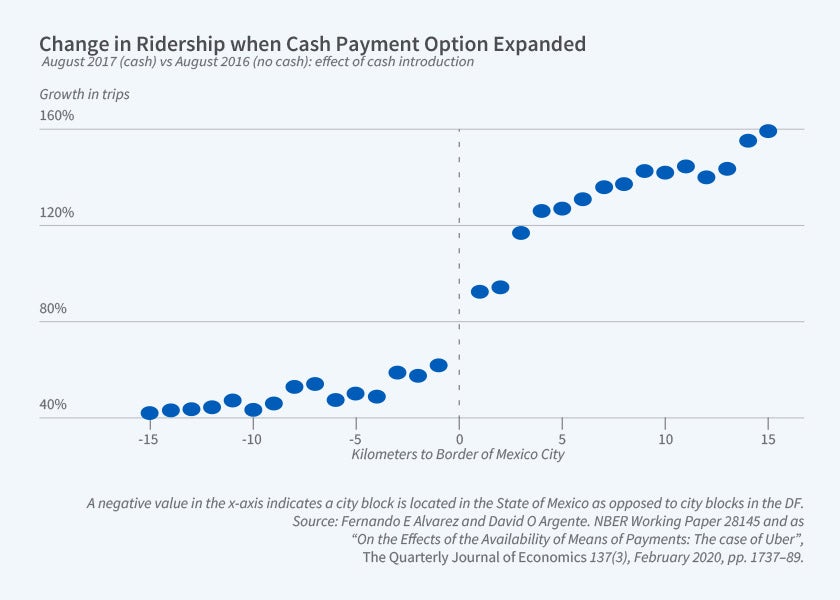
Mexico City, with more than 20 million metro area residents and one of the top 10 Uber-use volumes, offers a rich natural experiment. The metropolitan area is divided into two parts: the Federal District, with national regulation, and a surrounding area that is part of the subnational State of Mexico, where state-level regulation applies. Cash payment for Uber was introduced at the end of 2016 in Mexico City, but only riders whose trips originated in the greater metro area — in the State of Mexico — were allowed to use cash. For rides that began in the city proper (the DF), cash was not an option until November 2018, after the Mexican Supreme Court ruling on cash payments.
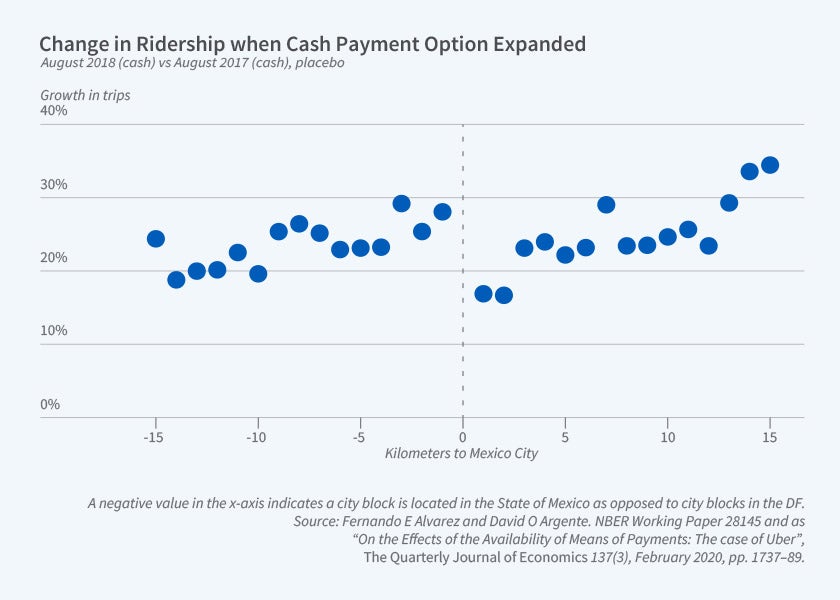
In our research, we geolocalize all the Uber rides to the city block in which they started for one month in the year before the introduction of cash (August 2016), one month in the year after the introduction of cash (August 2017), and also for one month a year later (August 2018). Analyzing rides originating in each census block, we find that neighborhoods with higher permanent income — denoted by characteristics such as higher education and greater internet connectivity — took a smaller share of trips with cash (Figure 3, Panels A and B). Comparing the growth rate of trips before and after the introduction of cash for comparable blocks in the State of Mexico and in the DF, we find that trips originating in the State of Mexico grew at a much higher rate, showing a large effect of the availability of cash payments on the use of Uber. Our preferred estimates come from using a regression discontinuity design with the distance to the border, which shows a large increase — on the order of 40 percent — in trips originating from city blocks in the State of Mexico compared to trips originating from city blocks near them in the DF (Figure 3, Panel A). As a check of our hypothesis, we use the same comparisons between August 2017 and August 2018, when cash was already available in both years, and find no effect around the boundary (Figure 3, Panel B).
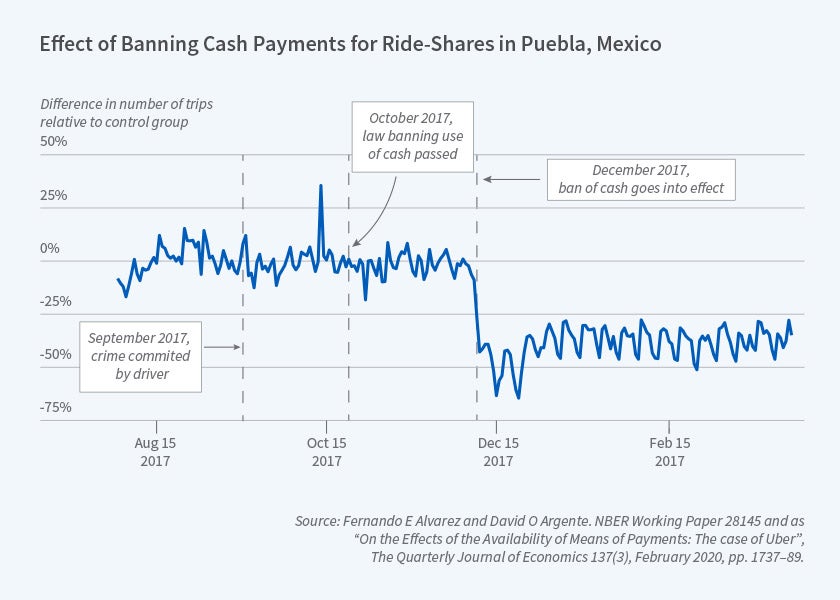
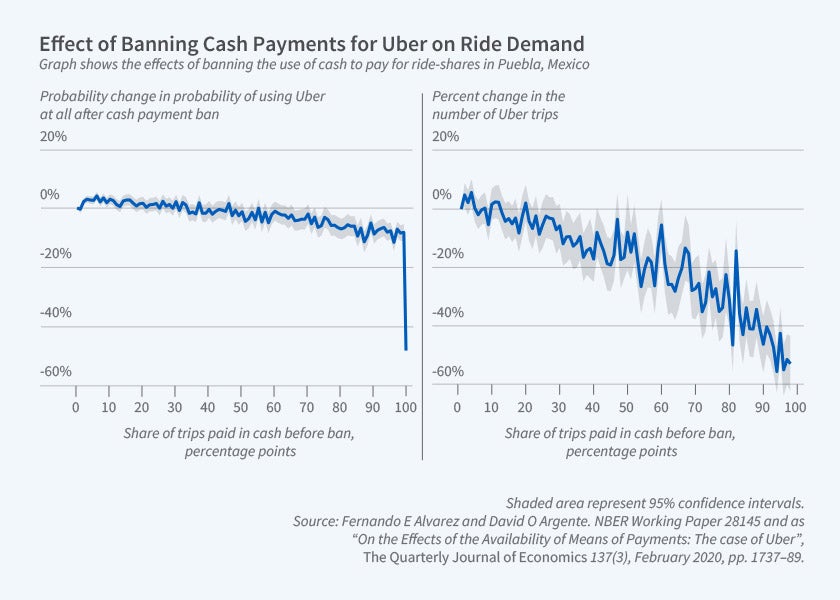
We also analyze data on Uber traffic in other cities to provide additional evidence on the effect of allowing cash payments. Following a crime in the city of Puebla that was allegedly committed by a driver for an Uber competitor, in December 2017 that city banned cash payments for all app-based ride services. Using data on ride-sharing traffic in other cities as our controls, we estimate a 50 percent reduction in trips by riders who used cash and had not registered a credit card. Over time, about one-third of these cash users registered a credit card with Uber and ridership rose, but the drop-off was still 40 percent (Figure 4). To understand the effect of means of payment on the use of Uber, we sort the riders by the fraction of rides paid in cash before the ban among the riders who had paid using both cash and credit cards before the ban. The fraction of trips paid for in cash before the ban predicts the drop-off in trips when cash was banned (Figure 5).
It is noteworthy that Mexico City and Puebla are the Mexican cities with the lowest shares of trips paid for in cash, about 40 percent. Other Mexican cities have cash payment rates twice as high, reflecting the cash dependence of many Mexicans.
Evidence from Field Experiments
To complement our analysis of quasi-natural experiments, we also ran three large field experiments, each involving over 100,000 Uber riders within the State of Mexico. Using price discounts and credits, we measured riders’ responsiveness to incentives and found that riders change payment methods to some degree in response to incentives. We interpret that to mean consumers attach a high value to the use of their preferred means of payment, which for many riders is cash. This implies a large private welfare cost to a ban on the use of cash.
Two of our experiments involved providing incentives to cash riders, those who had not registered a credit card with Uber. In one, discounts of 10, 15, 20, and 25 percent were offered to four groups of 23,000 riders, with a control group of 56,000 for whom prices remained stable. This experiment established the price elasticity of demand for Uber rides among cash users. It provides information on the cost of not having the cash payment option for those who have no other means of payment.
Our second experiment with cash riders involved six control groups of about 20,000 cash users, each of whom received rewards equal to three, six, or nine times their average weekly expenditures if they registered a credit card within a week, and for other groups the same rewards if they registered a card in six weeks. This experiment provides information on the cost to cash users of registering a credit card as a means of payment. This experiment was motivated by the experience in Puebla, where about a third of cash users registered a card when cash payments were abolished. Cash riders were responsive to the incentives to register, but their responses were moderate, indicating a relatively large cost of obtaining an alternative to cash.
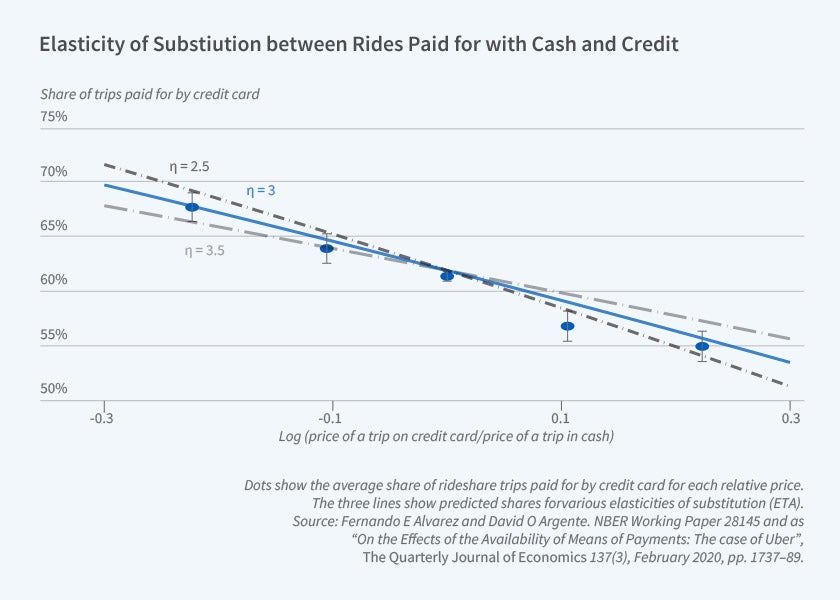
Surprisingly, about half of State of Mexico riders alternate the use of cash and credit cards, in different proportions. We refer to these riders as mixed users. We conducted an experiment where four groups of 20,000 such riders each were offered discounts of different magnitudes that applied only if they paid with cash or with a credit card, and a control group of 90,000 riders were offered the regular price regardless of the means of payment. One group received a 10 percent discount if they paid in cash, a second group a 20 percent discount if they paid in cash, a third group a 10 percent discount if they paid with a credit card, and a fourth group a 20 percent discount if they paid with a card. In this experiment riders also substitute consistently toward the cheaper means of payment, but the effect was small; many riders still chose to ride using the means of payment without the discount. We estimate an elasticity of substitution of 3: the ratio of trips paid with credit relative to cash changes by three times the change in the relative price (Figure 6). Again, we interpret this as showing riders’ strong attachment to their preferred means of payment, and hence a large cost of abolishing cash.
These experiments allow us to estimate the consumer surplus for Uber riders from the use of cash. Not all cash riders are wholly dependent on cash, as some will move to credit cards under certain conditions. However, in the State of Mexico, about 25 percent of riders are dependent on cash, and about 50 percent of riders with a registered credit card use both cash and credit. We estimate that a cash ban imposes a cost on consumers equal to about 50 percent of the value of trips paid for with cash.
The Cost of Abolishing Cash
In other work we compare the private social cost of abolishing cash with its social benefits.4 We use a natural experiment on the change of means of payment for a large welfare program in Mexico to estimate the social cost of cash payments inducing higher rates of crime and/or the growth of the informal sector. We also use the estimated elasticities for cash use among Uber passengers, together with the cash intensity across all goods, to estimate a lower bound on the private cost of abolishing cash for all goods and services. For the range of estimated parameters, eliminating the use of cash reduces welfare.
We caution that our analysis neglects many issues, including the classic insight from monetary economics that the value of a means of payment can have large increasing returns to scale. For a given user, the value of the means of payment increases with the fraction of the population that uses that means of payment. This natural monopoly argument is one of the reasons given for a digital currency to be issued by a central bank.
We assess the importance of this argument, which can motive a big push toward adopting a nationwide means of payment, using the natural experiment of the adoption of Bitcoin as legal tender in El Salvador.5 We find scant evidence of the effectiveness of a big push. We also use several rich datasets from Costa Rica to assess this effect in a peer-to-peer digital transfer system operated by the Central Bank of Costa Rica.6 We find evidence of increasing returns in the use of this digital transfer app. Our analysis of the experiences in these two countries thus yields mixed evidence on the returns to scale of the introduction of digital payment.
Endnotes
“Cash and the Economy: Evidence from India’s Demonetization, Chodorow-Reich G, Gopinath G, Mishra P, Narayanan A. The Quarterly Journal of Economics 135(1), February 2020, pp. 57–103.
The Curse of Cash, Rogoff KS. Princeton, NJ: Princeton University Press, 2017.
“Consumer Surplus of Alternative Payment Methods: Paying Uber with Cash,” Alvarez FE, Argente DO. NBER Working Paper 28133, November 2020. Published as “On the Effects of the Availability of Means of Payments: The Case of Uber,” The Quarterly Journal of Economics 137 (3), August 2022, pp. 1737–1789,
“Cash: A Blessing or a curse?” Alvarez F, Argente D, Jimenez R, Lippi F. Journal of Monetary Economics 125, January 2022, pp. 85–128.
“Are Cryptocurrencies Currencies? Bitcoin as Legal Tender in El Salvador,” Alvarez FE, Argente D, Van Patten D. NBER Working Paper 29968, February 2023.
“Strategic Complementarities in a Dynamic Model of Technology Adoption: P2P Digital Payments,” Alvarez FE, Argente D, Lippi F, Méndez E, Van Patten D. NBER Working Paper 31280, May 2023.


