Program Report: Monetary Economics, 2021
For much of the last decade, policymakers in advanced economies have grappled with challenges resulting from the Great Recession of 2007–09 and sovereign debt problems in Europe. During this time, inflation was persistently below targets set by central banks in the United States, Europe, and Japan. As a consequence, a major focus of research and practice was how to further stimulate these economies through unconventional monetary policy and raise their rates of inflation toward target levels.
More recently, the global economic downturn and subsequent rebound associated with COVID-19 have shifted the focus of both research and practice. In 2021, advanced economies — and especially the United States — have experienced a substantial increase in inflation, to levels well above target. This has raised concerns about the reemergence of inflation that have been largely dormant for some time.
Alongside these macroeconomic developments, the field of monetary economics has been influenced by other societal changes, such as rising inequality, increasing concern about climate change, and the development of new technologies such as blockchains and cryptocurrencies.
Several strands of methodological and theoretical advances also have made a large imprint on the field of monetary economics over the past decade. On the empirical side, researchers have increasingly embraced new data sources, including high-frequency and cross-sectional data, and methods of identification. The increased use of forward guidance — statements by central banks about the future path of policy rates — has raised significant theoretical issues and resulted in a burst of innovative research. Also, the development of heterogeneous agent New Keynesian models — HANK models — has been important.
In this brief program report, we highlight several strands of innovative research on these issues, conducted by affiliates of the NBER’s Monetary Economics Program.
Negative Nominal Interest Rates
Conventional wisdom has long held that nominal interest rates cannot fall below zero. The reason for this is that once nominal interest rates are negative, cash earns a higher return than lending. Who would deposit their money in a bank or purchase a Treasury bill when these assets earn less than simply holding cash? This “zero lower bound” on nominal interest rates clearly affected policy during the Great Recession. Many central banks quickly lowered interest rates to zero or very close to zero, and stopped at that point.
Over the past decade, this conventional wisdom has been challenged. It is costly to hold large amounts of cash. It is therefore not clear that negative interest rates will lead to the rush for cash that conventional wisdom suggests. In the mid-2010s, several European central banks as well as the Bank of Japan decided to test negative waters. Figure 1 — taken from work by Mauricio Ulate — shows the evolution of policy rates in the Euro area, Denmark, Sweden, Switzerland, and Japan since 2010.1 Switzerland and Denmark have ventured farthest into negative territory, with policy rates reaching −0.75 percent.
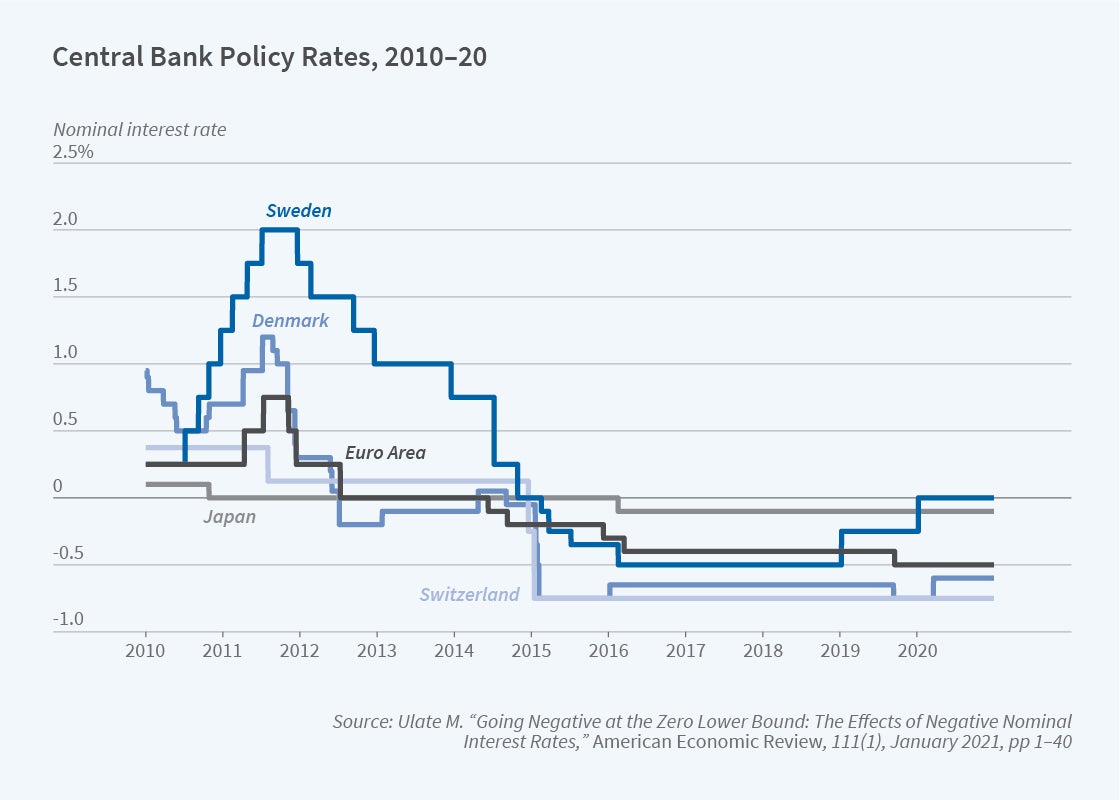
Figure 1
An important concern with negative nominal interest rates is how they affect bank profitability. If deposit rates do not fall below zero — because of bank concerns regarding depositor reactions to such a move — while lending rates and yields on other bank assets fall, negative nominal rates will potentially squeeze bank interest rate margins. Banks may react to this by not reducing lending rates or, if they do cut rates, reduced profits may adversely affect their net worth and therefore their ability to lend. Markus Brunnermeier and Yann Koby present a formal model that captures these effects. In their model, if interest rates fall below a certain level, which they call the “reversal interest rate,” further reductions in interest rates become counterproductive.2
A major focus of research has been on the extent to which changes in policy rates pass through into deposit and lending rates once policy rates become negative. Gauti Eggertsson, Ragnar Juelsrud, Lawrence Summers, and Ella Getz Wold study this question using Swedish data.3 They find that pass-through of policy rate changes into both deposit and lending rates falls to zero once the policy rate becomes negative. They also find that negative policy rates hurt bank profitability and conclude that negative rates are unlikely to be an effective tool for stimulating the economy. Ulate uses data from several countries to assess these same questions. He finds that pass-through to deposit rates collapses, but pass-through to lending rates remains substantial. He concludes that rate cuts are about 60 to 70 percent as effective when policy rates are negative as they are when policy rates are positive.
One conclusion from this research is that the lower bound on nominal interest rates is not zero. Acknowledging this, economists and policymakers now increasingly refer to the “effective lower bound” on nominal interest rates rather than the “zero lower bound.” But exactly what the effective lower bound is remains to be determined.
The Forward Guidance Puzzle
Over the past 20 years, central banks have made increasing use of forward guidance about interest rates and other aspects of policy. The increased use of forward guidance originally stemmed from a realization that transparent communication by central banks about how interest rates would react to economic developments could make monetary policy more effective. Research by Michael Woodford has significantly advanced our understanding of these ideas.4 Forward guidance became even more important when nominal interest rates in many countries hit what was perceived to be the effective lower bound. At that point, many central banks, including the Federal Reserve, were forced to rely more heavily on forward guidance and other unconventional monetary policy instruments.
This development led researchers to analyze in more detail the effectiveness of forward guidance through the lens of standard macroeconomic models. Early work by researchers at the Federal Reserve yielded puzzling results: modest amounts of forward guidance seemed to have implausibly large effects on output and inflation.5 Alisdair McKay, Emi Nakamura, and Jón Steinsson showed that this implication results from the extremely forward-looking nature of standard macroeconomic models and the assumption that consumers and firms can act on their beliefs through financial markets with frictionless borrowing and saving.6 In these models, an expected fall in interest rates far in the future creates a sustained output boom. The boom is highly inflationary and can easily result in extreme increases in both output and the price level.
This was soon recognized as an important defect of the class of models commonly used by researchers to analyze macroeconomic policy, with implications for many policy questions beyond forward guidance. A great deal of theoretical research has focused on how various simplifying assumptions that are often viewed as innocuous contribute to these perverse implications. McKay, Nakamura, and Steinsson relax the common assumption of complete markets and show that uninsurable income risk and liquidity constraints make households less responsive to interest rates in the distant future.7 Iván Werning shows that uninsurable income risk and liquidity constraints can amplify or mute the effects of forward guidance depending on the cyclicality of risk.8 George-Marios Angeletos and Chen Lian show that modest deviations from the usual assumption that everyone has full common knowledge about future interest rates attenuate general equilibrium feedback associated with far-future interest rates.9 Emmanuel Farhi and Werning show that the combination of uninsurable income risk, liquidity constraints, and a form of bounded rationality known as level-k thinking mitigates the effects of monetary policy and especially the effects of forward guidance at long horizons.10 Xavier Gabaix shows that another type of bounded rationality, partial myopia toward distant atypical events, has similar effects.11 Finally, Pascal Michaillat and Emmanuel Saez show that incorporating wealth in household utility functions also mutes the effects of forward guidance about the distant future.12
What Is Going On with Inflation?
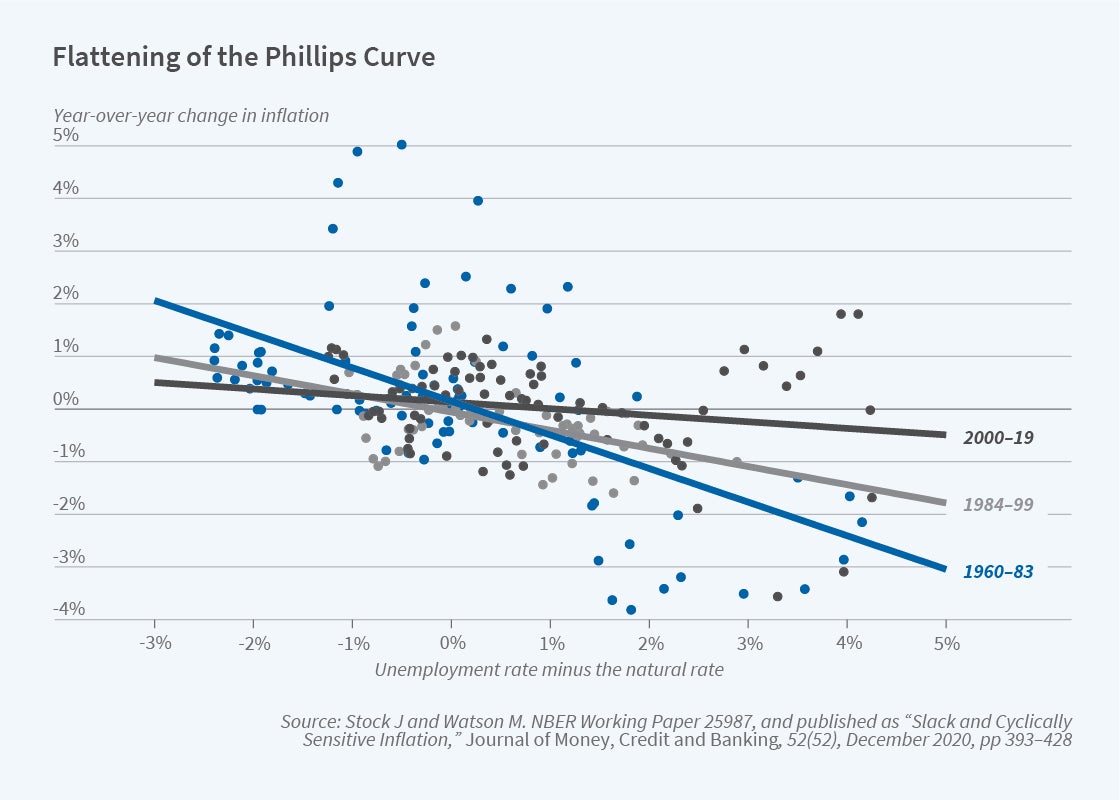
Inflation in the United States has risen sharply this year. There is a very lively ongoing debate about the causes of this rise and the extent to which it may persist. In this context, it is easy to forget that for most of the preceding several decades, research and policy discussions about inflation focused on why inflation was so stable despite substantial variation in unemployment and other measures of economic slack. Both the current and the prior inflation debates are to a large degree about the nature of the Phillips curve, which describes how much inflation rises in response to a decline in unemployment and an increase in labor market tightness.
Conventional wisdom about the Phillips curve was arguably shaped by the disinflation period in the 1980s when, under the leadership of Paul Volcker, the Federal Reserve tightened monetary policy sharply. Unemployment rose sharply and inflation fell sharply. Many view this as convincing evidence that the Phillips curve is “steep” — that high unemployment has a large, negative causal effect on inflation. But if this view is true, the history of inflation since 1990 presents a series of puzzles. Unemployment fell to very low levels both in the late 1990s and in the late 2010s without inflation rising appreciably. Furthermore, unemployment rose as much in the Great Recession as it did in the early 1980s without inflation falling nearly as much. This led many to argue that the Phillips curve had become flatter. Figure 2 — taken from work by James Stock and Mark Watson — illustrates the flattening of the Phillips curve.13
Several explanations have been given for this apparent flattening. Laurence Ball and Sandeep Mazumder argue that a Phillips curve specification with inflation measured using median inflation and economic slack measured using the short-term unemployment rate fits the data well from 1985 onward.14 Olivier Coibion and Yuriy Gorodnichenko argue that the apparent lack of responsiveness of inflation to economic slack in the aftermath of the Great Recession is due to an increase in inflation expectations from 2009 to 2011 resulting from rising oil prices over this period.15 In contrast, Ben Bernanke and Frederic Mishkin argue that the apparent flattening of the Phillips curve is due to inflation expectations becoming more firmly anchored.16
Recent research has used regional data to shed further light on the Phillips curve. Michael McLeay and Silvana Tenreyro argue that because monetary policy often offsets variation in aggregate demand, it is difficult to estimate the Phillips curve using aggregate data.17 They use regional data from 28 US metropolitan areas to estimate the Phillips curve. Peter Hooper, Mishkin, and Amir Sufi also use US metropolitan area data to estimate the Phillips curve.18 Both studies find that the slope of the Phillips curve is substantial in the cross section. Martin Beraja, Erik Hurst, and Juan Ospina consider the wage Phillips curve and find that it is steeper in the cross section than in the aggregate.19 Using newly constructed state-level inflation data, Jonathon Hazell, Juan Herreño, Nakamura, and Steinsson argue that the slope of the Phillips curve has flattened only modestly since the 1980s.20 We argue that about two-thirds of the fall in inflation during the Volcker disinflation period was caused by long-run inflation expectations shifting downward.
The rise of US inflation in the summer and fall of 2021 has been substantially larger and faster than in the last few US recoveries. Long-term inflation expectations have up to this point been relatively well anchored and therefore do not provide an explanation. An unusual feature of the COVID-19 recession and the recovery has been a large shift in demand from services to goods. Veronica Guerrieri, Guido Lorenzoni, Ludwig Straub, and Werning show that such a sectoral shift will manifest itself as a “cost-push” shock in the Phillips curve, driving inflation up at a given level of unemployment.21 Other forces that may be playing significant roles include a sustained fall in labor supply and highly expansionary fiscal policy. Analyzing these issues will be an important focus of research in the Monetary Economics Program over the next few years.
Endnotes
“Going Negative at the Zero Lower Bound: The Effects of Negative Nominal Interest Rates,” Ulate M. American Economic Review 111(1), January 2021, pp. 1–40.
“The Reversal Interest Rate,” Brunnermeier M, Koby Y. NBER Working Paper 25406, December 2018.
“Negative Nominal Interest Rates and the Bank Lending Channel,” Eggertsson G, Juelsrud R, Summers L, Wold E. NBER Working Paper 25416, revised September 2020.
“Optimal Monetary Policy Inertia,” Woodford M. NBER Working Paper 7261, July 1999, and The Manchester School, 67(Supplement), 1999, pp. 1–39; “Central Bank Communication and Policy Effectiveness,” Woodford M. NBER Working Paper 11898, December 2005, and presented at Jackson Hole Economic Policy Symposium, “The Greenspan Era: Lessons for the Future,” August 2005, Jackson Hole, Wyoming; “Forecast Targeting As a Monetary Policy Strategy: Policy Rules in Practice,” Woodford M. NBER Working Paper 13716, December 2007.
“Inflation and Output in New Keynesian Models with a Transient Interest Rate Peg,” Carlstrom C, Fuerst T, Paustian M. Journal of Monetary Economics 76, November 2015, pp. 230–243; “The Forward Guidance Puzzle,” Del Negro M, Giannoni M, Patterson C. Federal Reserve Bank of New York Staff Report 574, revised December 2015.
“The Power of Forward Guidance Revisited,” McKay A, Nakamura E, Steinsson J. NBER Working Paper 20882, revised July 2015, and American Economic Review 106(10), October 2016, pp. 3033–3158.
“Incomplete Markets and Aggregate Demand,” Werning I. NBER Working Paper 21448, August 2015.
“Forward Guidance without Common Knowledge,” Angeletos G, Lian C. NBER Working Paper 22785, October 2016, and American Economic Review 108(9), September 2018, pp. 2477–2512.
“Monetary Policy, Bounded Rationality, and Incomplete Markets,“ Farhi E, Werning I. NBER Working Paper 23281, March 2017, and American Economic Review 109(11), November 2019, pp. 3887–3928.
“A Behavioral New Keynesian Model,” Gabaix X. NBER Working Paper 22954, revised June 2019, and American Economic Review 110(8), August 2020, pp. 2271–2327.
“Resolving New Keynesian Anomalies with Wealth in the Utility Function,” Michaillat P, Saez E. NBER Working Paper 24971, revised December 2019, and Review of Economics and Statistics 103(2), May 2021, pp. 197–215.
“Slack and Cyclically Sensitive Inflation,” Stock J, Watson M. NBER Working Paper 25987, June 2019, and Journal of Money, Credit, and Banking 52(S2), December 2020, pp. 393–428.
“A Phillips Curve with Anchored Expectations and Short-Term Unemployment,” Ball L, Mazumder S. NBER Working Paper 20715, November 2014, and Journal of Money, Credit, and Banking 51(1), February 2019, pp. 111–137.
“Is the Phillips Curve Alive and Well After All? Inflation Expectations and the Missing Disinflation,” Coibion O, Gorodnichenko Y. NBER Working Paper 19598, October 2013, and American Economic Journal: Macroeconomics 7(1), January 2015, pp. 197–232.
“Inflation Expectations and Inflation Forecasting,” Bernanke B. Speech given at the NBER Summer Institute, July 2007; “Inflation Dynamics,” Mishkin F. NBER Working Paper 13147, June 2007, and International Finance 10(3), Winter 2007, pp. 317–334.
“Optimal Inflation and the Identification of the Phillips Curve,” McLeay M., Tenreyro S. NBER Macroeconomics Annual 2019 34, 2020, pp. 199–255.
“Prospects for Inflation in a High Pressure Economy: Is the Phillips Curve Dead or Is It Just Hibernating?” Hooper P, Mishkin F, Sufi A. NBER Working Paper 25792, May 2019.
“The Aggregate Implications of Regional Business Cycles,” Beraja M, Hurst E, Ospina J. NBER Working Paper 21956, February 2016, and Econometrica 87(6), November 2019, pp. 1789–1833.
“The Slope of the Phillips Curve: Evidence from US States,” Hazell J, Herreño J, Nakamura E, Steinsson J. NBER Working Paper 28005, revised May 2021.
“Monetary Policy in Times of Structural Reallocation,” Guerrieri V, Lorenzoni G, Straub L, Werning I. Presented at Jackson Hole Economic Policy Symposium, “Macroeconomic Policy in an Uneven Economy,” August 2021.


