Long-Run Trends and the Natural Rate of Unemployment
Starting with Milton Friedman and Edmund Phelps, academics and policymakers have endeavored to measure a sustainable level of unemployment and the implications that deviations from this level have for inflation of prices and wages. This natural rate of unemployment, u*, is broadly defined as the unemployment rate at which, controlling for supply shocks, inflation remains stable.
Long-run trends in the labor market and changes in inflation expectations make it hard to pin down this natural rate of unemployment. Specifically, the dramatic trend decline in unemployment and the concurrent anchoring of inflation expectations since the 1980s have triggered extensive discussions in policy and academic circles. My recent work focuses on using detailed data on labor market flows and inflation expectations to estimate the natural rate of unemployment.
In this report, I first focus on the drivers of the trend decline in unemployment and review my work that connected this decline to two prominent long-run trends in the economy: the grand gender convergence and the dual aging of workers and firms. Then I summarize my work and discuss a unified framework that I have developed with Richard Crump, Stefano Eusepi, and Marc Giannoni for estimating the natural rate of unemployment. While I mostly focus on the period before the COVID-19 pandemic, I end with a discussion of the effect of the pandemic on the natural rate of unemployment.
Trend Decline in the Unemployment Rate
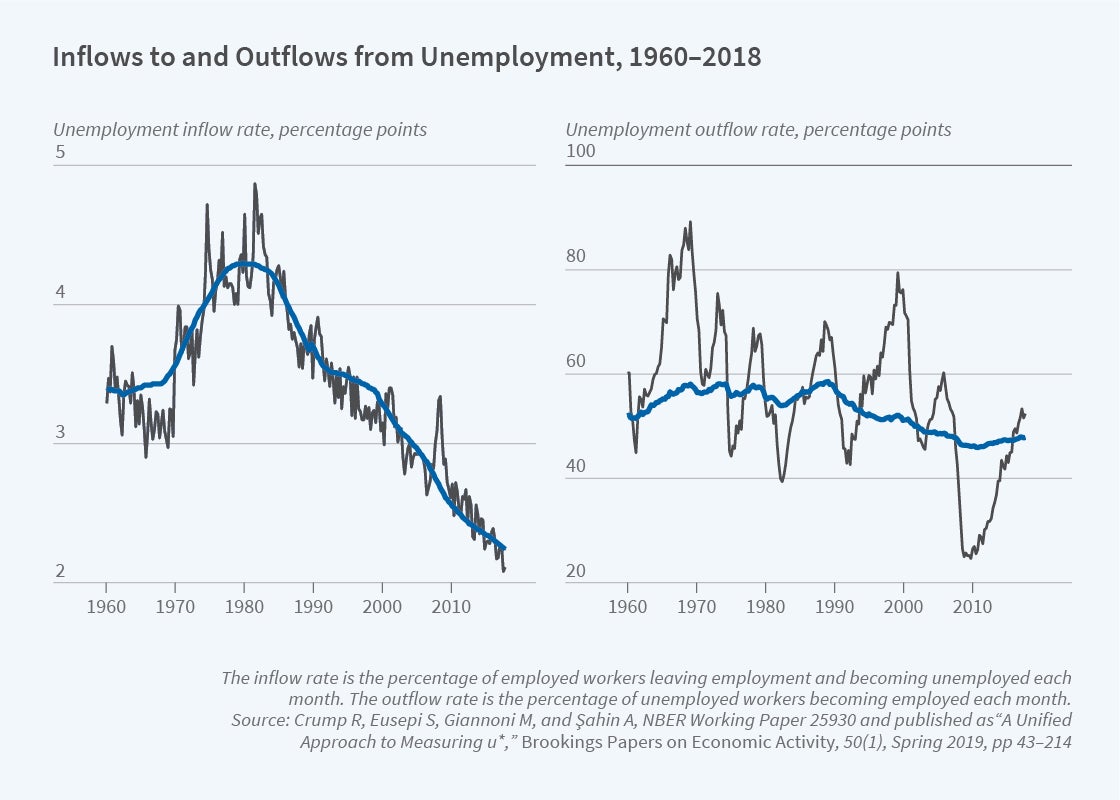
A useful insight from my research with Michael Elsby and Bart Hobijn is that the flow origins of unemployment rate movements provide useful information about the underlying drivers of unemployment fluctuations and trends.1 The idea is simple: the unemployment rate increases either because more workers become unemployed (inflows increase) or it becomes harder for the unemployed to leave unemployment (outflows decrease). Visual examination of inflow and outflow rates in Figure 1 shows that the inflow rate is characterized by sharp, short-lived spikes during recessions, while the outflow rate from unemployment is strongly procyclical with persistent downswings during recessions. The figure also shows the secular trends in these flow rates, estimated using flow data by detailed demographics with a state-space method that I developed with Crump, Eusepi, and Giannoni.2 The two flows that shape the evolution of the unemployment rate over time exhibit differential long-run trends. The inflow rate has a striking downward trend declining gradually to 0.02, with half of its level preceding the twin recessions of the early 1980s. In contrast, there is no evident trending behavior in the outflow rate.
This stark decline in the rate at which workers become unemployed caused about a 1 percentage point decline from the 1980s to the 1990s and another 1.5 percentage point decline from the 1990s to 2020 in the long-term trend rate of unemployment. Interestingly, this downward trend continued even after the dramatic job losses of the Great Recession, underscoring the importance of secular trends in the labor market. My research has focused on explaining this declining incidence of unemployment.
Grand Gender Convergence
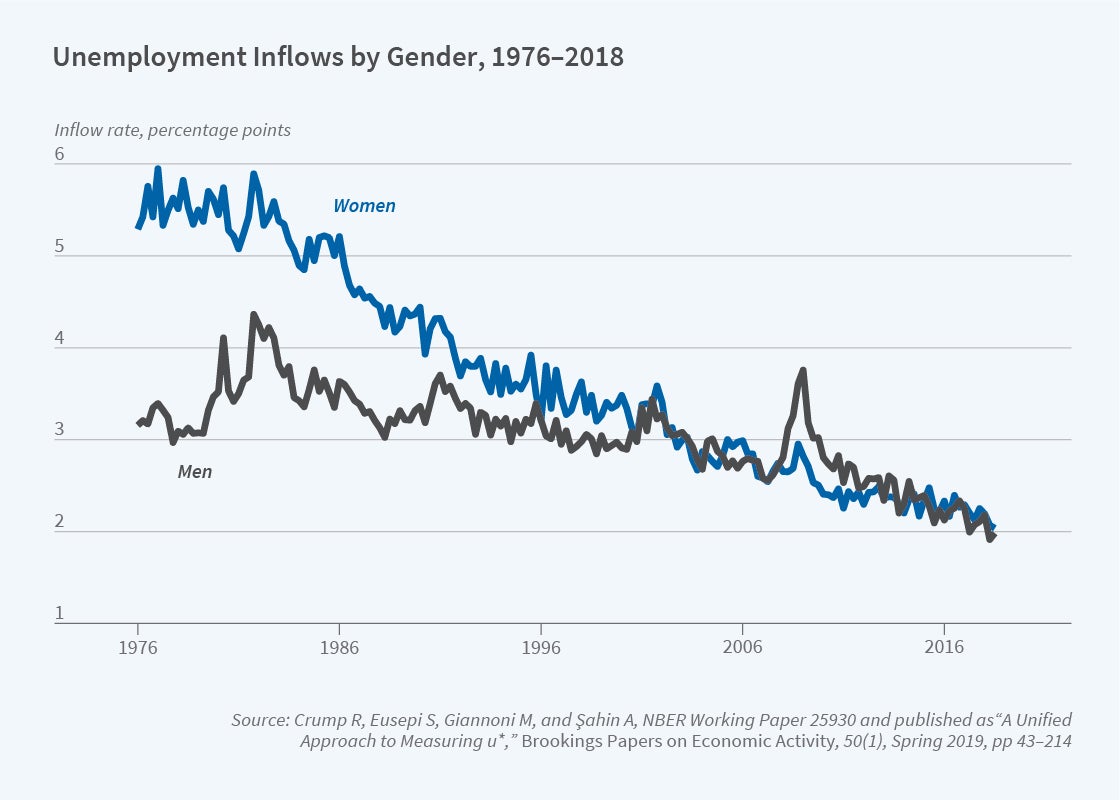
The United States experienced grand gender convergence in the 20th century, with female labor force participation, the fraction of all women who are in the labor force, increasing from around 47 percent in 1976 to approximately 60 percent in 2000.3 The main driver of the rise in the female labor force participation rate was the increase in participation of married women with children. Women started to work longer into their pregnancies and to work sooner after childbirth than their counterparts in the 1960s, likely due to changes in social norms, more widespread availability of maternity leave, which facilitated return to women’s previous jobs, and advances in maternal health and child care. As labor market interruptions declined, women’s labor force attachment gradually increased. Having stretches of uninterrupted employment allowed women to build more stable employment relationships. Stefania Albanesi and I found that this reduced frictional unemployment through a decline in the incidence of job loss and the incidence of unemployment during reentry into the labor force.4 Figure 2 shows the unemployment inflow rate by gender.
During the 1980s and 1990s, the unemployment inflow rate for women, which had been higher than that for men, converged to men’s rate, driving down the secular trend of unemployment. The importance of gender convergence was relatively minor after 2000. This is when another prominent trend — dual aging — took over.
Dual Aging
The US economy has been experiencing a striking shift toward older workers and older firms since the mid-1990s. While the change in worker demographics is directly attributable to the drastic increase in births following World War II, the emphasis on aging of firms is relatively new, as data have only recently become available. Benjamin Pugsley and I show that declining births of firms almost fully account for the shift of employment toward older firms.5 Moreover, in joint work with Fatih Karahan, Pugsley and I find that the origin of the decline in firm entry is the decline in labor supply growth arising from the aging of the baby boom cohort and the flattening out of the female labor force participation rate.6 We establish a clear link from worker to firm demographics.
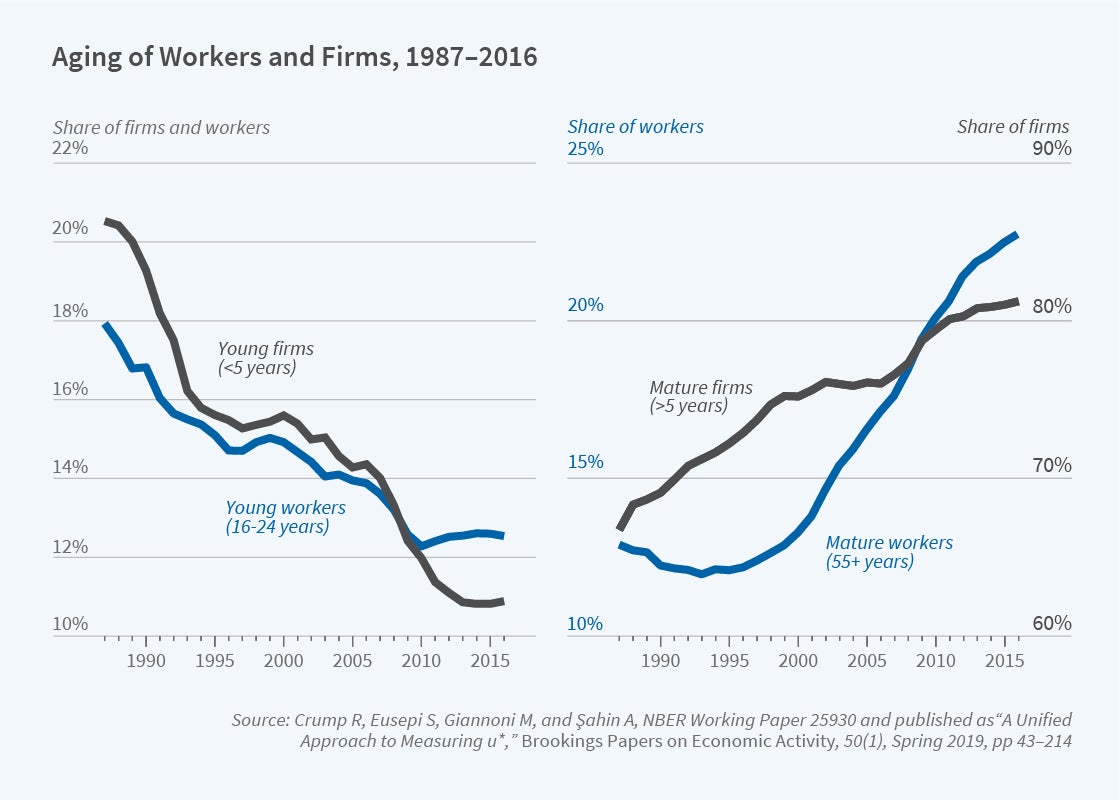
The aging pattern is stark. Around 18 percent of the labor force consisted of workers between 16 and 24 years old (young workers in Figure 3) in 1987. By 2017, the number had declined to 10 percent. The employment share of firms less than five years old also followed a similar pattern, with their share declining from around 20 percent to 10 percent. On the flip side, in 1987, firms 11 or more years old —mature firms — employed about two-thirds of the workers in the economy. By 2017, the number of workers in mature firms had increased to 80 percent. [Figure 3]
Younger workers are four times more likely to become unemployed than prime-age workers. Similarly, firms aged between one and five years old are twice as likely to eliminate jobs as their older counterparts. These patterns suggest that declines in unemployment and job destruction are direct consequences of dual aging. While the shift in worker and firm age composition falls short of accounting for the decline in the inflow rate, aging also affects the economy by affecting age-specific outcomes. Put differently, in economies with older workers and firms, unemployment and job destruction are lower for all workers. Using state-level variation and an instrumental variables approach, Crump, Eusepi, Giannoni and I showed that a 1 percentage point increase in mature firms’ share lowers the job destruction rate by 0.60 percentage points for younger firms.7
While grand gender convergence was important in accounting for the secular decline in the unemployment rate until 2000, dual aging stands out as an important driver of the decline since then.
Natural Rate of Unemployment
Grand gender convergence and dual aging together have reduced the overall incidence of unemployment, and consequently the secular trend of unemployment. Concurrently, inflation expectations became better anchored following the Volcker disinflation.8 Estimating the natural rate of unemployment requires recognizing these prominent changes in the macroeconomy.
Crump, Eusepi, Giannoni and I calculate this in our recent paper.9 We employ a forward-looking Phillips curve linking inflation to expected inflation and the unemployment gap (the difference between the actual and natural rates of unemployment). We utilize survey-based expectations of inflation at different horizons to provide noisy signals of true inflation expectations and impose that the secular trend of unemployment we derive from the flow dynamics acts as an anchor for the natural rate, while accommodating the possibility of persistent deviations.
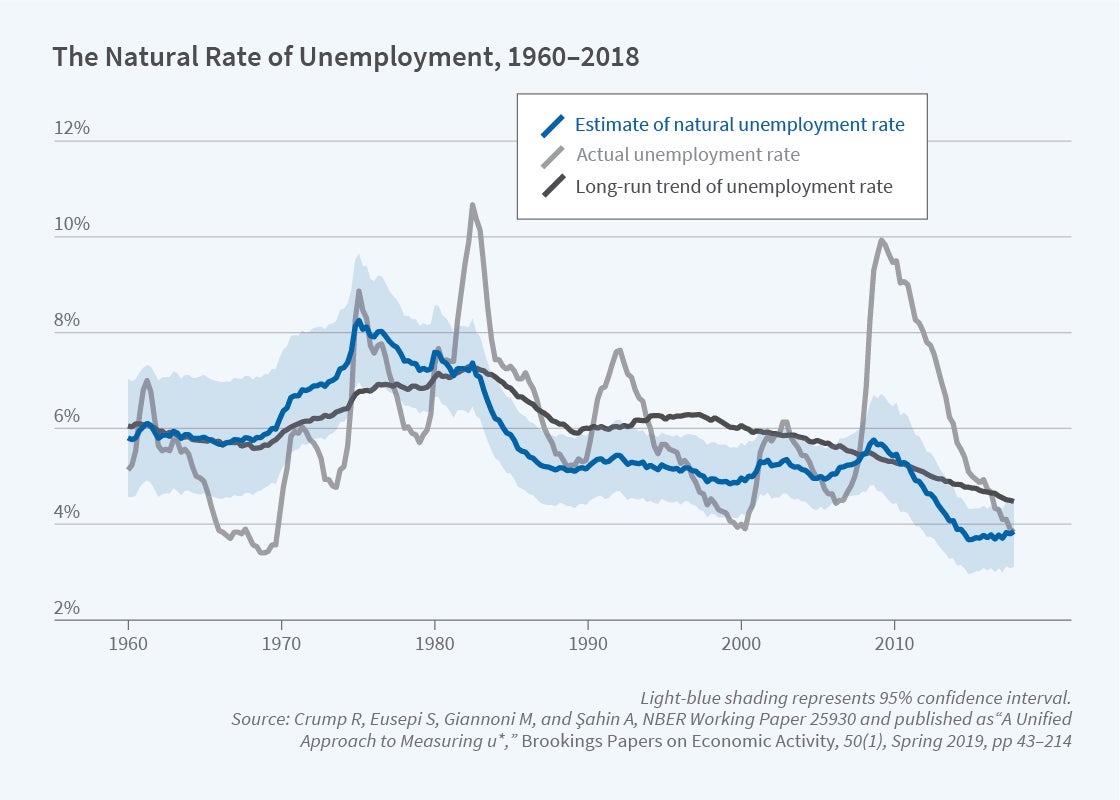
Figure 4 shows the evolution of u* since 1960. In the first decade of the sample, the natural rate hovers slightly below 6 percent and starts rising in the early 1970s, easily exceeding 7 percent by the late 1970s before falling to about 7 percent in 1983. The natural rate then declines throughout the 1980s falling consistently below the median of the secular trend of the unemployment rate (black solid line). The period from the 1990s to the Great Recession is characterized by a fairly stable natural rate of unemployment, which remains range-bound between 4.5 and 5.5 percent. Finally, during the prerecession years 2005–06, the natural rate of unemployment begins increasing toward its long-run trend. In the aftermath of the Great Recession, the natural rate of unemployment gradually declines roughly in line with its secular trend. The natural rate toward the end of 2018 was 3.8 percent, with a confidence interval between 3.4 and 4.5 percent, consistent with the unemployment gap being around zero before the pandemic.
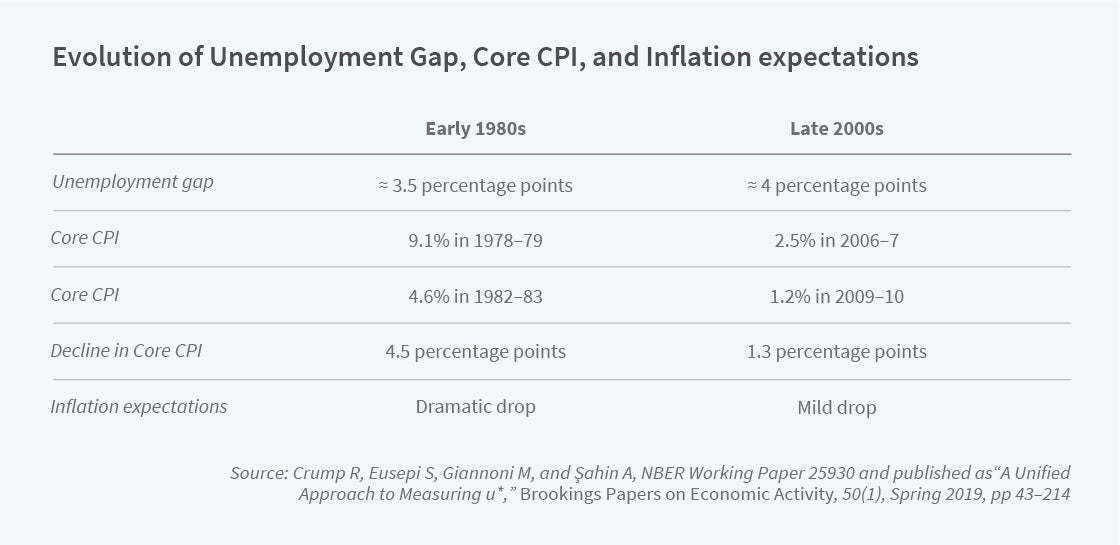
While some recent work argues for a change in the unemployment-inflation trade-off, our work emphasizes the role of inflation expectations. This is illustrated in Table 1, which compares the early 1980s with the late 2000s. In the early 1980s, we estimate an unemployment gap (the difference between the actual and the natural rate of unemployment) of 3.5 percentage points. During this time period, average core CPI inflation fell from 9.1 percent in 1978–79 to 4.6 percent in 1982–83. Following the Great Recession, which displays the largest unemployment gap in the sample, at around 4 percentage points, price inflation declined only modestly, from 2.5 percent in 2006–07 to 1.2 percent in 2009–10. The key determinant is the behavior of inflation expectations, which dropped much more sharply in the early 1980s than in the aftermath of the Great Recession. The comparison of the early 1980s with the Great Recession period demonstrates the importance of accounting for inflation expectations in explaining the behavior of inflation and the unemployment gap.
The longest labor market expansion in postwar US history came to an abrupt end with the emergence of the COVID-19 pandemic in March 2020. The unemployment rate jumped from its historically low level of 3.5 percent in February to 14.8 percent in April. This sharp increase was followed by a steep decline; the unemployment rate retreated to 6.9 percent by October. Murat Tasci, Jin Yan, and I show that this was due to the unprecedented rise in unemployment inflows, which was mostly driven by workers on temporary layoffs.10 Applying the methodology I developed with Crump, Eusepi, and Giannoni, we find that during the pandemic recession, increased from 3.8 percent to a range of 4.0 to 4.5 percent, suggesting that the unemployment gap as of May 2021 stood between 1.3 and 1.8 percentage points.
Endnotes
“Unemployment Dynamics in the OECD,” Elsby M, Hobijn B, Şahin A. NBER Working Paper 14617, December 2008, and Review of Economics and Statistics 95(2), 2013, pp. 530–548.
“A Unified Approach to Measuring u*,” Crump R, Eusepi S, Giannoni M, Şahin A. NBER Working Paper 25930, June 2019, and published in Brookings Papers on Economic Activity 50(1), Spring 2019, pp. 43–214.
“The Quiet Revolution That Transformed Women’s Employment, Education, and Family,” Goldin C. NBER Working Paper 11953, January 2006.
“The Gender Unemployment Gap,” Albanesi S, Şahin A. NBER Working Paper 23743, August 2017, and Review of Economic Dynamics 30, 2018, pp. 47–67.
“Grown-up Business Cycles,” Pugsley B, Şahin A. Review of Financial Studies 32(3), 2018, pp. 1102–1147.
“Demographic Origins of the Startup Deficit,” Karahan F, Pugsley B, Şahin A. NBER Working Paper 25874, May 2019.
“Anchored Inflation Expectations,” Carvalho C, Eusepi S, Moench E, Preston B. 2017, SSRN.
“Unemployment in the Time of COVID-19: A Flow-Based Approach to Real-Time Unemployment Projections,” Şahin A, Tasci M, Yan J. NBER Working Paper 28445, February 2021.


