The Global Capital Allocation Project
In recent decades, global flows of assets and goods have grown rapidly relative to GDP and have shifted aggressively during crises such as the global financial crisis and the current pandemic. Corporations and governments increasingly borrow from foreign investors, who face more options for allocating their capital in terms of asset class, currency, and geography. A sense of “who owns what” around the world, and why, is required to understand what these trends mean for the global economy. Our research aims to expand this understanding and explores the key elements driving global capital allocation.
Our work demonstrates the preference of investors for assets denominated in their own currency and details the consequences of this home currency bias for firm financing around the world. We find that the global demand for dollar-denominated assets implies that American firms have special access to global markets because they do not need to borrow in foreign currency to borrow from foreign investors. In recent work, we restate bilateral investment positions around the world by unwinding investments made in tax havens such as the Cayman Islands. This new map of capital allocation shows much larger bond investments by large developed countries in emerging economies such as Brazil, China, and Russia. The use of tax havens by large Chinese firms distorts our understanding of China as a global creditor. Finally, we organize the accompanying tools and data so that other users in academia and among policymakers can build on them.
Microdata in International Macro
In recent years, large-scale data collection by public institutions and commercial data providers has made it possible to go beyond aggregate statistics to reach a better understanding of how capital is allocated globally. Our work uses security-level holdings from mutual funds worldwide, US insurance companies, and the Norwegian sovereign wealth fund, together with various firm and security-level datasets on corporate ownership chains around the world, to better understand key patterns and determinants of global portfolio investment.
Cross-Border Financing and Tax Havens
In recent research with Antonio Coppola, we use these data to restate bilateral investment positions after taking into account the fact that companies often borrow from international investors through affiliates in tax havens and other financing centers.1 For example, official data show that the Cayman Islands account for 14 percent of all foreign stock and bond positions held by American investors, a staggeringly large share for a country with a GDP of only about $5 billion. These positions clearly reflect the fact that companies with operations in third countries often raise money from Americans using foreign financing affiliates. Researchers have been long aware of this problem, but a key contribution of our work is to provide a way to reallocate these positions and associate them with the country of the financing affiliate’s parent company rather than with the country of the shell company, as in official statistics.
Using microdata on investor holdings, we look security-by-security at the differences between the country where the immediate issuer is based and the country where the issuer’s parent company is located. We then apply the resulting patterns of reallocation that we find in our micro positions to the aggregate positions reported by the IMF or US Treasury. For example, we find that about 8 percent of European Monetary Union (EMU) investment positions in the Cayman Islands in bonds reflect issues from firms whose ultimate parents are based in Brazil, such as a Cayman Islands-based affiliate of Petrobras, the Brazilian energy giant. Our procedure, therefore, assumes that about 8 percent of all bond positions held by EMU investors in the Cayman Islands, as reported by official statistics, should instead be associated with Brazil.
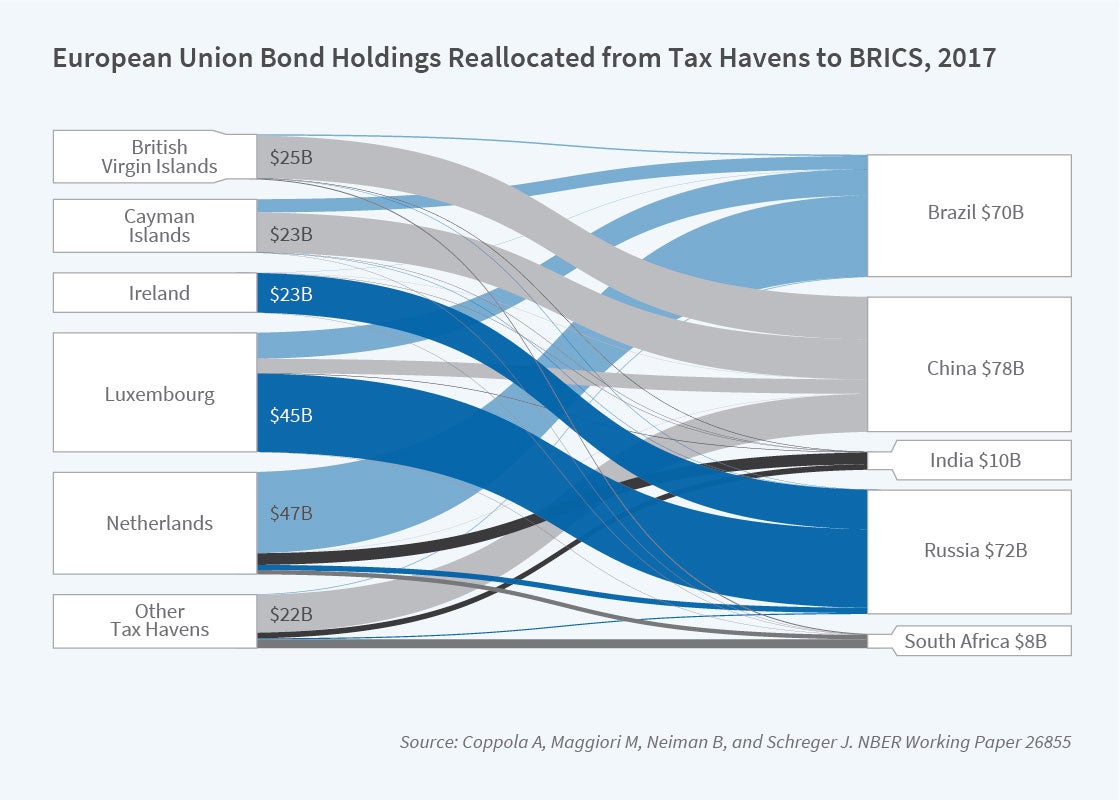
Applying this procedure, we find that developed country investors have significantly more bond positions in large emerging markets than are shown in the official data. Figure 1 shows, for example, how this procedure generates a reallocation of bond positions for the EMU from tax havens to Brazil, Russia, India, China, and South Africa. This pattern generally holds across all developed investor countries that we analyze.
We also find that developed countries have far larger equity investment positions in China than are shown in official data. Many large and prominent Chinese firms, such as Tencent and Alibaba, issue equity through affiliates listed in the Cayman Islands as part of a structure designed to circumvent Chinese inward investment restrictions. We show that over the last 15 years, China’s net foreign assets have undergone a substantial adjustment, leading China today to be only half as large a creditor as the official data report. This adjustment, due to valuation effects, had previously gone unnoticed, despite intense academic and policy interest, because of the complexity of the offshore corporate structures.
Home-Currency Bias and the International Role of the Dollar
In addition to shedding light on the geography of economic linkages, our work highlights factors that play a critical role in shaping investor portfolios. Figure 2 shows a dichotomy between the currency of corporate bonds purchased by domestic residents and foreign investors in each country. For all countries but the United States, domestic investors lend in the domestic currency but foreign investors do not. The United States is different in that both residents and foreigners finance US firms in dollars. Instead of lending in the borrower’s currency, investor portfolios are characterized by home-currency bias, the tendency to overweight bond securities denominated in the investor country’s home currency.2 Canadian investors, for example, hold a disproportionately large share of the Canadian dollar bonds issued by European companies. We demonstrate that, for bonds, a home-currency indicator has greater explanatory power for the pattern of global security holdings than a home-country indicator does.
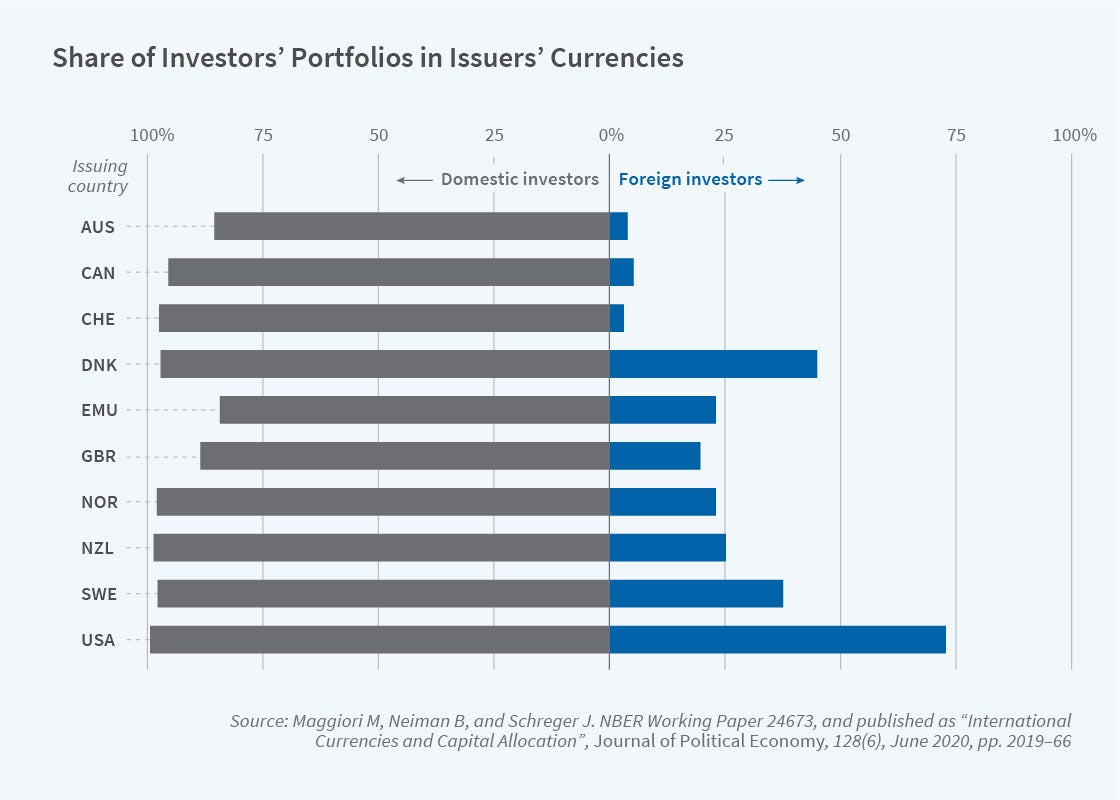
For the majority of companies that issue bonds only in their local currency, this means that they less commonly raise money from foreign investors than from domestic investors, and it conveys a financing advantage to the typically larger firms that issue bonds in multiple currencies. US companies are exceptional in this regard. While small firms in most countries that issue only local-currency bonds rarely place their bonds in foreign portfolios, the dollar bonds issued by US firms make up a large share of foreign investors’ portfolios. Our results suggest a novel benefit of issuing in an international currency like the US dollar: it opens up the capital account for small- and medium-sized firms that borrow by issuing local currency bonds.
Given that the United States was at the center of the global financial crisis of 2008 and the subsequent rhetoric and policies on US trade restrictions, one might wonder if the global role of the dollar declined since 2009. Figure 3 shows, instead, that the use of the dollar to denominate bonds held cross-border has increased significantly. Whereas before the crisis the dollar was used to denominate roughly 40 percent of cross-border corporate bond positions — where the issuer and borrower reside in different countries — that share rose to more than 60 percent by the end of 2017.
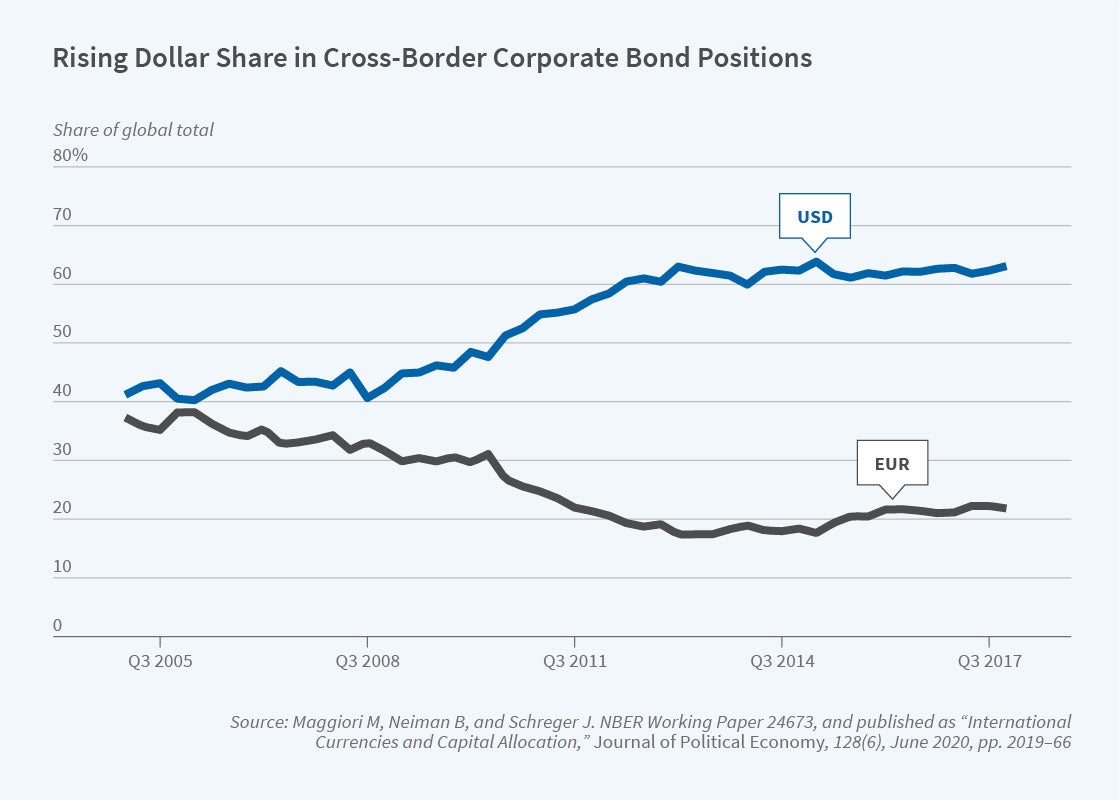
There has also been a decline during this period in the role of the euro in denominating corporate bonds held by foreign investors. In another study, we consider a number of different roles of international currencies, including their use invoicing trade, in global foreign exchange trading, as central bank reserves, and as an anchor or reference currency. In each of these dimensions, growth in use of the euro generally lags, and at best equals, that of the dollar.3
In addition to the rising use of the dollar as the international currency after the global financial crisis, changes emerged around that same time in the dynamics of the dollar’s value. In a recent study with Andrew Lilley, we show that whereas the contemporaneous correlation of the US dollar’s value and measures of global risk appetite such as the change in equity market returns and implied volatility was close to zero in monthly data spanning 1990–2007, the dollar’s value subsequently closely co-moved with these measures.4 In addition, in the period following the crisis, the dollar’s value closely co-moved with US purchases of foreign bonds, a rare example of a high-frequency connection between exchange rates and portfolio quantities.
Data on Global Portfolios
To further advance the study of global capital markets, our Global Capital Allocation Project website provides a number of tools as well as summary data that we hope will make it easier for other researchers to work on these issues. The growing scale and continuing shifts in cross-border financial linkages make it more important than ever to better document and understand the drivers of global capital allocation.
Endnotes
“Redrawing the Map of Global Capital Flows: The Role of Cross-Border Financing and Tax Havens,” Coppola A, Maggiori M, Neiman B, Schreger J. NBER Working Paper 26855, December 2020.
“International Currencies and Capital Allocation,” Maggiori M, Neiman B, Schreger J. NBER Working Paper 24673, April 2019, and Journal of Political Economy 128(6), June 2020, pp. 2019–2066.
“The Rise of the Dollar and Fall of the Euro as International Currencies,” Maggiori M, Neiman B, Schreger J. NBER Working Paper 25410, December 2018, and AEA Papers and Proceedings 109, May 2019, pp. 521–526.
“Exchange Rate Reconnect,” Lilley A, Maggiori M, Neiman B, Schreger J. NBER Working Paper 26046, December 2019, and Review of Economics and Statistics, 2021, forthcoming.


