Central Banks’ Ever-Expanding Tool Kit
In December 2008, at the height of the Great Recession, the Federal Reserve lowered the federal funds rate, the short-term interest rate that is one of its central policy tools, to zero. Around the same time, it began large-scale purchases of long-term Treasuries and mortgage-backed securities issued by the three federal agencies that participate in mortgage lending, a practice commonly known as quantitative easing (QE). It also began to use more explicit forms of forward guidance to affect expectations regarding the future federal funds rate, which is the policy rate for the United States. The Fed was not unique among the world’s major central banks in adopting programs like QE and explicit forms of forward guidance. Unlike several of the world’s leading monetary authorities, however, the Fed did not push the policy rate into negative territory.
At the time of their initial deployment, the Fed’s unconventional policy actions were seen as extraordinary measures to provide monetary stimulus in an emergency and were viewed as temporary. In actuality, the federal funds rate remained at zero for seven years. From the end of 2015 until early 2020 it was positive, and the Fed began to slowly reduce the holdings of assets that it had accumulated during its various asset purchases. The onset of the COVID-19 pandemic in March 2020 caused the Fed to reverse course. The federal funds rate has been at zero since March, and the Fed has increased its balance sheet by nearly $3 trillion via the resumption of QE programs.
Having lived at or near the zero lower bound (ZLB) on nominal interest rates for the better part of 12 years, heretofore unconventional policies like QE, forward guidance, and negative policy rates are now considered a regular part of central banks’ tool kits. Our research seeks to better understand the mechanisms through which these tools impact the macroeconomy, to quantify their effectiveness, to identify potential unintended consequences associated with their use, and to investigate their substitutability with conventional monetary policy as implemented via the adjustment of short-term policy rates.
Unconventional Policy Tools
In one paper, we build in a variety of real and nominal frictions, constrained financial intermediation, and long-term debt to one of the standard tools for analyzing how monetary policy affects macroeconomic outcomes — a medium-scale dynamic stochastic general equilibrium model — to compare QE, forward guidance, and a negative interest rate policy (NIRP) to conventional policy-rate changes.1 We find that in terms of macroeconomic outcomes, QE, forward guidance, and NIRP can each mimic the effects of a conventional rate cut, but the requisite forward guidance and NIRP interventions are large. We also find that the efficacy of forward guidance depends on a central bank’s credibility, and that there are a number of challenges to implementing deeply negative policy rates. QE appears to be the most effective tool for achieving central banks’ policy objectives.
The large balance sheets that central banks around the world amassed in the wake of the Great Recession have important implications for the efficacy of unconventional policy tools. We discuss exit strategies for unwinding large balance sheets, and show that private sector expectations of the exit strategy have important implications for the efficacy of QE programs at the ZLB. We also find that the effectiveness of negative interest rate policy depends on the size of the central bank’s balance sheet. A larger balance sheet makes NIRP less expansionary and could even result in it being contractionary; this is similar to the “reversal rate” highlighted in other work.2 This result suggests that central banks need to consider not only the design of unconventional policy tools, but also their sequencing. Negative rates were deployed well after central banks accumulated large balance sheets; our work suggests that the opposite ordering would have been more effective. Finally, our work shows that the size of a central bank’s balance sheet also has implications for how negative nominal interest rates can go, a parameter we label the effective lower bound.
QE versus Conventional Policy
To understand the substitutability of QE with conventional policy rate cuts, we conduct an experiment that mimics the Great Recession in the United States.3 Using our model, we expose the economy to a sequence of negative credit shocks that would result in the ZLB binding for 2½ years. Absent any unconventional intervention, the constraint that the federal funds rate cannot fall below the ZLB causes output to decline by 6 to 7 percentage points (or roughly 50 percent) more than it would if the ZLB were not binding. In Figure 1, we show that expanding the central bank’s balance sheet by about 25 percent of GDP can roughly re-create the path of output that would have prevailed were there no ZLB. This balance sheet expansion is the rough equivalent of pushing the policy rate to about -200 basis points.
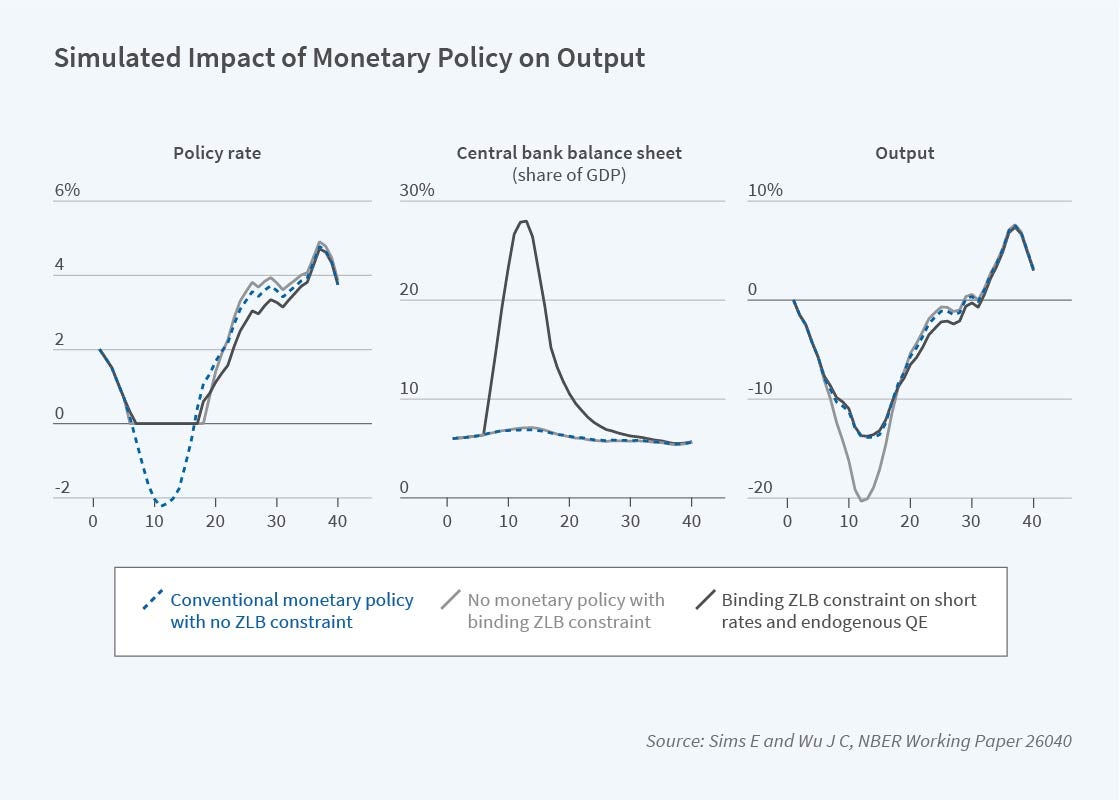
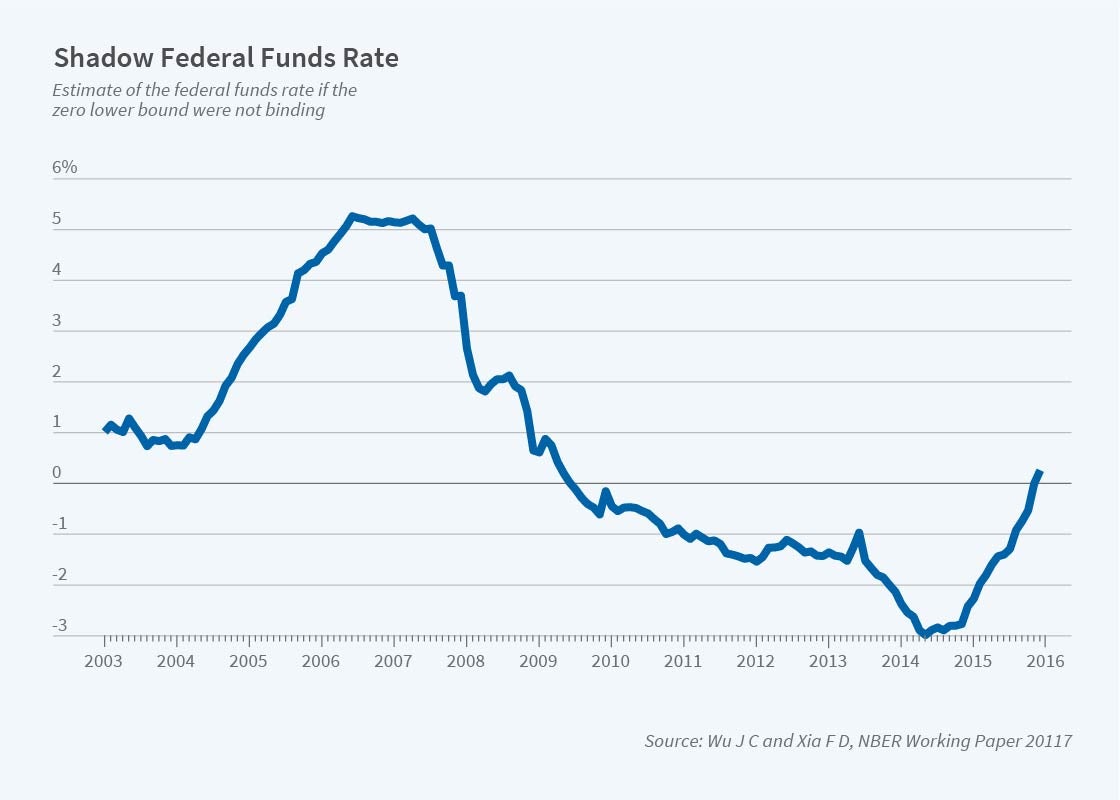
These simulation results from our model line up well with the experience in the United States. After the Fed completed its three major rounds of QE, its balance sheet had risen to about 25 percent of GDP. Wu and Xia estimate that the shadow federal funds rate — the rate that the policy rate would have been in the absence of the ZLB — was about -3 percentage points, which is roughly in line with our simulation. This shadow federal funds rate is plotted in Figure 2.4
A New Small Scale Macro Model for Monetary Policy
Our foregoing analysis was carried out within the confines of a medium-scale model with many shocks and frictions. While useful for quantitative analysis, such a framework lacks the elegance and tractability of small-scale models. In another paper, we develop a small-scale model to study QE that mimics as closely as possible another workhorse model, the three-equation New Keynesian model.5 We use this model to show, analytically, how QE can serve as a substitute for conventional policy rate movements when the ZLB binds. This result implies that the ZLB is not as costly as widely believed, and urges caution when considering dramatic policy proposals, such as raising the inflation target, designed to reduce the frequency of ZLB episodes. Contrary to conventional wisdom, we show that there is a case for using QE to counterbalance adverse credit market disturbances even when the economy is not at the ZLB.
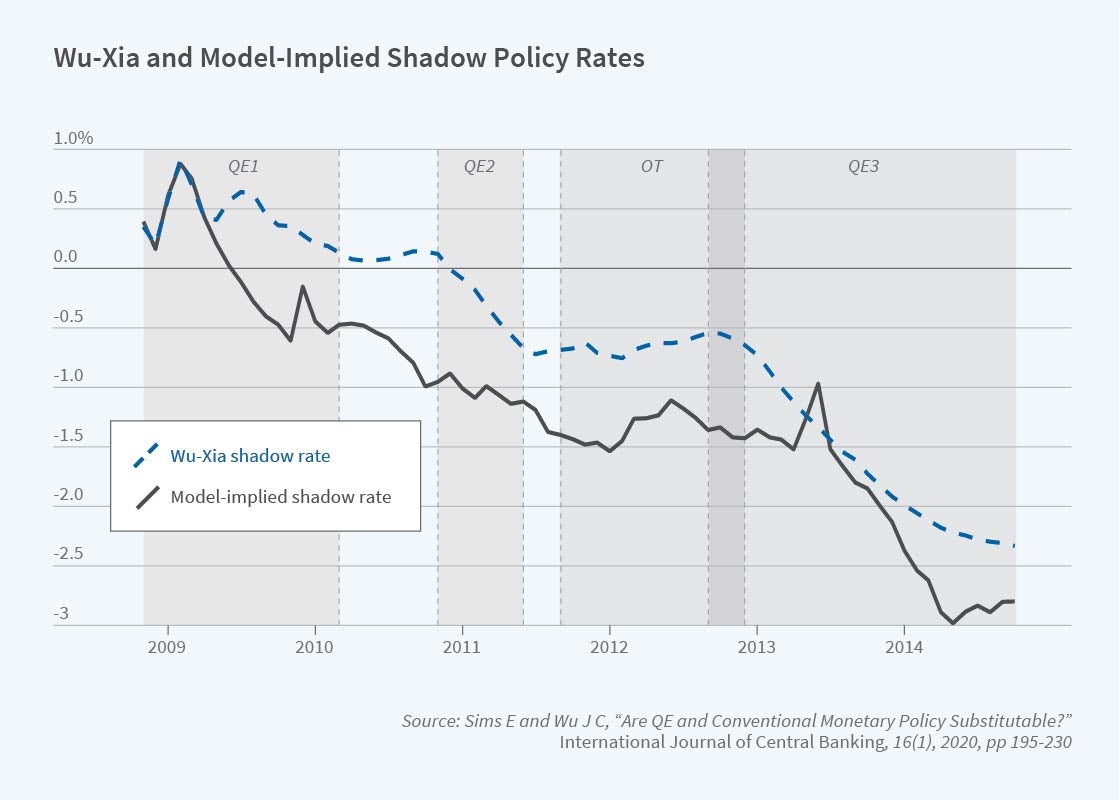
In a follow-up paper, we use our small-scale model to compare the time series evolution of the Fed’s QE programs and the observed Wu-Xia shadow federal funds rate series.6 Figure 3 shows the Wu-Xia shadow rate series (blue dashed line) along with the shadow rate implied by our model (black line), constructed using the actual evolution of the Fed’s balance sheet as an input. The two series track each other remarkably well.
What Happened to the Phillips Curve?
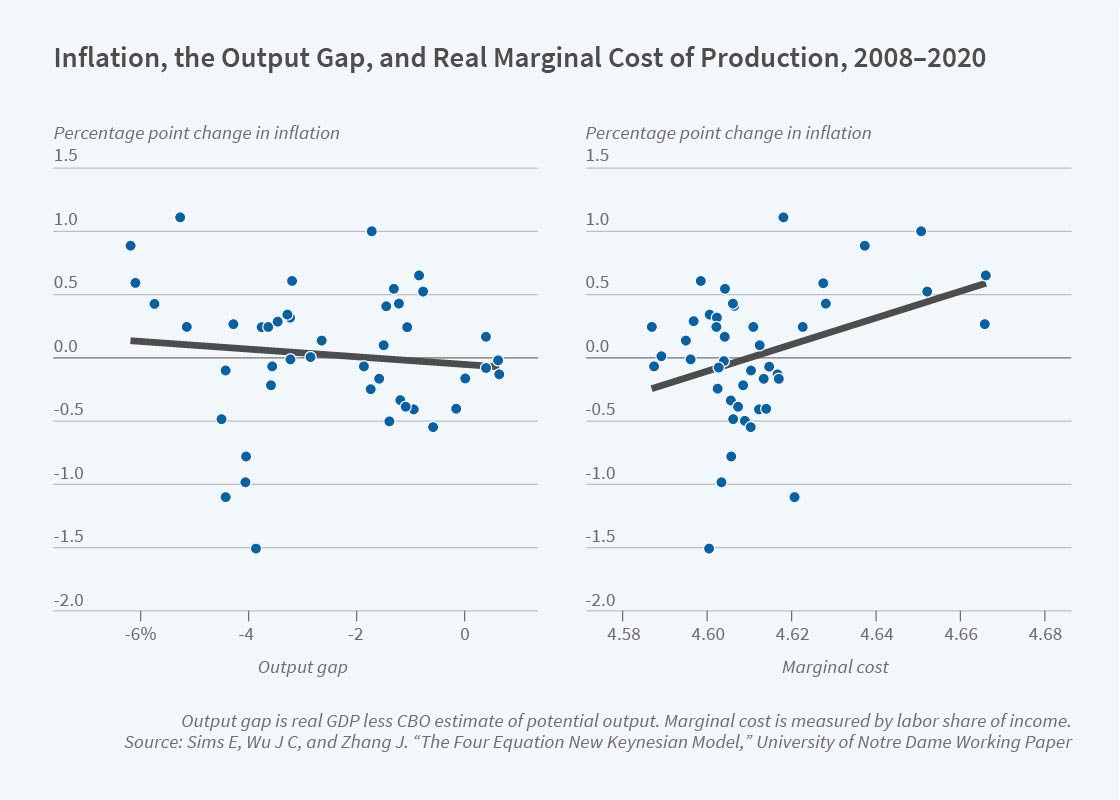
Many observers have been puzzled about the apparent breakdown of the relationship between real economic activity and inflation over the last decade-plus. A traditional Phillips curve posits that a robust economy ought to be associated with high and rising inflation and vice versa. Yet this is not what we have seen. During 2008–2010, when the economy was quite weak, inflation did not decline significantly. This has been dubbed “missing deflation.” Conversely, in 2015–19, when the US unemployment rate approached all-time lows, inflation did not accelerate. The apparent breakdown in the Phillips curve lies behind some recent changes to the Fed’s policy framework, in particular its new focus on shortfalls of employment from potential rather than on deviations relative to potential.7
The left panel of Figure 4 shows a simple scatterplot of the change in inflation and a measure of the output gap over the last decade. It displays the “wrong sign” for the standard Phillips curve theory: a positive output gap ought to put upward pressure on inflation. We use our model to analyze this apparently puzzling behavior of inflation8 and find that credit market disturbances are an important omitted factor that can confound the observed pattern of the output gap and inflation. Adverse credit market conditions put upward pressure on inflation and vice versa. This potentially helps to explain both the missing deflation of 2008–10, when credit market conditions were poor, and the missing inflation of 2015–2019, when credit market conditions were more favorable. In our small-scale model, there is a direct relationship between the marginal cost of producing additional output and inflation that is not confounded by credit market disturbances. When we replace the output gap with a measure of marginal cost, as in the right panel of Figure 4, there is no anomalous behavior in the scatter plot — high marginal cost correlates with high inflation and vice versa.
Emergency Monetary Policy Responses to COVID-19
During the COVID-19 pandemic, there has been a resurgence in the Fed’s use of large-scale asset purchases and other unconventional monetary policy tools. In addition to resuming its purchases of long-term Treasuries and mortgage-backed securities, in March 2020 the Fed announced its intention to purchase privately issued debt carrying credit risk, as well as to lend directly to nonfinancial firms. These actions mark a significant departure from past practice.
We study the Fed’s newest asset purchasing and lending in comparison to the QE programs it deployed to combat the Great Recession using a model that features constrained financial intermediaries and long-term debt.9 We diverge from our previous framework10 in modeling nonfinancial firms as being subjected to a cash flow constraint. This constraint limits the amount that firms can borrow as a function of their current cash flows. Such a constraint has empirical and theoretical support in the literature.11 It also seems particularly relevant for the COVID-19 environment, where mandated lockdowns and voluntary social distancing have reduced cash flows for many firms to an unparalleled degree.
When nonfinancial firms are not subject to a binding cash flow constraint, we find that direct lending to such firms has results similar to more conventional asset purchasing programs. But in a situation in which these firms are cash flow constrained, conventional QE programs become almost completely ineffective, whereas direct lending and outright purchases of assets of these constrained industries maintain their efficacy. In our model, conventional QE works by easing leverage constraints on intermediaries. This only transmits to the real economy if firms are not cash flow-constrained. When firms are constrained, as we think plausibly characterizes the COVID-19 recession, direct lending has much greater effects.
Endnotes
“Evaluating Central Banks’ Tool Kit: Past, Present, and Future,” Sims E, Wu JC. NBER Working Paper 26040, July 2019. Forthcoming in Journal of Monetary Economics.
“The Reversal Interest Rate,” Brunnermeier M, Koby Y. NBER Working Paper 25406, December 2018.
“Evaluating Central Banks’ Tool Kit: Past, Present, and Future,” Sims E, Wu JC. NBER Working Paper 26040, July 2019. Forthcoming in Journal of Monetary Economics.
“Measuring the Macroeconomic Impact of Monetary Policy at the Zero Lower Bound,” Wu, JC, Xia FD. NBER Working Paper 20117, May 2015, and Journal of Money, Credit, and Banking 48(2-3), March–April 2016, pp. 253–291.
“The Four Equation New Keynesian Model,” Sims E, Wu JC. NBER Working Paper 26067, July 2019.
“Are QE and Conventional Monetary Policy Substitutable?” Sims E, Wu JC. International Journal of Central Banking 16(1), February 2020, pp. 195-230.
“New Economic Challenges and the Fed’s Monetary Policy Review,” Powell J. Speech at Jackson Hole Symposium, Aug. 27, 2020.
“The Four Equation New Keynesian Model,” Sims E, Wu JC, Zhang J. University of Notre Dame Working Paper, July 2020.
“Wall Street vs. Main Street QE,” Sims E, Wu JC. NBER Working Paper 27295, June 2020.
“Evaluating Central Banks’ Tool Kit: Past, Present, and Future,” Sims E, Wu JC. NBER Working Paper 26040, July 2019. Forthcoming in Journal of Monetary Economics.
“Earnings-Based Borrowing Constraints and Macroeconomic Fluctuations,” Dreschsel T. University of Maryland Working Paper, October 2020.


