Black Officeholders and Spending on Public Goods
The United States has long had racially homogeneous political leadership. For example, 97 percent of all Republican elected officials and 79 percent of all Democratic elected officials are White.1 Would more Black, Hispanic, and Asian officials advance different policies in office, or would their policies be similar since those officials would represent the same communities?
Theoretically, the race of a politician may or may not matter. Under a classic median voter model, specific candidate demographics have no effect: policymakers reflect the preferences of the electorate.2 At the same time, a candidate’s race may affect the electorate by increasing or depressing turnout, leaving the median voter endogenous to the demographics of the candidates for office.3 In modern citizen-candidate models, however, politicians differ from the median voter’s preferred policy, and there would be a race effect to the degree that politicians of the same race have similar policy preferences.4
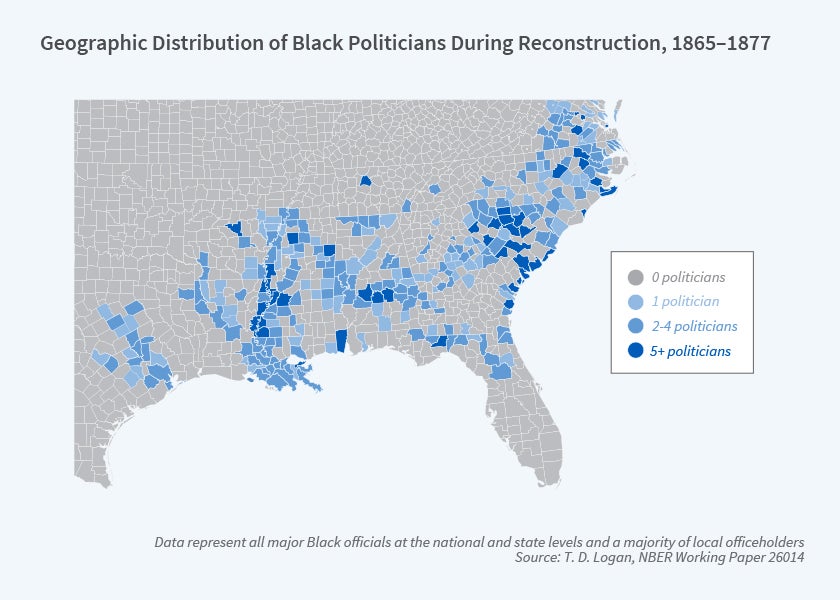
Racial segregation, the geographic concentration of Blacks in cities in regions outside of the South, endogenous incorporation and municipal boundaries, and political districting and redistricting make it difficult to disentangle contemporary candidate demographics from the communities they represent today. I have therefore turned to history, particularly the history of Reconstruction, to answer questions about the cause and effect of Black political representation.5 I ask three related questions about the role of race in political representation: Were Black politicians related to policy in a way that was unexplained by the demographics of the voting population? Is there any evidence that their policies were effective? And was that leadership related to the subsequent violence of the Jim Crow era?
Reconstruction offers a unique opportunity to answer these questions because the enfranchisement of Black men was both unexpected and universal. In fact, enfranchisement came to the formerly enslaved before the 15th Amendment of the Constitution in 1870 by way of the first Reconstruction Act in 1867. The Act required new state constitutions in the former Confederacy that allowed for manhood suffrage irrespective of race, color, or religion, and for the establishment of governments under those new constitutions. In many areas of the South, Black turnout for constitutional ratification and subsequent elections exceeded 90 percent.6 Along with the enfranchisement of one million Black men, the widespread election of Blacks in the South was a striking revolution in both American and global political history.
Building on the narrative work of historians of Reconstruction, I constructed a database that matched every Black official to his county of service during Reconstruction to quantitatively measure the impact of Black officeholding.7 Going further, I used the narrative approach pioneered in macroeconomic history to qualitatively identify the areas of policy agreement among Black elected officials that were at odds with those of Whites at the time.8 I found two areas of broad agreement: land policy and public schools. Black policymakers sought to use tax policy to induce the sale of unimproved land. The basic idea was not to use taxes on land to seize property for nonpayment of taxes, but rather to alter the opportunity costs of large landholding. Black officials were also strong supporters of public education, which was not widely provided in the South before the Civil War.
Tax Effects of Black Politicians
Since there was little use — or even scope — for municipal taxation at the time, I use county taxes per capita as the measure of the public finance effect of Black political leadership. Ordinary Least Squares (OLS) regression estimates imply that each additional Black politician was correlated with a $0.09 increase in per capita county tax revenue in 1870. Although this correlation is inherently interesting and the first evidence of tax effects of Black politicians at the time, the number of Black officials could be related to electoral preferences for redistribution. Black political leadership could have been more likely in areas which had more progressive attitudes toward racial relations and/or redistribution, which would overstate the relationship. On the other hand, if White resistance and preferences for low levels of redistribution were an increasing function of Black political success, the relationship between politicians and tax revenues could be understated.
To overcome this endogeneity, I use an instrumental variable for Black policymakers during Reconstruction: the number of free Blacks in 1860. A highly disproportionate number of Black officials were people who gained their freedom before the end of slavery. At the same time, both narrative and quantitative evidence shows that free Blacks in 1860 correlated well with Black officials. This correlation is free from potential errors in the estimating equation, such as preferences for redistribution. As examples, free Blacks were disenfranchised for more than 25 years before the Civil War began, and they are uncorrelated with any Reconstruction political outcomes such as party vote shares. The instrumental variable estimates are twice as large as the OLS estimates that do not correct for the endogeneity problem, suggesting that each additional Black politician increased per capita county revenue by more than $0.20 per capita. This is more than a laborer’s hourly wage at the time.
Is this a large effect? From the contemporaneous response, yes. For example, in 1874, Whites in South Carolina organized a Taxpayers’ Convention to protest high local taxes in Congressional Reconstruction. The commissioned report noted that taxes increased by $0.38 per capita, and were used to provide a range of public goods, such as schools and improved roads, which were not available in the antebellum era. The results suggest that each additional Black politician could explain roughly half of the increase in per capita taxes from the antebellum era to Reconstruction, an increase that was the focus of intense contemporaneous political protests.
Black Politicians and Policy
Given that Black politicians appear to have had a sizable effect on tax revenue, the open question is whether those revenue effects impacted the two areas of policy agreement among Black politicians. For land policy, I test whether higher taxes in 1870 led to more farms in the same county, which would be suggestive evidence of the breakup of existing farms. The results, however, show that higher taxes in 1870 led to fewer farms in 1880, exactly the opposite effect of the tax policies advocated by Black politicians. Recalling the potential effects of tax policy, higher taxes on property could have spurred landowners to put more land into production, and this could have altered the terms of labor negotiations for Black farmers. I find that taxes had a positive effect on the share of all rental farms that were tenant farms, with each additional dollar of per capita tax revenue increasing the share of tenant farming by 4 percent.
For education, county taxes were positively related to school enrollment for both Blacks and Whites. Estimates from historians suggest that one-fifth of local taxes were used to fund public education. Using the relationship between Black politicians and taxes and between taxes and school outcomes, I estimate that a one standard deviation increase in the number of Black politicians resulted in an additional 34 Black students enrolled in school and an additional 125 White students enrolled in school. The results also imply that the same change led to a decline in Black illiteracy: a one standard deviation increase in Black politicians reduced Black illiteracy at age 10 by more than 30 persons and illiteracy at age 15 by 15 persons. Interestingly, there is no similar effect of Black politicians on White illiteracy. As a further check, I use adult literacy after the end of Reconstruction, looking at the literacy of those 21 and above in 1900, who would have been of school age during the time of Black officeholding. The results show that a one standard deviation increase in Black politicians increased adult Black male literacy by 1.6 percent. Given that the baseline literacy rate of Black men above the age of 21 was 50 percent in 1900, this implies a more than 3 percent increase in Black male literacy.9
Things Fall Apart
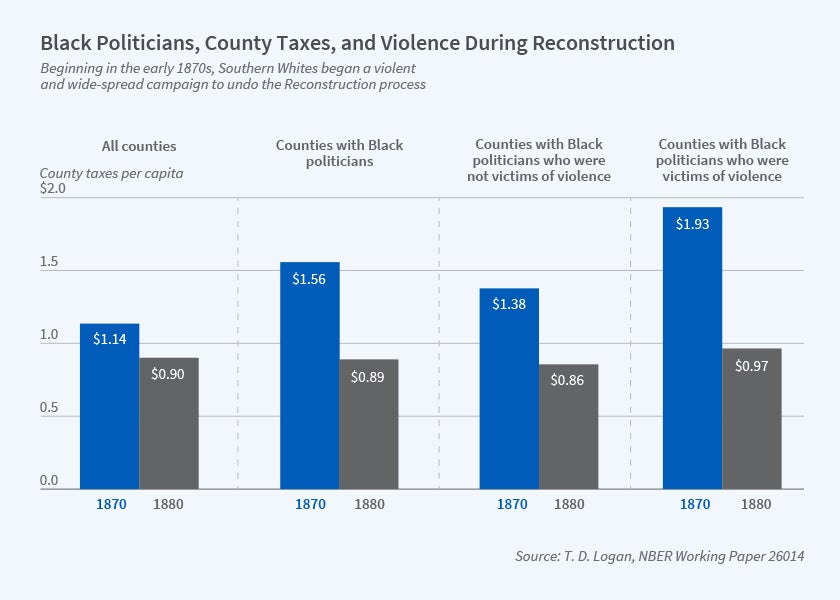
Beginning in the early 1870s, Southern Whites began a violent and widespread campaign to undo the Reconstruction process. After the 1872 election cycle, the relationship between violence and politics was revived and extended. One-third of all of the race riots in 1873 occurred the week before a local election. More than 10 percent of Black officials at the time were victims of violence. For example, George Barber fled his home in Fairfield County, South Carolina, over Ku Klux Klan death threats in 1871. Theophilus Steward of Georgia received death threats after he asserted that juries should involve both Black and White citizens. Charles Caldwell of Mississippi was murdered in 1875, months after he escaped an armed mob by fleeing to Jackson. Simon Coker of South Carolina was killed in 1876 by White Democrats in the Ellenton riot; he was kneeling in prayer after being captured.
While a complete accounting is impossible, congressional testimony and local accounts in newspapers speak to the profound regularity of racial violence in the South during this time, a significant portion of which was politically motivated. Black voter turnout declined more than 20 percent between the late 1860s and the 1880s.10 Although Blacks sought protection from this political violence and voter intimidation, and prosecution of the perpetrators, they found little will to defend their rights. By the last decade of the 19th century, funding for schools open to Blacks was reduced substantially, taxes were significantly lowered, and the range of public goods offered in the South again stood in stark contrast to the rest of the nation.
Given the extensive violence of the time, I focus on the violence visited upon Black politicians in the Reconstruction era to see if it was related to the public finance policies in their local communities. More specifically, what was the role of taxation in the likelihood of attacks on Black politicians? I use the narrative history of political attacks against Black politicians to test this relationship. Overall, the likelihood of a violent attack increased by more than 25 percent for each additional dollar in per capita tax revenue collected in 1870. Even when restricting the analysis to counties with Black representation, larger tax revenues were strongly correlated with an increased likelihood of a violent attack against Black policymakers. All of this meant an end to the tax policies of Black political leaders. The removal of Black politicians at the end of Reconstruction more than reversed the differences in taxes levied due to Black politicians in 1870. Tax revenue per capita for counties without a Black politician went from $0.96 in 1870 to $0.98 in 1880, while for counties with Black politicians, revenue went from $1.56 in 1870 to $0.89 in 1880, on average. Further, I find that the violence against Black politicians was precise. These attacks were unrelated to other acts of racial violence, such as lynching, which acted as a means of voter suppression.11
Conclusions
Analysis of the beginning and end of Black political leadership in the 19th century provides a cautionary tale about the stability of democracy after expansions of the franchise. While Black politicians were effective in advancing some of their policies, they were undone by violence and legislative maneuvers.12 Once Blacks were intimidated from voting, the legislature was captive to White supremacists who promulgated racially hostile policies. Most Southern states moved to block Blacks from voting and subsequently enacted a White supremacist agenda with new state constitutions, poll taxes, grandfather clauses, and other restrictive measures. It would take more than 50 years to begin dismantling these policies, and the violence left a lingering negative effect on Black political participation.13 The end of those racial voting restrictions also improved outcomes for Black citizens.14 Overall, these findings suggest there is a measurable effect of Black political leadership on the level and composition of public spending.
Endnotes
“Reflective Democracy Research Findings, Summary Report,” Reflective Democracy Campaign, October 2017.
“An Economic Theory of Political Action in a Democracy,” Downs A. Journal of Political Economy 65(2), 1957, pp. 135–150.
“Electoral Acceleration: The Effect of Minority Population on Minority Voter Turnout,” Oberholzer-Gee F, Waldfogel J. NBER Working Paper 8252, April 2001. Published as “Strength in Numbers: Group Size and Political Mobilization,” Journal of Law & Economics 48(1), April 2005, pp. 73–91. “How Black Candidates Affect Voter Turnout,” Washington E. NBER Working Paper 11915, January 2006, and Quarterly Journal of Economics 121(3), August 2006, pp. 973–998. “Race and the Politics of Close Elections,” Vogl T. NBER Working Paper 18320, August 2012, and Journal of Public Economics 109, January 2014, pp. 101–113.
“Credibility and Policy Convergence in a Two-Party System with Rational Voters,” Alesina A. American Economic Review 78(4), September 1988, pp. 796–805.
“Do Black Politicians Matter?” Logan T. NBER Working Paper 24190, January 2018. Published as “Do Black Politicians Matter? Evidence from Reconstruction,” Journal of Economic History 80(1), March 2020, pp. 1–37. “Whitelashing: Black Politicians, Taxes, and Violence,” Logan T. NBER Working Paper 26014, June 2019.
“Does Monetary Policy Matter? A New Test in the Spirit of Friedman and Schwartz,” Romer C, Romer D. NBER Working Paper 2966, May 1989, and NBER Macroeconomics Annual 1989, Vol. 4, Blanchard O, Fischer S, eds.
“Accounting for Racial Differences in School Attendance in the American South, 1900: The Role of Separate-But-Equal,” Margo R. NBER Working Paper 2242, May 1987, and Review of Economics and Statistics 69(4), November 1987, pp. 661–666. “Historical Perspectives on Racial Differences in Schooling in the United States,” Collins W, Margo R. NBER Working Paper 9770, June 2003, and Handbook of the Economics of Education, Vol. 1, Elsevier, 2006.
The Wars of Reconstruction: The Brief, Violent History of America’s Most Progressive Era, Egerton D. New York: Bloomsbury Press, 2014.
“Racial Segregation and Southern Lynching,” Cook L, Logan T, Parman J. NBER Working Paper 23813, September 2017, and Social Science History 42(4), Winter 2018, pp. 635–675.
“A Poll Tax by Any Other Name: The Political Economy of Disenfranchisement,” Jones D, Troesken W, Walsh R. NBER Working Paper 18612, December 2012.
“Historical Lynchings and Contemporary Voting Behavior of Blacks,” Williams J. Forthcoming in American Economic Journal: Applied Economics.
“Valuing the Vote: The Redistribution of Voting Rights and State Funds Following the Voting Rights Act of 1965,” Cascio E, Washington E. NBER Working Paper 17776, January 2012, and Quarterly Journal of Economics 129(1), February 2014, pp. 379–433. “The Franchise, Policing, and Race: Evidence from Arrests Data and the Voting Rights Act,” Facchini G, Knight B, Testa C. NBER Working Paper 27463, July 2020.


