The Return of Survey Expectations
The use of survey expectations data was a key feature of macroeconomics in the 1950s and 1960s, and an important part of research at the NBER during that period. Yet this work slowly ground to a halt in the aftermath of the rational expectations revolution. Under rational expectations, economic agents forecast the future by optimally using the true structure of the economy they operate in. This means that the structure of the economy itself dictates what beliefs they should hold. From the viewpoint of economic research, this implies that expectations data are redundant as long as the econometrician knows the model that economic agents rely on and can compute their statistically optimal expectations of future variables from that model. In financial economics as well as in macroeconomics, the rise of the efficient markets hypothesis rendered expectations data largely irrelevant for addressing key questions.
Although the last 30 to 40 years have seen occasional studies using survey expectations data, this line of work has picked up pace significantly in the last several years. Part of the reason is that we now have much better data, and that survey expectations are actually quite useful in distinguishing alternative models, but part is undoubtedly the fact that rational expectations models in both macroeconomics and finance have increasingly reached dead ends. As a result, survey expectations are staging a remarkable comeback.
Rapidly growing evidence shows that, far from being random noise, measured expectations are highly consistent across surveys that are conducted with different methodologies and using somewhat different questions. Furthermore, actual behavior of survey respondents is predicted more successfully by their survey responses than by some model-based predictors from a rational expectations model. People literally put their money where their mouth is — not where it ought to be in rational expectations models. Last but not least, the evidence shows that forecast errors can be predicted from the information that the decision maker has at the time of making the forecast. This is inconsistent with the rational expectations hypothesis, and points to more realistic economic models of expectation formation and actual behavior. In this summary, I review some of my research that contributes to these findings, conducted jointly with Pedro Bordalo, Nicola Gennaioli, Robin Greenwood, Rafael La Porta, and Yueran Ma. Many other researchers have generated closely related results.
Expectations of Aggregate Stock Returns
Perhaps because the movements of the stock market engage so many people, from individual investors to managers to professional forecasters, there are multiple sources of data on expectations of aggregate stock market returns. Robin Greenwood and I put together data on such expectations, some quantitative and some qualitative, from six sources, with very diverse surveyed populations and different survey questions.1
The first source is the Gallup survey of individual investors, with data from 1996 to 2012. For most of this period, this survey asked respondents about their beliefs about stock market returns over the next year, with possible answers ranging from "very optimistic" to "optimistic" to "neutral" to "pessimistic" to "very pessimistic." One can construct a qualitative indicator of return expected by Gallup respondents as the difference between the percentages of bullish and bearish investors. Between 1998 and 2003, the survey also asked for quantitative estimates of expected stock market returns. Because during this overlap period the movements in the qualitative bullishness indicator and the quantitative expectations of returns are highly correlated, the overlap allows us to map the qualitative indicators into quantitative measures of expected return over the entire period since 1996.
The second source is the survey of Chief Financial Officers of large U.S. companies, conducted since 1998 by John Graham and Campbell Harvey at Duke University. Here respondents provide quantitative estimates of the expected stock market return over the next year. The other four sources are a member survey of investor sentiment conducted by the American Association of Individual Investors; a sentiment measure constructed by the editors of Investors Intelligence newsletter going back to 1963, summarizing the investment outlook of more than 120 independent financial market newsletters; Robert Shiller's survey of individual investor confidence in the stock market; and the University of Michigan Surveys of Consumers, which date to 1946.
Greenwood and I put these six data sources into comparable units and use average responses in each survey every month. We thus have a monthly time series of expectations of returns on the stock market from six sources. We find that, at any given point in time, different financial market participants, ranging from individuals to CFOs, have highly correlated expectations or sentiment about future returns. Despite the considerable heterogeneity of data collection procedures across these surveys, this evidence decisively rejects the hypothesis that survey expectations are merely noise. Indeed, we also find that investor expectations are highly correlated with the flow of money into equity mutual funds. When investors are optimistic about expected stock returns, they put money into equity mutual funds. This evidence shows that investors act on their beliefs. Survey expectations can be used to predict economically relevant choices.
If these expectations are highly correlated across data sources and investor types, then what do they reflect? Figure 1 plots, on the same graph, Gallup expectations of the next 12-month return and the past 12-month return on the S&P 500. The two series practically lie on top of each other. Gallup investors, as well as participants in other surveys, expect high future returns precisely when the last year's stock market return has been high. They appear to extrapolate past returns into the future.
Is such extrapolation an effective return forecasting strategy? The answer is no. The correlation between the Gallup expected return and the S&P return for the next — as opposed to the past — 12 months is negative, though statistically insignificant. At the same time, high past returns predict expectation errors. When past returns are high, expected future returns are on average higher than realizations. A quick summary of what the data say is that when stock market returns have been high, investors expect high returns to continue, but in reality the returns are, if anything, on average low.
Greenwood and I also find that expected returns dictated by standard rational expectations asset pricing models are strongly and statistically significantly negatively correlated with survey expectations of returns. According to efficient markets models, stock prices are high when investors are willing to accept low returns going forward because their wealth or consumption is high today. With extrapolation, in contrast, stock prices are high precisely because, by extrapolating past returns, investors incorrectly expect future prices to become even higher, bidding up current prices. This evidence explains, in the clearest way, how the rational expectations models get it wrong. The models need investors to expect low returns in good times, the opposite of what they say they expect.
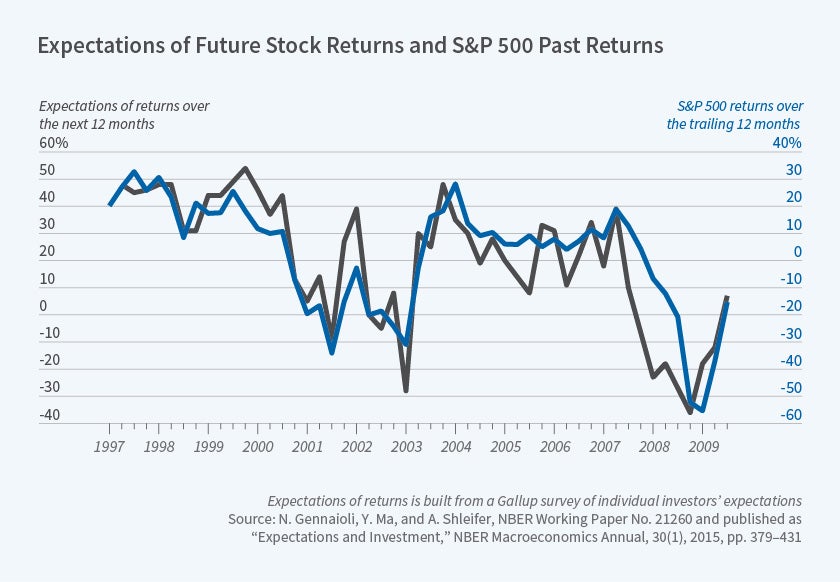
Figure 1
Expectations in a Cross-Section of Stock Returns
In 1996, La Porta published an intriguing finding.2 He compared companies with the most optimistic and most pessimistic long-term earnings growth forecasts made by financial analysts. He found that stocks with the most optimistic analysts earn sharply lower returns than those with the most pessimistic ones. It is not just that when analysts are extremely optimistic, realized long-term earnings growth proves to be slower than analysts expect. Their optimism also infects prices, perhaps because they influence investors or perhaps because investors hold similar beliefs. This leads to overvaluation and to low subsequent returns on the stocks whose growth prospects the analysts find most favorable.
Bordalo, Gennaioli, La Porta, and I revisited La Porta's finding with 20 additional years of data and took a much closer look at how expectations are formed, how they are revised, and how earnings, beliefs, and prices co-evolve.3 La Porta's initial finding still holds: A portfolio of high long-term growth (HLTG) stocks (those with the top 10 percent most optimistic earnings-growth forecasts) returns 3 percent on average in the year after formation during the 1981–2015 sample period. In contrast, a portfolio of low long-term growth (LLTG) stocks — those with the bottom 10 percent most pessimistic earnings-growth forecasts — returns 15 percent on average in the year after formation. The latter stocks are a much better investment, on average.
Why are HLTG stocks such a bad investment? First, as Figure 2 shows, analyst expectations of long-term earnings growth are at their peak at the time of portfolio formation for HLTG firms. These expectations have been rising, along with earnings, for several years prior to portfolio formation and decline in the years immediately following. Analysts learn that they are too optimistic about HLTG firms and revise their beliefs accordingly. The opposite pattern holds for LLTG firms: Analysts revise their views of these firms down prior to portfolio formation, but subsequently recognize that long-term earnings growth will not be as bad as they anticipated and correct their beliefs upward. Portfolio returns follow forecast revisions: As analysts curb their earlier enthusiasm, returns are poor; as they cheer up, returns are high.
We find similar trends in the earnings data: HLTG firms experience positive earnings surprises on the way up, yet disappoint looking forward from the peak. LLTG firms disappoint on their way down, but turn out not to be as bad as expected looking forward from the bottom. To put this differently, analysts extrapolate past performance and become excessively optimistic about HLTG firms and excessively pessimistic about LLTG firms. And critically, these extreme beliefs are reflected in valuations as well, leading to sharp differences in returns as analysts and others correct their mistaken extreme beliefs.
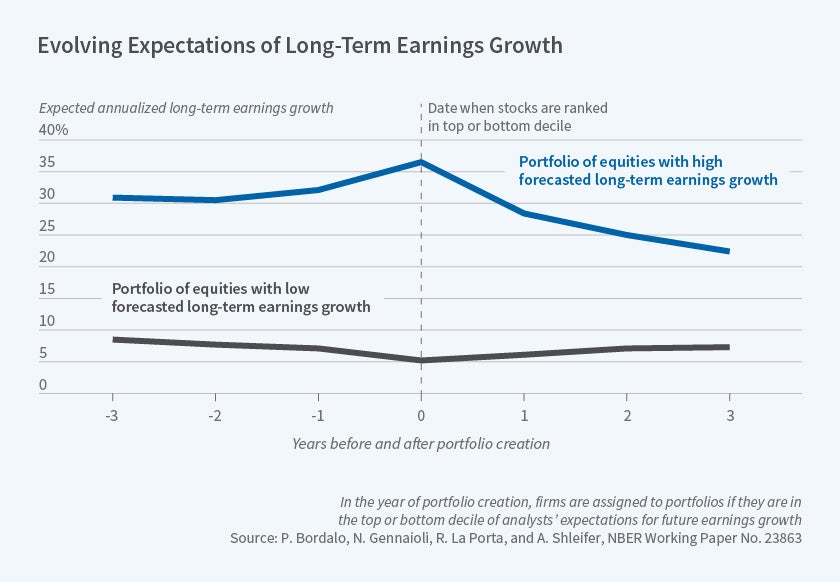
Figure 2
This evidence raises a deeper question about how analysts form beliefs in the first place. Do they mechanically extrapolate past earnings growth trends, or is there more to their belief formation? Our work suggests that belief formation is not mechanical, but takes a particular form of sophisticated yet not entirely rational learning. We find that among HLTG firms, there are in fact some whose earnings continue to grow spectacularly — they are the future Googles. It is just that most HLTG firms do not turn out to be Googles, but slow down instead. Analysts form average expectations for HLTG firms as if there are more future Googles among them than in reality there are.
Figure 3 illustrates this finding. It shows the distribution of long-term earnings growth rates from HLTG firms (solid curve) and other firms (dashed curve). HLTG firms have a fat right tail of performance outcomes relative to all firms. There are indeed more Googles among them, but not nearly as many as analysts think. Analysts use information about past performance but overreact by predicting too many high performers.
So we see that, in the cross-section of stocks, there are some very similar phenomena to those we saw in the aggregate. Good performance leads to predictions of good performance in the future, and the opposite for bad performance. Forecasters extrapolate, but not mechanically. They use some forward-looking logic. Analysts understand correctly that extremely high earnings growth portends extremely high continued growth for some firms; there is indeed information in high past earnings growth for future earnings growth. Among the HLTG firms, there actually are some remarkable performers going forward, many more than among LLTG firms. Unfortunately, such performers tend to be relatively few, and the forecasts become overly optimistic by expecting too many of them. Analysts react excessively to the good news of high earnings growth. Extrapolation is caused by overreaction to information.
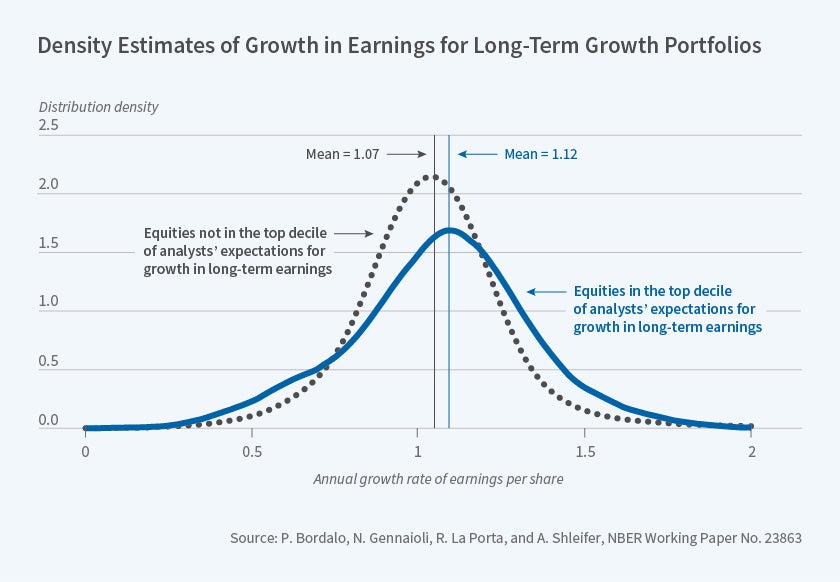
Figure 3
Expectations and Investment
Do survey expectations shape corporate decisions as well? Gennaioli, Ma, and I have explored this question for corporate investment.4 We use the Duke CFO Global Business Outlook survey of large U.S. companies already mentioned as a source of data on expected stock returns. These CFOs also report their expectations of earnings growth and investment plans for their own companies.
Figure 4 shows CFO earnings growth expectations and investment plans for the next year, aggregated over the firms in the Duke sample. It shows that the two follow each other closely. The collapse of earnings growth expectations following the Lehman bankruptcy, for example, is accompanied by the collapse of investment plans. The two recover together in 2009–10 as well. Actual investment is very close to investment plans, so CFO beliefs go hand in hand with economic activity. The study also shows that CFO earnings growth expectations are a much stronger predictor of investment plans (as well as realizations) than Tobin's q, the ratio of a company's market value to the replacement cost of its capital stock, which is the preferred indicator of investment opportunities in a standard rational expectations investment framework.
But are CFO expectations rational? It appears that they are not. Rather, the evidence shows that CFOs are excessively optimistic about their firms' earnings growth when past profitability has been high, and conversely when it has been low. The predictability of forecast errors is inconsistent with the rational expectations hypothesis, and the evidence again points to extrapolation: The CFOs expect the profitability of their firms to be more persistent than it turns out to be, on average.
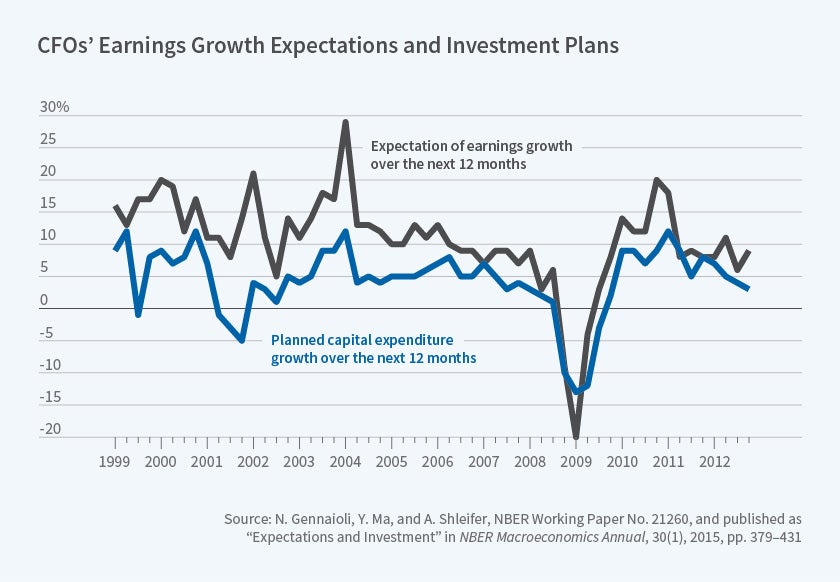
Figure 4
In sum, recent research points to many new opportunities presented by survey expectations data. These include tests of rationality of expectations, but more importantly suggest avenues for constructing new models in macroeconomics and finance. These models could seek to fit not just data on quantities and prices, but also data on the beliefs of households and firms. Research on these issues could represent a return to issues that engaged many NBER researchers in the past, this time with better data, evidence, and theory.
Endnotes
R. Greenwood and A. Shleifer, "Expectations of Returns and Expected Returns," NBER Working Paper No. 18686, January 2013, and The Review of Financial Studies, 27(3), 2014, pp. 714–46.
R. La Porta, "Expectations and the Cross-Section of Stock Returns," The Journal of Finance, 51(5), 1996, pp. 1715–42.
P. Bordalo, N. Gennaioli, R. La Porta, and A. Shleifer, "Diagnostic Expectations and Stock Returns," NBER Working Paper No. 23863, September 2017, and forthcoming in The Journal of Finance.
N. Gennaioli, Y. Ma, and A. Shleifer, "Expectations and Investment," NBER Working Paper No. 21260, June 2015, and the NBER Macroeconomics Annual 2015, 30(1), 2015, pp. 379–431


