Consumption and Income Inequality since the 1960s
Concerns about rising inequality inform important debates on some of our most significant issues, including income tax design, immigration, and globalization. The debate over inequality relies almost exclusively on income data that indicate that inequality has increased sharply in recent decades. Yet economists generally prefer using consumption rather than income to measure well-being.1 For this reason, and because consumption is better reported than income for some segments of the population, I have reexamined inequality patterns using consumption data. In several papers, mostly with James Sullivan of the University of Notre Dame, I find that income data paint an incomplete and at times distorted view of how inequality in economic well-being has changed in the United States. Because public and private transfers, and in some cases the drawdown of prior saving, raise consumption relative to income for the lowest income groups, consumption patterns indicate a much more modest increase in inequality than the income data suggest.
Why Consumption?
Although income is the most commonly used measure of the economic well-being of U.S. households, there are a number of reasons why measuring how much people spend on food, shelter, transportation, and other goods and services provides a more accurate picture of their circumstances. Income typically fluctuates more than economic well-being, because people can save when income is temporarily high and borrow when it is temporarily low. Income also fails to reflect the flow of services received if one already owns a house or a car, and has no expenditures but significant consumption. A retired couple in their own home living off the savings accumulated over a lifetime may be living quite comfortably even if they have no income.
Consumption measures will reflect the loss of housing-services flows if homeownership falls, the loss in wealth if asset values fall, and the belt-tightening that a growing debt burden might require — all of which an income measure would miss. Furthermore, consumption is more likely than income to be affected by access to public insurance programs, and to capture the effects of changes in access to credit or the government safety net.
Consumption is better than income at reflecting deprivation. In a series of papers, Sullivan and I show that measures of material hardship or adverse family outcomes are more severe for those with low consumption than for those with low income.2
Several researchers have documented the patterns in consumption inequality. The evidence from this literature is mixed. Some studies show little change in consumption inequality over the past few decades and others show a proportional rise equal to or exceeding that of income.3 These differences arise from the use of different data sources or definitions of consumption — for example, total consumption or nondurable consumption — and different methods of addressing measurement error.
Addressing Concerns about Data Quality
While consumption has a number of conceptual advantages relative to income as a measure of well-being, previous studies have raised concerns about the quality of both income and consumption data. There is considerable evidence that income is substantially underreported in national surveys, especially in categories of income important for those with few resources, and that the extent of underreporting has increased over time.4 For example, only about half of all dollars transferred through the Temporary Assistance for Needy Families (TANF) program, food stamps (the Supplemental Nutrition Assistance Program, SNAP), and pensions have been captured in the principal income surveys in recent years.
At least some components of consumption are also underreported in surveys. However, recent research has shown that among the eight largest categories of expenditures, six are reported at a high rate in the Consumer Expenditure Interview Survey, the best source of data on household spending, and that rate has been roughly constant over time.5 These comparisons also indicate that spending collected through a recall survey compares more favorably to national aggregates than does spending collected via a diary survey that appears too burdensome to complete accurately.
One way to address concerns about the quality of consumption data is to focus on components of consumption that are well-measured, including food at home, rent plus utilities, gasoline and motor oil, the rental value of owner-occupied housing, and the rental value of owned vehicles. In order to draw conclusions about changes in consumption inequality from evidence on the well-measured components, it is critical that these components be equally important for high- and low-consumption households. It is also important that price changes for well-measured consumption mirror the price changes for overall spending. Both of these conditions appear to hold: Well-measured consumption is roughly a constant share of overall consumption throughout the distribution, and the price of the bundle of well-measured goods has not changed noticeably relative to the prices for all goods.6
Trends in Income and Consumption Inequality
Official measures of income inequality suggest a steady rise in the U.S. since the early 1970s.7 An important limitation of the official statistics is that they are based on pre-tax money income, which does not account for tax credits and in-kind transfers, such as housing benefits and food stamps, which have increased sharply over time. Income inequality still rises for measures of income that more closely reflect family resources available for consumption, but the rise is less noticeable.8 Using our improved measure of consumption, however, a very different story emerges.
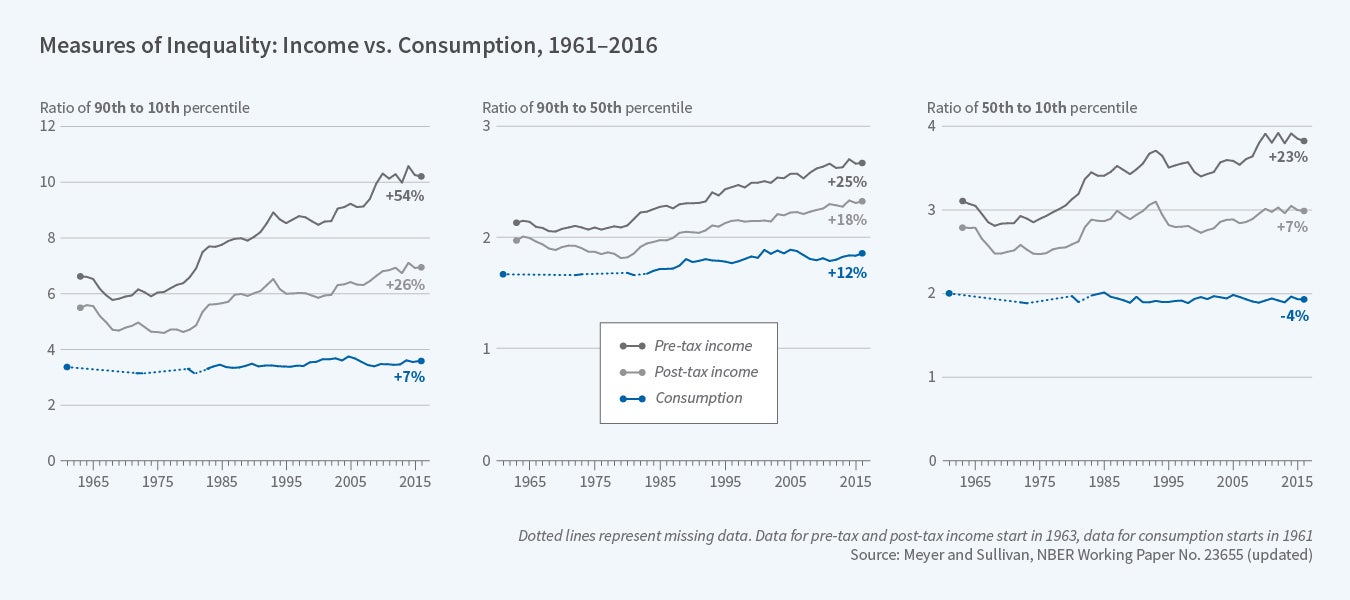
These differences are evident in Figure 1, where we report the ratio of the 90th percentile to the 10th percentile (the 90/10 ratio) for pre-tax money income, after-tax money income, and well-measured consumption.9 Since the early 1960s, the rise in after-tax income inequality as measured by the 90/10 ratio (26 percent) has significantly exceeded the rise in consumption inequality (7 percent). Furthermore, this much smaller percentage increase in consumption inequality started from a considerably lower base. In some decades, such as the 1960s and 1990s, income and consumption inequality moved in parallel, but in other decades the differences were sharp. In the 1980s, inequality for both measures rose, but the increase was much greater for income (28 percent) than for consumption (5 percent). After 2005, these measures moved in opposite directions: income inequality rose sharply while consumption inequality fell.
The center and right panels of Figure 1 show that income inequality has risen for the top (90/50 ratios) and bottom (50/10 ratios) of the distribution, but increases in consumption inequality are only evident for the top. The finding that the patterns of consumption and income inequality at the top are fairly similar from the early 1960s through 2005 suggests that underreporting of consumption by the rich is not behind the differences in inequality over time.
Our evidence of only a modest rise in consumption inequality over the past five decades contrasts sharply with evidence from tax data that an increasing share of the nation's income is going to the very highest income families,10 though several papers using broader and more consistent measures of income reported on income tax forms do not show large increases in the top 1 percent's income share.11 Our analyses are distinct from these studies that focus on the highest income households. We do not include the extreme tails of the distribution because resources are likely to be poorly measured in survey data for these observations. Tax returns alone are also unsuitable for measuring incomes at the bottom, since they miss non-filers and important sources of income such as TANF, SSI, SNAP and housing benefits, which are not taxable.
What Explains the Sharp Differences in Inequality Patterns?
Many factors likely contribute to the differences between income and consumption inequality. As discussed above, there is considerable evidence that income sources that are particularly important for those at the bottom of the distribution are significantly underreported in surveys and that the extent of under-reporting has grown over time. A story of declining relative quality of income data at low percentiles is consistent with our results that show a much more noticeable rise in the 50/10 ratio for income than the 50/10 ratio for consumption over the past three decades. In addition, the divergence between income and consumption inequality measures is particularly evident for single-parent families, a group that receives a comparatively large share of transfer income.
For families with substantial holdings, changes in asset values could affect consumption even if income is unchanged. Thus, the sharp decline in asset prices after 2006, first in housing and then in financial assets, could explain why consumption inequality fell at the start of the Great Recession even though income inequality did not. This explanation is supported by evidence that between 2006 and 2010, a period of sharply falling asset prices, consumption spending rose for the lowest asset quintile, ranked by asset holdings, while it fell for the top four quintiles.
Implications
Most of the discussion around recent trends in inequality highlights growing dispersion. However, the evidence from consumption data indicates that changes in inequality in economic well-being are more nuanced than a simple story of rising income dispersion would suggest. In the bottom half of the distribution there is little evidence of rising consumption inequality, and in the top half of the distribution the rise in consumption inequality has been much more modest than the rise in income inequality, particularly since 2000.
Endnotes
M. Friedman, A Theory of the Consumption Function, Princeton, N.J., Princeton University Press, 1957; J. Poterba, "Is the Gasoline Tax Regressive?" in Tax Policy and the Economy, 5, pp. 145–64, 1991.
B. Meyer and J. Sullivan, "Measuring the Well-Being of the Poor Using Income and Consumption," NBER Working Paper 9760, June 2003, and Journal of Human Resources, 38:S, 2003, pp. 1180–220; B. Meyer and J. Sullivan, "Further Results on Measuring the Well-Being of the Poor Using Income and Consumption," NBER Working Paper 13413, September 2007, and Canadian Journal of Economics, 44(1), 2011, pp. 52–87; B. Meyer and J. Sullivan, "Identifying the Disadvantaged: Official Poverty, Consumption Poverty, and the New Supplemental Poverty Measure," Journal of Economic Perspectives, 26(3), 2012, pp. 111–36.
For studies of consumption inequality, see: D. Johnson and S. Shipp, "Trends in Inequality Using Consumption-Expenditures: The U.S. from 1960 to 1993," Review of Income and Wealth, 43(2), 1997, pp. 13–52; D. Slesnick, Consumption and Social Welfare, Cambridge, England: Cambridge University Press, 2001; D. Krueger and F. Perri, "Does Income Inequality Lead To Consumption Inequality? Evidence and Theory," Review of Economic Studies, 73(1), 2006, pp. 163–93; J. Heathcote, F. Perri, and G. L. Violante, "Unequal We Stand: An Empirical Analysis of Economic Inequality in the United States, 1967–2006," Review of Economic Dynamics, 13(1), 2010, pp. 15–51; O. Attanasio, E. Hurst, and L. Pistaferri, "The Evolution of Income, Consumption, and Leisure Inequality in the United States, 1980–2010," NBER Working Paper 17982, April 2012, and Improving the Measurement of Consumer Expenditures, University of Chicago Press, 2015; M. Aguiar and M. Bils, "Has Consumption Inequality Mirrored Income Inequality?," American Economic Review, 105(9), 2015, pp. 2725–56; J. Fisher, D. Johnson, and T. Smeeding, "Inequality of Income and Consumption in the U.S.: Measuring the Trends in Inequality from 1984 to 2011 for the Same Individuals," Review of Income and Wealth, 61(4), 2015, pp. 630–50.
B. Meyer, W. Mok, and J. Sullivan, "Household Surveys in Crisis," NBER Working Paper 21399, July 2015, and Journal of Economic Perspectives, 29(4), 2015; B. Meyer and N. Mittag, "Using Linked Survey and Administrative Data to Better Measure Income: Implications for Poverty, Program Effectiveness, and Holes in the Safety Net," NBER Working Paper 21676, October 2015; A. Bee and J. Mitchell, "Do Older Americans Have More Income Than We Think?" SEHSD Working Paper 2017–39, U.S. Census Bureau, 2017.
A. Bee, B. Meyer, and J. Sullivan, "The Validity of Consumption Data: Are the Consumer Expenditure Interview and Diary Surveys Informative?" NBER Working Paper 18308, August 2012, and Improving the Measurement of Consumer Expenditures, University of Chicago Press, pp. 204–40, 2015.
See Figure 1 in B. Meyer and J. Sullivan, "Consumption and Income Inequality in the U.S. Since the 1960s," NBER Working Paper 23655, August 2017.
C. DeNavas-Walt and B. Proctor, "Income and Poverty in the United States: 2014," Current Population Reports, P60-252, 2015.
Adding non-cash benefits (such as the value of food stamps and housing and school lunch subsidies as calculated by the Census Bureau) leads to slightly lower inequality, but the changes over time are similar to those for after-tax money income.
See B. Meyer and J. Sullivan, "Consumption and Income Inequality in the U.S. Since the 1960s," NBER Working Paper 23655, August 2017, for more details. The statistics are based on the authors' calculations. All income data are from the Current Population Survey and all consumption data are from the Consumer Expenditure Interview Survey.
T. Piketty and E. Saez, "Income Inequality in the United States, 1913—1998," Quarterly Journal of Economics, 118(1), 2003, pp. 1–41.
J. Larrimore, R. Burkhauser, G. Auten, and P. Armour, "Recent Trends in U.S. Top Income Shares in Tax Record Data Using More Comprehensive Measures of Income Including Accrued Capital Gains," NBER Working Paper 23007, December 2016, revised June 2017; G. Auten and D. Splinter, "Using Tax Data to Measure Long-Term Trends in U.S. Income Inequality," Working Paper, Office of Tax Analysis, U.S. Treasury Department, 2016.


