The 2017 Martin Feldstein Lecture
Uncertainty and Large Swings in Activity
It is a great honor, as well as a personal pleasure and privilege, to be invited to deliver the Feldstein Lecture. I have known Marty and Kate for almost 50 years. I met Marty in the summer of 1970, when I presented my first ever paper at the Second World Congress of the Econometric Society in Cambridge, England. The subject was investment, and Marty presented a paper, jointly with the late John Flemming, on the same topic. Those were the early days of computer analysis of data, and paper tape had not yet given way to the new technology of punched cards. But the application of rigorous theory to quantitative empirical analysis was a heady and seductive combination.
A year later I was a graduate student at Harvard with Marty as my mentor. A few years after that, Marty took over the National Bureau, and the first Summer Institute was held. "Oh, to be in Cambridge, England now that spring is here" became "Oh, to be in Cambridge, Massachusetts now that summer's here".1
And here we are at the 40th NBER Summer Institute. In the audience, I see economists who had not yet been born at the time of that first workshop in 1978. So in my lecture I want to trace the path that both Marty and I took from microeconomics to macroeconomics. In particular, I shall ask how far the so-called workhorse or canonical models of modern macroeconomics can help us understand what has been going on in the world economy for the past quarter of a century. My focus will be on uncertainty and large swings in economic activity — of the kind we saw in the Great Depression and more recently in the Great Recession of 2008-09 — and the unexpectedly slow and protracted recovery since the financial crisis.
In so doing, I want to draw inspiration from what, in my view, is one of Marty's greatest strengths: his ability to combine a conviction that economics has a great deal to offer in thinking about almost every aspect of our lives — Marty's freshwater characteristic — and an imagination to develop models and new data sources to examine previously unexplored territory — his saltwater dimension.
Introduction
The fundamental question that has divided economists since publication of The General Theory in 1936 is whether a market economy with flexible wages and prices is self-stabilizing. The recent financial crisis should have generated a more seri-ous debate about that question. But it takes a great deal to derail a conventional theory. As John Maynard Keynes wrote in the preface to his great work, "The ideas which are here expressed so laboriously are extremely simple and should be obvious. The difficulty lies, not in the new ideas, but in escaping from the old ones."2
The crisis did not lead to an intellectual revolution. Instead, debate focused on the appropriate policy response rather than the theoretical basis of current macroeconomics.3 Indeed, the workhorse model taught in courses on macroeconomics and used by policymakers survived the crisis better than did our economies. Even adding banks and financial rigidities, with new first-order conditions, did not change its basic properties. The central idea is that the economy moves in response to stochastic shocks around a steady-state or stationary long-run equilibrium.
It is interesting to ask how the stochastic, one-sector models so much in favor today came to dominate macroeconomic thinking. Fifty years or so ago, models of economic dynamics and models of economic growth were quite separate. The former stimulated the construction of econometric models with empirically estimated dynamic responses. The latter were concerned with long-run steady growth and later expanded into multisector models of economic development.4 The first advance was to incorporate the ideas of Frank Ramsey into the formulation of optimal growth paths based on the maximization of expected utility.5 The second was the explicit modelling of expectations in a stochastic environment. It was natural to relate expectations to the underlying long-run relationships driving the economy, and so rational expectations came to the fore. Multisector models seemed to add little to the insights into behavior afforded by the rational expectations revolution. Attention switched back, therefore, to one-sector models and the elaboration of stochastic shocks. And so we arrived at today's consensus on the centrality of one-sector DSGE (dynamic stochastic general equilibrium) models.
But these models have their limitations, and two seem to me particularly serious. First, expected utility theory has come to dominate macroeconomic modelling even though its foundations are fragile when analyzing behavior in the presence of large, one-off macroeconomic shocks. Second, the one-sector framework leads policymakers to focus exclusively on the level of aggregate demand rather than on its composition. Both features are, in my view, problematic in understanding the world economy today, as I shall now try to illustrate with a rapid tour of some of the relevant data.
Selected Data
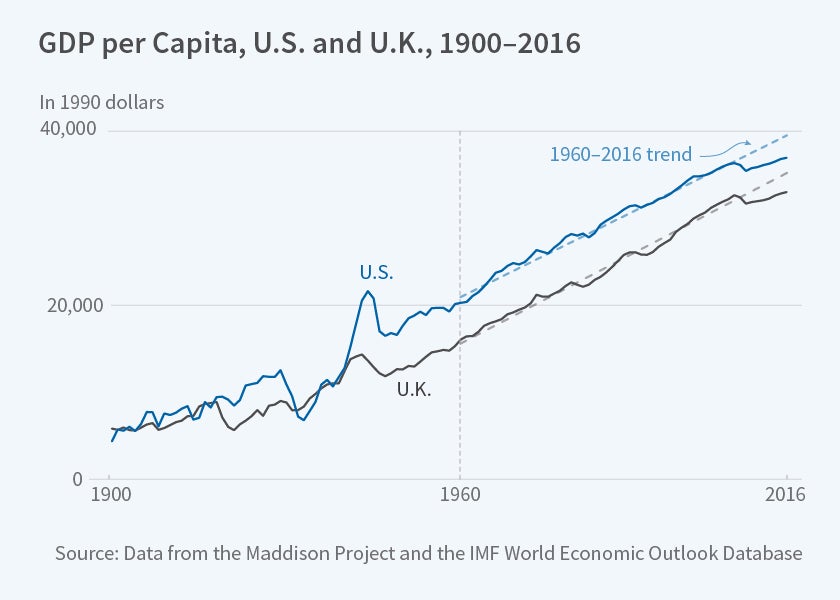
The proposition that the U.S. economy follows a path described by random shocks around a steady-state growth rate is given some support in Figure 1, which plots GDP per head at constant prices from 1900 to 2016.6 A trend line with a constant annual growth rate of 1.95 percent captures the upward path of GDP per head rather well. By far the largest deviations from this path were, of course, the Great Depression and the boom experienced in the Second World War. It is noticeable that, despite these large swings in activity, from 1950 onwards GDP per head resumed the path that would have been projected from an estimated trend over the period 1900 through 1930.
Figure 1 also shows data for the U.K. The underlying growth rate is remarkably similar, although, unlike the U.S., the U.K. did not experience the wild swings of the 1930s and 1940s. But at the end of the First World War the U.K. suffered a step down in the level of GDP per head and did not return to the previous trend path. This was when the U.S. took over the mantle of the world's financial leader.
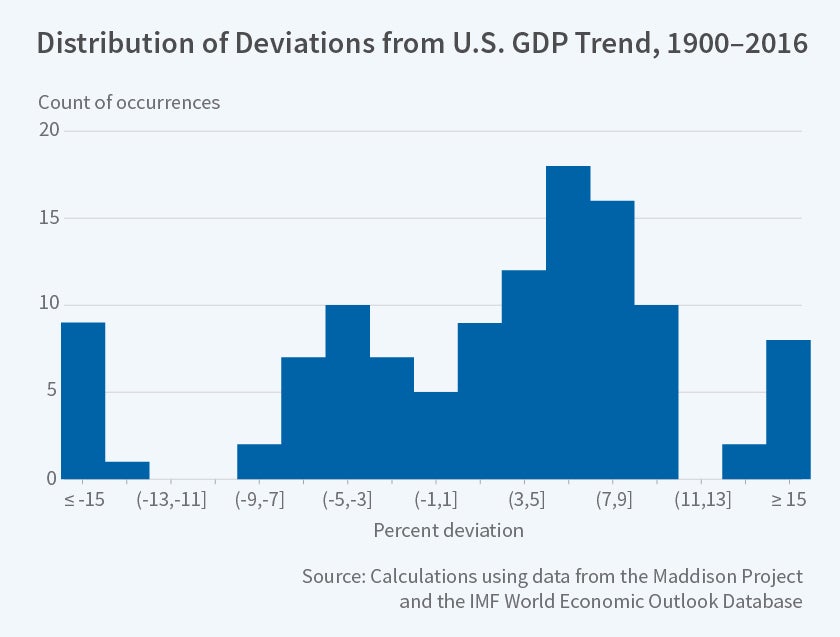
Figure 2 plots the distribution of percentage deviations from trend GDP in the U.S. over the full 1900-2016 period. Whatever else can be said, the chart does not look like a normal distribution. If the underlying distribution of shocks is normal, then it must be shifting over time, suggesting non-stationarity of the shocks.
For the period since 1960, Figure 1 shows the trend growth path for real GDP per capita for the U.S. and the U.K. over the 1960-2007 period — the period up to the beginning of the recent financial crisis. The growth rate is almost exactly the same, just over 2 percent a year, in both countries.7 Again, a constant trend growth path seems to fit reasonably well until the period beginning with the financial crisis. Since then the pattern of growth has been very different from its earlier path. A persistent shortfall from the previous trend is evident. Something significant has changed — and it is a matter of dispute as to whether the underlying productivity growth trend has fallen or whether there is another reason for the pattern of persistently slow growth.
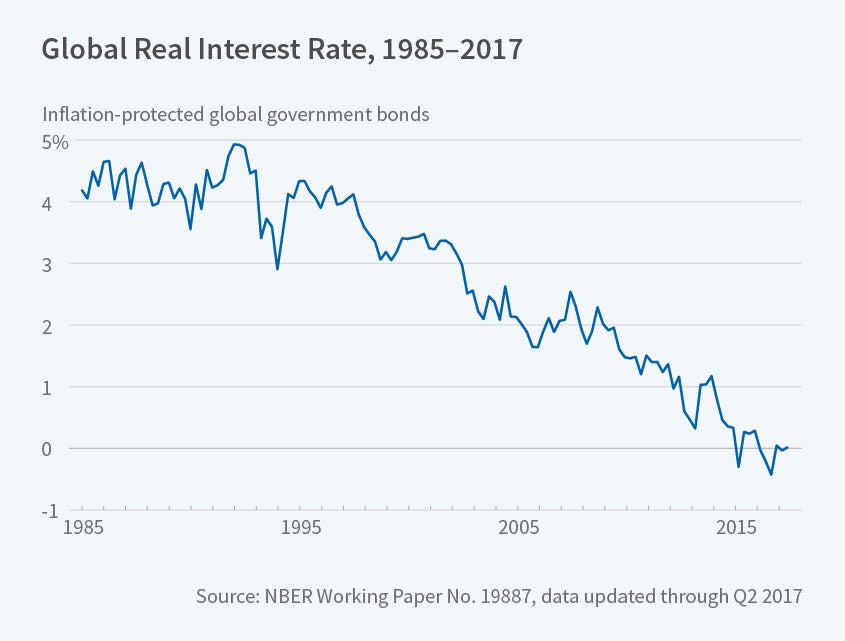
The most striking evidence of non-stationarity is shown in Figure 3. It plots the world real interest rate at a 10-year maturity, as calculated by David Low and myself from interest rates on government bonds issued with inflation protection, from 1985 to the middle of 2017.8 From around the time when China and the members of the former Soviet Union entered the world trading system, long-term real interest rates have steadily declined to reach their present level of around zero. Such a fall over a long period is unprecedented. And it poses a serious challenge to the one-sector growth model. In order to salvage the model, much effort has been invested in the attempt to explain why the "natural" real rate of interest has fallen to zero or negative levels. But there is nothing natural about a negative real rate of interest. It is simpler to see Figure 3 as a disequilibrium phenomenon that cannot persist indefinitely.
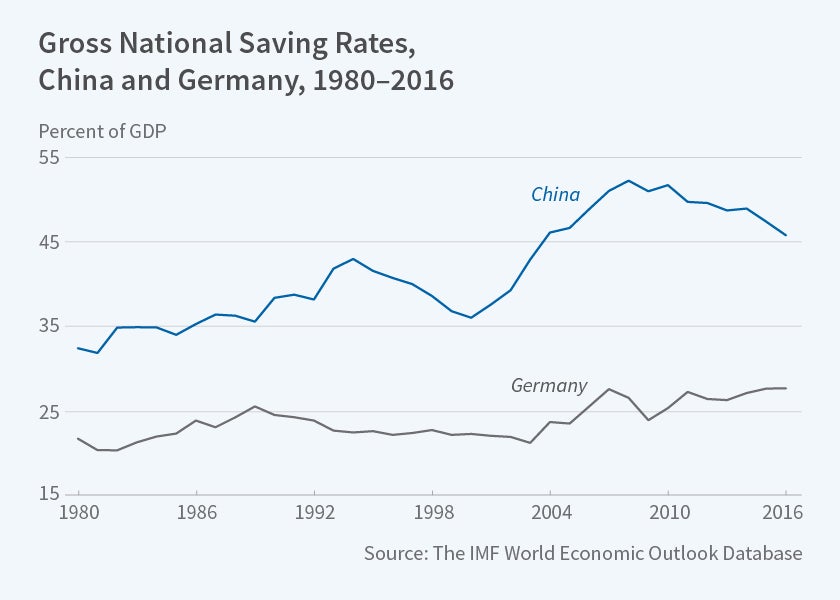
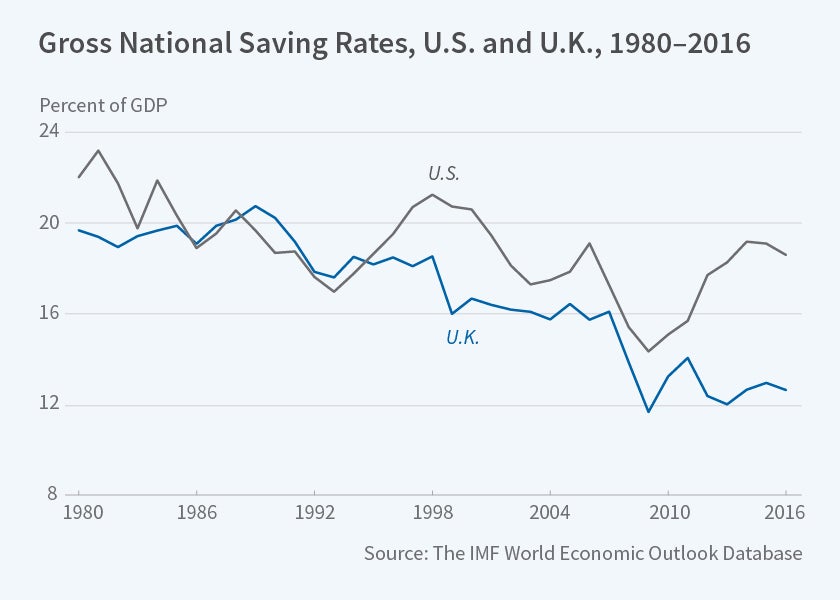
Part of the explanation lies in saving behavior. Figure 4 shows the gross national saving rates for China and Germany from 1980 through 2016. Their saving rates have risen markedly, especially in the case of China and more recently in Germany. Figure 5 shows the saving rates in the U.S. and U.K. over the same period. From the mid-1990s onwards, there has been a decline, again symptomatic of non-stationarity.
What these charts show is that the experience of the past 25 years cannot easily be described as the outcome of stochastic deviations from a stationary process. The data I have presented provide a prima facie case for considering explanations based on a divergence from a sustainable growth path along which the composition and not just the level of aggregate demand is a key driver of growth. To understand this requires going beyond the one-sector workhorse model that has come to dominate macroeconomic teaching and policymaking.
That model, even with modifications to first-order conditions to allow for various new "frictions," has two failings. First, it leans heavily on the assumption of forward-looking agents who optimise over known probability distributions of the shocks hitting the economy. But there is little empirical basis for computing the relevant probability distributions over events that are drawn from a non-stationary economic environment. Second, important movements in the world economy over the past quarter of a century cannot be explained easily in terms of a one-sector model. The minimum that is required is a two-sector view of the world with both tradable and non-tradable goods. How else are we to make sense of the changes in saving and investment rates in the major economies and the continuing current account imbalances?
Now, I do not want to suggest that we should abandon the workhorse model, simply that we should be prepared to consider other approaches. Imagine that you had a problem in your kitchen, and summoned a plumber. You would hope that he might arrive with a large box of tools, examine carefully the nature of the problem, and select the appropriate tool to deal with it. Now imagine that when the plumber arrived, he said that he was a professional economist but did plumbing in his spare time. He arrived with just a single tool. And he looked around the kitchen for a problem to which he could apply that one tool. You might think he should stick to economics. But when dealing with economic problems, you should also hope that he had a box of tools from which it was possible to choose the relevant one.9
And there are times when there is no good model to explain what we see. The proposition that "it takes a model to beat a model" is rather peculiar. Why does it not take a fact to beat a model? And although models can be helpful, why do we always have to have one?10 After the financial crisis, a degree of doubt and skepticism about many models would be appropriate.
Let me now turn to the first of the two failings I mentioned — the limitations of expected utility theory.
Uncertainty: The Fallacy of Bayesian Reasoning Outside a Frequentist Framework
I believe we need to face up to the challenge posed by radical uncertainty — a state of affairs in which we cannot enumerate all the possible states of the world and hence cannot attach subjective probabilities to them. The only sensible answers to the questions "Will President Trump still be in the White House in 2021?" and "Will the U.S. economy regain its pre-crisis trend growth path?" are "I don't know." None of the possible outcomes represent a series of repeated events in a stationary environment in which it would be possible to construct probabilities based on observed frequencies. And the most important future events that will shape the economy cannot even be imagined — new products emerged that were unimaginable 20 years ago.
We have all grown up with the simple-minded methodological view that agents can be modelled "as if" they optimized expected utility computed according to Bayesian updated "personal probabilities." Although useful in some — especially stationary — contexts, the expected utility framework, fundamental to modern macroeconomics, has serious weaknesses that make it unsuited to the analysis of major swings in economic activity.
Let me give a simple example. It relates to my own experience when, as deputy governor of the Bank of England, I was asked to give evidence before the House of Commons Select Committee on Education and Employment on whether Britain should join the European Monetary Union. I was asked how we might know when the business cycle in the U.K. had converged with that on the Continent. I responded that given the typical length of the business cycle, and the need to have a minimum of 20 or 30 observations before one could draw statistically significant conclusions, it would be 200 years or more before we would know.11 And of course it would be absurd to claim that the stochastic process generating the relevant shocks had been stationary since the beginning of the Industrial Revolution. There was no basis for pretending that we could construct a probability distribution. As I concluded, "You will never be at a point where you can be confident that the cycles have genuinely converged; it is always going to be a matter of judgment."12
The fact that the economic processes generating growth and fluctuations do not exhibit "stationarity" is of fundamental importance. It is why so many empirically estimated models break down. The world does not stand still long enough for an observer to measure the frequencies that would enable her to construct estimates of probabilities. And it is not only history that casts doubt on the plausibility of the assumption of stationarity. Learning from experience, including that of others, means that expectations evolve over time and induce a non-stationarity in economic relationships. Large swings in activity do not occur with sufficient frequency to permit a frequentist approach to estimating probabilities. They do not occur in an environment that is stationary over the relevant time scales. And there is no basis on which to construct subjective probabilities other than to succumb to the temptation, described so clearly by Paul Romer, to impose priors to resolve the identification problem.13
Equivalence of Probabilistic Reasoning and Complete Markets
What does radical uncertainty mean for macroeconomics? Much of macro-economics and finance leans heavily on models that assume, either explicitly or implicitly, complete (Arrow-Debreu) markets. As a result, those models are essentially static.14 What is less well understood is that a world of complete markets is isomorphic to a world in which subjective probabilities can be assigned to all states of the world.15
In the mid-19th century, mathematicians started to develop an axiomatic basis for probability theory independent of observed frequencies.16 Economists have been happy to adopt this approach to uncertainty, even though its originators were conscious of its limits. In his 1954 treatise on the foundations of statistics, L. J. Savage was careful to assess the realism of the axioms that underlay those foundations. They rested on a theory of decisions in which people looked ahead and anticipated all possible branches of the decision tree. Savage described the world in which probabilistic reasoning applied in these words: "...acts and decisions, like events, are timeless. The person decides 'now' once for all; there is nothing for him to wait for, because his one decision provides for all contingencies."17 It is a "grand decision." But this is exactly the world of complete Arrow-Debreu markets where people buy and sell in a single Walrasian "grand auction."18 The two worlds are the same, and Savage was clear that the proposition that they describe a wide range of decisions was, in his own words, "utterly ridiculous."
This isomorphism between complete markets and the axiomatic basis for probabilistic reasoning is no academic footnote. The world divides into two states. In the first, we can construct probabilities and markets are complete. In the second, radical uncertainty precludes the construction of probabilities and markets are incomplete. In the former, explanations for macroeconomic fluctuations reflect frictions in markets. In the latter, swings in activity are a natural consequence of incomplete markets. In our toolbox there is room for both approaches. But in trying to understand large swings in activity, I favor the second.
It is striking that the two major economists of the 20th century who took radical uncertainty seriously, Keynes and Frank Knight, devoted their attention to the two features of a capitalist economy that distinguish it from a Walrasian equilibrium.19 Knight explored the nature of entrepreneurship, something that is impossible to analyze outside radical uncertainty and incomplete markets. And Keynes wanted to understand why a capitalist economy was subject to large fluctuations in output and employment. As Keynes was only too well aware, an idea which is simple and obvious, but which is difficult to formalize mathematically, can be resisted almost indefinitely.
The models used today assume frictions of various sorts to explain why unemployment can persist. Yet it was this view against which Keynes fought in the 1930s. He was adamant that even if wages were perfectly flexible, unemployment could persist. In distilling the essence of The General Theory, the most penetrating analysis remains, in my view, the 1975 review article by Don Patinkin. He highlights chapter 19, on money wages, in which Keynes describes why a reduction of money wages is not an effective way to reduce unemployment: "The economic system cannot be made self-adjusting along these lines."20 Reductions in money wages increase desired employment, but if they also reduce expectations of future incomes, then aggregate spending may fall and unemployment persist. As Patinkin put it, "thus the General Theory is not a static theory of unemployment equilibrium, but a dynamic theory of unemployment disequilibrium."21 That is old-fashioned language from the 1970s, but it points to the centrality of the incompleteness of markets, which in turn rests on radical uncertainty.22
What has been overlooked in the discussion of monetary policy in the industrialised world today is that a similar argument holds for interest rates. Central banks have flirted with negative interest rates. But for many economists it has been a full-blown affair. The prevailing view that the main obstacle to our achieving macroeconomic stability is the zero lower bound on nominal interest rates is, I believe, more than a little misleading.23 Negative interest rates have a substitution effect which raises current spending, but such a change in policy may create expectations of future policy actions that would reduce incomes. Aggregate spending could fall rather than rise. Such a possibility is precluded by assumption in the workhorse model.
Rational, or more accurately, model-consistent, expectations proved invaluable in avoiding false inferences about the impact of government interventions. But if markets are incomplete, it is easy to forget that expectations over future prices of goods for which there are no current futures markets will also respond to changes in government policies. The Lucas critique applies equally to incomplete and complete markets. Feedback from negative interest rates to beliefs about future policies, and hence incomes, cannot be ruled out.
When confronted with radical uncertainty, agents develop and evolve narratives to cope with the challenge of making one-off decisions. An entrepreneur thinking of launching a new product does not calculate subjective probabilities and then maximize expected utility. There is no current price signal to guide her decisions. Instead, she develops a narrative within which it is possible to understand the key parameters determining the likely success of the product, and makes a judgment. As Danny Kahneman put it: "No one ever made a decision because of a number. They need a story."24 When the financial crisis hit in 2007, and took a major turn for the worse in 2008, the reaction of policymakers was not to update their prior probabilities with each new observation. It was to ask: "What is going on here?" Or to quote Chuck Manski in a recent NBER Working Paper, "Introspecting about how I revise my own macroeconomic expectations after receipt of new information, I often find it difficult to conjecture an explicit sampling process. Hence, I am unable to consciously update in the Bayesian manner."25
Time does not permit a discussion of narratives as a way of describing macroeconomic events — I provided one for the response of spending to the financial crisis in my book The End of Alchemy. But I do want to emphasize that I'm using the word "narrative" in a very different sense from that deployed by Robert Shiller in his AEA Presidential Lecture earlier this year. For him, a narrative is "a simple story or easily expressed explanation of events that many people want to bring up in conversation or on news or social media because it can be used to stimulate the concerns or emotions of others."26 It contrasts with a rational view of the world. For me, a narrative is an entirely rational way to approach the challenge of radical uncertainty. It is a story that integrates the most important pieces of information in order to make a decision, and I provide examples in my book.
A Two-Sector Model with Slow Speed on the Turnpike Approach
I turn now to the limitations of the one-sector nature of the canonical model in macroeconomics. When Marty Feldstein was a young man, multisector growth models were all the rage. The optimal path from an initial starting point was to move toward and then remain close to a balanced growth path along which all sectors grew at the same rate. The early literature was concerned with finding conditions under which the optimal path would be close to the balanced growth path for most of the time — just as in a long car journey the optimal route is to get onto the highway and stay with it until close to the final destination.27 Hence such results were known as turnpike theorems and they were proven under rather general conditions.
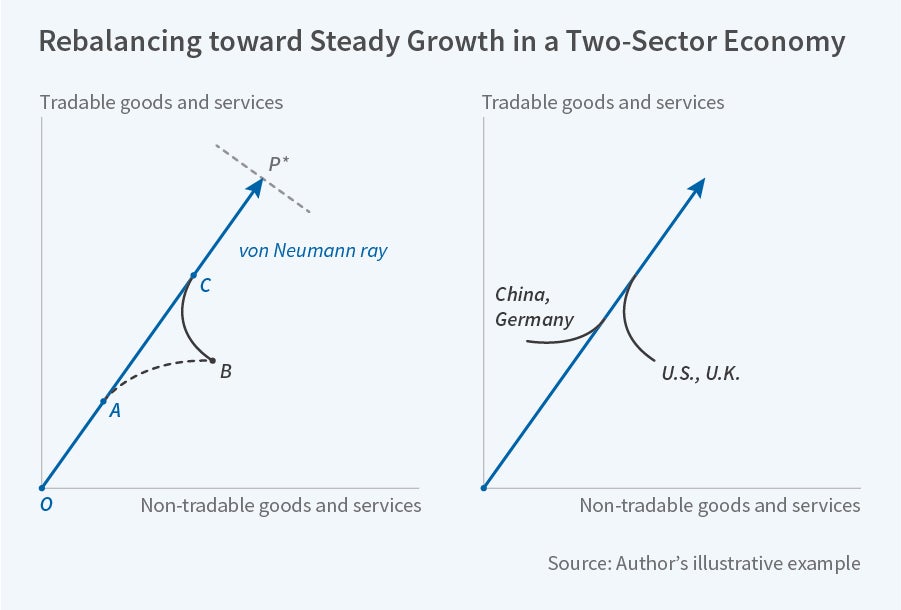
Multisector models fell out of favor largely because of the focus on the steady-state of those models. If all sectors were growing at the same rate, then the models added little to the insights provided by one-sector models. But their real interest lies in the adjustment path off the steady-state. Without burdening you with formalities, Figure 6 shows an illustrative optimal path for an economy with two sectors, tradable and non-tradable goods and services. In the left panel, the solid line OP shows the balanced growth path — often known as the von Neumann ray — and the prices supporting the path are given by the slope of the line orthogonal to that ray. The dotted line AB shows the path of an economy steadily moving away from balanced growth, as I believe happened in the run-up to the crisis, along which the relative price of the two goods differs from its steady-state value. Having arrived at point B, the economy now needs to rebalance. Starting from point B, the optimal path BC takes the economy along the solid line which shows the optimal trajectory towards and then converging on the balanced growth path.
For any initial composition of output, such as B, the optimal path will stay within a certain neighborhood of the von Neumann ray for most of the time. But starting from an unbalanced combination of tradable and non-tradable sectors, the interesting turnpike result is that in order to get back to a balanced economy, it pays to reallocate resources between the two sectors sooner rather than later. In the sector that has over-expanded, that may require a contraction of output and writing off of capital. Focusing on the adjustment to the equilibrium path — or the "traverse" in [John] Hicks' terminology — brings an Austrian flavor to the analysis of growth in the two-sector model, especially with the possibility that it is optimal to discard capital invested in the "wrong" sector.28 And along the optimal path, measured growth of total output will initially be weak relative to the growth rate along the balanced path. In the one-sector model, the problem does not really arise. Deviations from the steady-state path reflect random shocks, which die away of their own accord.
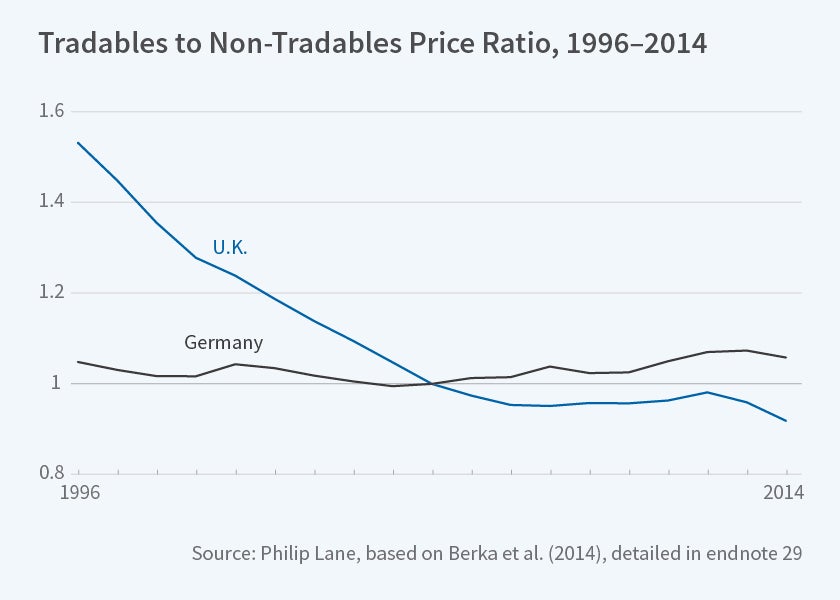
My two-sector division — between tradable and non-tradable goods and services — is stylized but captures, in my view, an important division reflecting the imbalances in the world economy prior to the crisis, and the need to rebalance now. Figure 7 shows the relative price of tradables versus non-tradables in both the U.K. and Germany over the period 1996 through 2014, using data supplied by Philip Lane, now Governor of the Central Bank of Ireland.29 It is clear that one of the problems faced by the U.K. in trying to avoid unbalanced growth is the steady fall in the price of tradable goods and services relative to non-tradables. Only following the sharp depreciation of sterling during the financial crisis was that relative price stable. For much of the period, there seems to be evidence that an unsustainably high real exchange rate led inexorably to a current account deficit and the need to rebalance the economy. With the further appreciation of sterling in 2014 and 2015, the fall in the relative price resumed. All this puts the depreciation of sterling since last summer into perspective. In contrast, Germany has experienced, if anything, a rising price of tradables, and it is hence no surprise that its current account surplus has risen to unsustainable levels, around 8½ percent of GDP last year.
The right panel in Figure 6 shows the route back to a balanced growth path for economies with the same technology but with different histories of their tradable goods sectors. It shows the path for economies that have seen their tradable goods sectors expand too rapidly, and for those that have experienced a relative decline in their tradable goods sectors.30 One could easily imagine that the former illustrates the challenge facing China and Germany today, whereas the latter represents the experience of the U.S. and the U.K. For economies of both types, the task of reallocating resources, including fixed capital, may require a period of low growth and falls in output in some sectors. The real interest rate is important but it is not the only relative price that matters in understanding slow growth today.
The key insight from such models is simple but important: the composition of demand matters. Trying to understand weak growth in the context of a single commodity forces the debate into the arena of either weakness of aggregate demand or slower productivity growth. But the turnpike theorem suggests that weak growth can be the property of an optimal response to the need to rebalance the composition of demand and output. I believe that that is exactly where we are today.
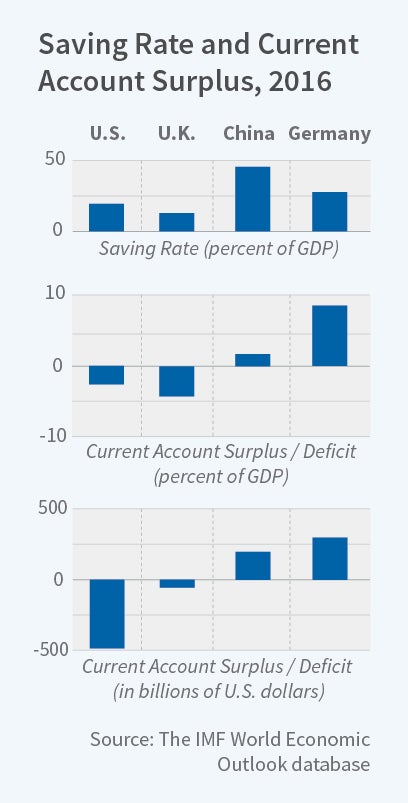
Figure 8 shows the imbalances last year among the four major parts of the world economy in which current account deficits and surpluses are significant. Both the U.S. and U.K. had substantial current account deficits, amounting in aggregate to around $600 billion, and China and Germany had correspondingly large current account surpluses. All four economies need to move back to a balanced growth path. But far too little attention has been paid to the problems involved in doing that. With unemployment at low levels, the key problem with slower-than-expected growth is not insufficient aggregate demand but a long period away from the balanced path, reflecting the fact that relative prices are away from their steady-state levels. The result is that the shortfall of GDP per head relative to the pre-crisis trend path was over 15 percent in both the U.S. and U.K. at the end of last year. Policies which focus only on reducing the real interest rate miss the point; all the relevant relative prices need to change, too.
Another Story
There are many stories which purport to explain recent growth experience. There is the decline in growth potential emphasized by Robert Gordon,31 secular stagnation advanced by Lawrence Summers,32 and others. For example, a recent paper by John Fernald, Robert Hall, James Stock, and Mark Watson attributes slow growth to a declining trend in total factor productivity and a decline in labor force participation.33 Perhaps, perhaps not. Recent growth has been very similar in the U.S. and U.K. But in the U.K., labor force participation has risen, not fallen. And it is possible to reconcile low unemployment with weak growth as the property of a transition to a two-sector turnpike path during which resources must shift from the non-tradable to the tradable sector. No doubt other explanations will be forthcoming. And in truth it is too soon to tell.
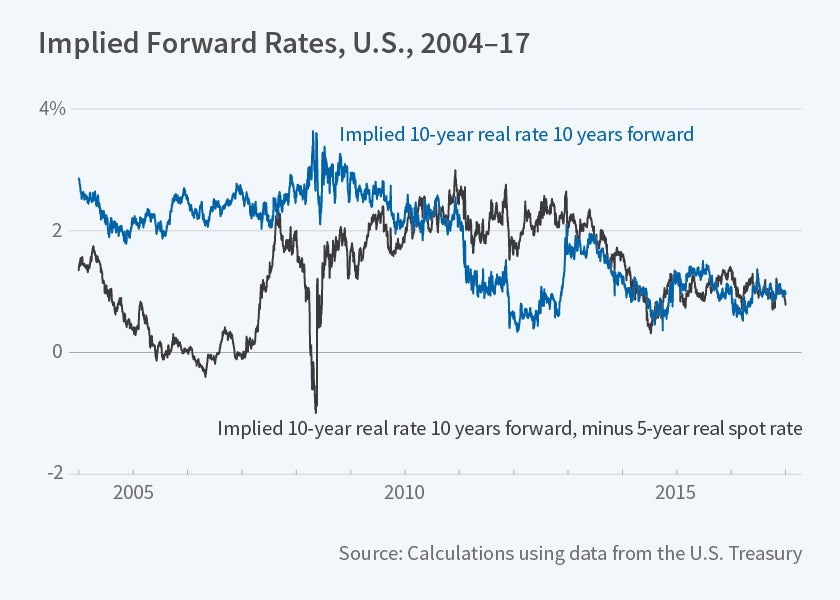
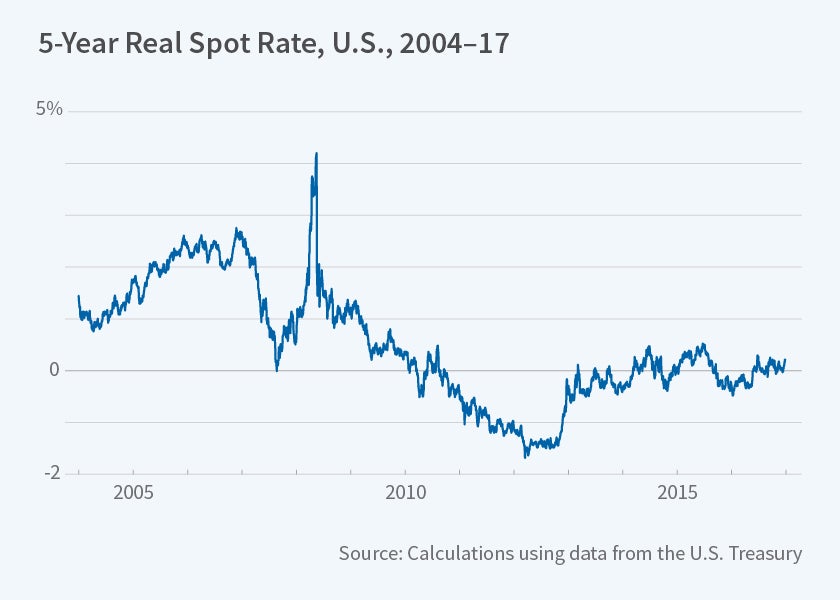
But do not be misled into thinking that, because unemployment is low, an unfortunate sequence of negative shocks has come to an end, and normality is about to be restored. Figure 9 shows the real interest rate that markets expect to hold 10 years from now in the U.S.: the 10-year 10 year forward rate implied by the yield structure of real rates. The crisis dashed hopes that real rates might go back to something more normal and the current expectation is close to only 1 percent a year. It also shows the same implied rate minus the five-year spot real rate. Again, there is little sign of market expectation of normalization. And Figure 10 shows the five-year spot rate staying remarkably close to zero.
Conclusions
The moral of my story is that it is important not to be constrained by existing models, nor to think that simply tinkering with those models provides an answer to the challenges posed by the crisis and by unexpectedly slow growth over the past decade.
I am not suggesting that we should abandon our existing tools. It is a question of horses for courses. But the workhorse model does not constitute a comprehensive toolkit. Remember the lesson of the good economics plumber — carry many tools with you, and always pose the question: What is going on here? Designing practical policies to improve public interventions is a continuing challenge, and one that Marty has explored throughout his career in a wide variety of fields: health, taxation, saving, social security, monetary and macroeconomic policies, and even defense economics. Taken together, those contributions certainly add up to a life well-lived.
Marty is still a role model for younger economists who want to be the kind of economics plumber that every family would trust with their kitchen. And even after almost 50 years I look forward to a few more decades of learning from my mentor.
This is an annotated, lightly edited version of the Martin Feldstein Lecture delivered July 19, 2017, at the NBER Summer Institute.
Endnotes
To be precise, the first lines of Robert Browning's poem Home-Thoughts, from Abroad, written in 1845, are: "Oh, to be in England Now that April's there"
J. M. Keynes, The General Theory of Employment, Interest and Money, London: Macmillan and Co., 1936, pp. viii.
Exceptions include P. Romer, "The Trouble with Macroeconomics," Stern School of Business, New York University, September 2016.
An interesting discussion of the evolution of growth models may be found in S. Spear and W. Young, "Two-Sector Growth, Optimal Growth, and the Turnpike: Amalgamation and Metamorphosis," Macroeconomics Dynamics, 19(2), 2015, pp. 394-424, and in the classic survey paper, F. Hahn and R.C.O. Matthews "The Theory of Economic Growth: A Survey," Economic Journal, 74(96), 1964, pp. 779-902.
Data for 1900 through 2010 from the Maddison Project at https://www.rug.nl/ggdc/historicaldevelopment/maddison/releases/maddison-project-database-2013?lang=en, (2013 version), updated from the IMF WEO Database for April 2017. For the methods used to construct these data, see J. Bolt and J.L. van Zenden, "The Maddison Project: Collaborative Research on Historical National Accounts," The Economic History Review, 67(3), 2014, pp. 627-51.
The computed trend growth rates over 1960-2007 are 2.2 percent a year in the U.S. and 2.3 percent a year in the U.K.
The data in M. King and D. Low, "Measuring the 'World' Real Interest Rate," NBER Working Paper 19887, February 2014, with updates to late 2016 by the authors. The extension to July 2017 relies on the change in the U.S. TIPS real yield published on the U.S. Treasury website, because the Bank of England has temporarily (as of June 2017) suspended publication of real yields while the estimation methodology is reviewed.
For a view of the economist as plumber from the perspective of a microeconomist, see E. Duflo, "The Economist as Plumber," American Economic Review, 107(5), 2017, pp. 1-26.
A similar point is made in R. Reis, "Is Something Really Wrong with Macroeconomics?" London School of Economics, June 2017, mimeo.
"In the longer run what is likely to be the potential cost of a one-size-fits-all monetary policy? That is extremely hard to judge and to be confident. The reason why I think one can say you will never really know is that to have enough experience, enough observations, on business cycles to find out whether they have converged — the IMF Study did not cover very long periods — you need 200 or 300 years of data." Select Committee on Education and Employment Minutes of Evidence, Thursday 27 May 1999, Question 46.
P. Romer, "The Trouble with Macroeconomics," Stern School of Business, New York University, September 2016.
See the discussion in S. Spear and W. Young (endnote 4). As Reis (endnote 10) has argued, there are recent efforts to introduce elements of non-stationarity into small theoretical models. But they have yet to alter the mainstream of thinking about policy and still rest on the assumption of expected utility maximization.
See the discussion of the "grand auction" in M. King, The End of Alchemy, New York: W.W. Norton, 2016.
J. M. Keynes, Treatise on Probability, London: Macmillan and Co., 1921, and F. Knight, Risk, Uncertainty and Profit, Boston: Hart, Schaffner & Marx, Houghton Mifflin Co., 1921.
J. M. Keynes, The General Theory of Employment, Interest and Money, London: Macmillan and Co., 1936, p. 267. Page references are to the Royal Economic Society Collected Writings of John Maynard Keynes.
21. D. Patinkin, "The Collected Writings of John Maynard Keynes: From the Tract to the General Theory," Economic Journal, 85, June 1975, p. 257. ↩
Many of these arguments about the formation of expectations were expounded at length in the writings of G.L.S. (George) Shackle.
C. Manski, "Survey Measurement of Probabilistic Macroeconomic Expectations: Progress and Promise," NBER Working Paper 23418, forthcoming in NBER Macroeconomics Annual 2017, volume 32, M. Eichenbaum and J. Parker, eds., Chicago: University of Chicago Press.
R. Shiller, "Narrative Economics," American Economic Review Papers and Proceedings, 107, 2017, pp. 967-1004.
A useful survey of turnpike models is given in L. McKenzie, "Turnpikes," American Economic Review, 88(2), 1998, pp. 1-14.
See John Hicks' article on neo-Austrian growth theory: J. Hicks, "A Neo-Austrian Growth Theory," Economic Journal, 80(318), 1970, pp. 257-81.
Tradable and non-tradable inflation rates are compiled as a weighted average of price changes of individual consumption goods. Price changes and item weights are drawn from the Eurostat HICP database (https://ec.europa.eu/eurostat/databrowser/view/prc_hicp_manr/default/table?lang=en). All items are classified as either tradable or non-tradable, following M. Berka, M. Devereux, and C. Engel, "Real Exchange Rates and Sectoral Productivity in the Eurozone," NBER Working Paper 20510, September 2014, Table 1. The non(tradable) consumption weight is the sum of all item weights that are classified as (non)tradables divided by the sum of all item weights.
It is important to remember the distinction between traded and tradable goods and services. Although the definitions used in any particular empirical application are somewhat arbitrary, and hence the data need to be used with some circumspection, for Figure 7 the share of tradable goods and services in total output in 2014 was 58.5 percent in Germany and 58.4 percent in the U.K., well above their respective shares in actual trade. An attempt to calculate the relative price of tradables versus non-tradables in the U.S. has been made by Rui Mano of the IMF, and the U.S. too has experienced a fall in the relative price of tradables with a similar proportion between the two sectors, as in the U.K. and Germany.
R. Gordon, The Rise and Fall of American Growth: The U.S. Standard of Living since the Civil War, Princeton: Princeton University Press, 2016.
L. Summers, "The Age of Secular Stagnation: What It Is and What to Do About It," Foreign Affairs, March/April 2016.
J. Fernald, R. Hall, J. Stock, and M. Watson, 2017, "The Disappointing Recovery of Output after 2009," NBER Working Paper 23543, June 2017, forthcoming in Brookings Papers on Economic Activity.


