Income Risk over the Life Cycle and the Business Cycle: New Insights from Large Datasets
Millions of young men and women enter the labor market annually. Over the next 40 years, each of them goes through a unique journey that involves surprises as well as disappointments: searching for the dream career, finding and losing jobs, getting promotions, salary raises, or demotions, and experiencing the recessions and booms of the macro economy.
In recent research, I try to understand the nature of the uncertainty that major labor market events generate for workers. There are three main dimensions of this research, which studies how individuals' income uncertainty and risk varies over the business cycle and over the life cycle, and how it has changed over the last four decades. The answers to these questions are of immediate relevance for both deepening our knowledge of labor market dynamics and for informing social insurance debates, such as those surrounding Social Security reform, unemployment insurance policy, the degree of job protection, and the progressivity of the tax system. Each of these policies seeks to moderate various types of individual risk.
In this summary, I discuss in detail my colleagues' and my findings on the variation of income risk over the business cycle. I also briefly describe our findings about life cycle risk and changes in risk over time.
Because of its central role for policy questions, the nature of individual income uncertainty has received significant attention from academics since the 1970s, when panel datasets on individual incomes started to become available. However, those datasets—as well as the majority of newer ones—were overwhelmingly based on surveys and therefore suffered from the usual problems of small sample sizes, sample attribution, and survey response error. The data problems forced researchers to focus on simple, parameterized statistical models to examine these questions. Perhaps not surprisingly, the combination of data issues and restrictive methods and assumptions often yielded a wide range of answers to these questions, resulting in wide disagreements. My earlier research on these topics also relied on these survey-based datasets and methods; I became increasingly uncomfortable about their use and this motivated the current work.
My research on income uncertainty builds on two main elements. First, it makes extensive use of large administrative panel datasets on individuals from various countries, some of which have become more widely available in the last decade. Second, because these datasets do not suffer from the shortcomings of survey data such as small sample, attrition, and measurement error, my research relaxes many of the econometric assumptions made in prior literature. For example, my collaborators and I relax the strong focus in earlier work on just the variance—the second moment—as a measure of risk and uncertainty. We find that most of the interesting and substantively important variation happens in "higher-order moments," in particular in the third- and fourth-order moments. The risk from these components, "higher-order risk," matters a great deal for a range of substantive economic questions.
The Datasets
One dataset my coauthors and I have used in this research comes from the Master Earnings File (MEF) of the U.S. Social Security Administration (SSA). The MEF currently covers the entire U.S. population with a Social Security number from 1978 to 2013. It contains data on each individual’s labor earnings (wage/salary income from W-2 forms and self-employment income from Schedule SE), as well as some key demographic variables and employer identifiers. The substantial sample size, 600 million individual-year observations in a 10 percent subsample, allows us to employ fully nonparametric methods and take what amounts to high-resolution pictures of individual earnings histories. The relaxation of parametric assumptions is a key part of this research agenda.
In addition, we use data from Swedish, German, and French administrative records (Linda, IAB, and DADS, respectively) and complement them with various survey-based datasets (PSID for the U.S. and GSOEP for Germany) as well as firm-level datasets (Compustat Global, OSIRIS, and ORBIS).
Income Risk over the Business Cycle
Conventional wisdom among economists was that income shocks become much larger in recessions, and that this property was captured by a rise in the variance of such shocks. The most widely-cited papers on this question used survey-based data from the Panel Study of Income Dynamics (PSID), applied parsimonious parametric specifications for income dynamics, and concluded that the variance of persistent income shocks roughly tripled in recessions relative to expansions.1
While the hypothesis of countercyclical variance of income shocks is consistent with the plausible idea that many individuals experience large negative shocks in recessions, it also implies, less plausibly, that with a larger variance many more individ-uals experience larger positive shocks in recessions than in expansions. In fact, typical estimates in the literature imply that about 40 percent of individuals receive larger positive shocks in recessions than they do in expansions.
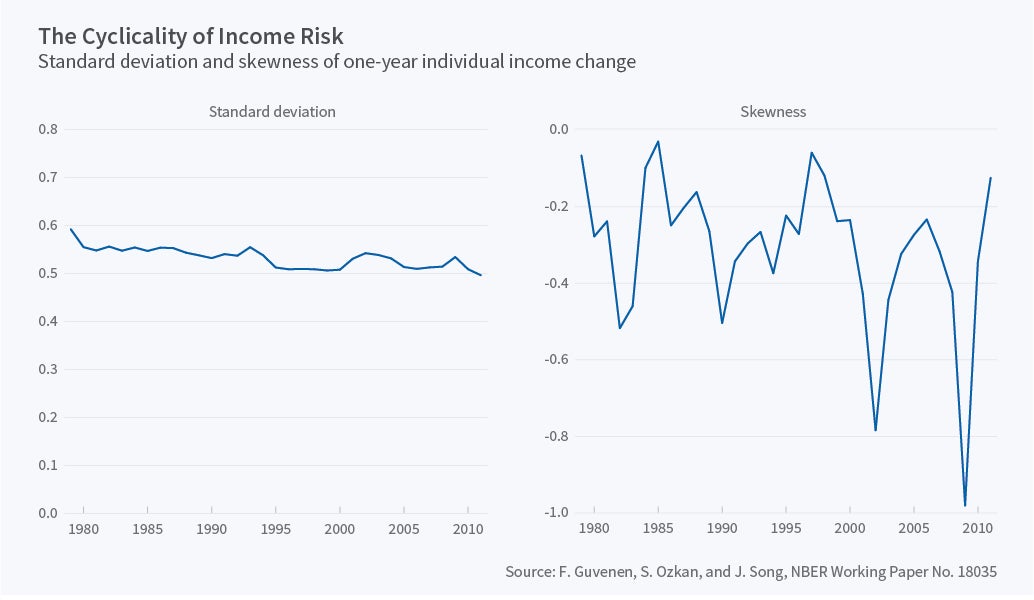
Serdar Ozkan, Jae Song, and I used Social Security Administration data on tens of millions of U.S. workers and documented two sets of results on the cyclicality of income risk.2 First, the variance of income shocks is not countercyclical at all—in fact, it is virtually flat over the business cycle. This can be seen clearly in the left panel of Figure 1, which plots the cross-sectional standard deviation of one-year income changes from 1978 onward, a period that includes four recessions and three expansions.3 We also examined whether this overall lack of cyclicality might be hiding some countercyclical variance of shocks for certain groups defined by age, average past income, and others. We found no evidence to that effect, with an almost flat variance emerging within every group we examined.
So, do we conclude that the nature of income risk does not change over the business cycle? No. In fact, it changes quite significantly, but we have to move beyond the variance—to the third moment, skewness—to see these big changes. Skewness is a measure of asymmetry of a distribution. A negative skewness means that relative to the median outcome, the likelihood of large negative outcomes is higher than that of large positive outcomes, and vice versa for positive skewness. The right panel of Figure 2 plots the skewness of income shocks, which is strongly procyclical. During recessions, the upper end of the income change distribution collapses—large upward income changes such as raises, promotions, big career moves, and so on become less likely, and the bottom end expands as large drops in income from job losses and reductions in hours become more likely. Thus, while the dispersion of shocks does not increase, shocks become more left-skewed, and hence risky, during recessions.
A second question, one that has received little attention in earlier academic work, is whether the fortunes of a worker during a recession can be predicted in part by observable characteristics measured prior to the recession. If so, this would imply that business cycle risk has a predictable component—a "factor structure" whereby aggregate shocks can translate differently to workers with different characteristics—which is quite different than purely idiosyncratic shocks that receive almost all the attention in studies of individual income risk.
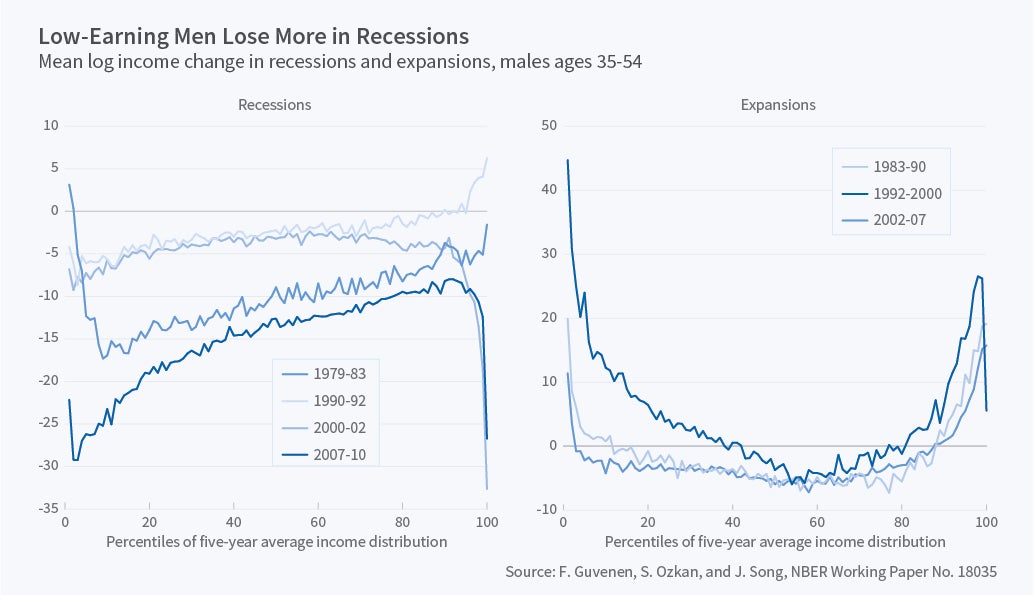
We found that one variable in particular—the average earnings of a worker over the five-year period that precedes a recession—strongly predicts how much the worker will suffer during that recession. In particular, lower pre-recession earnings predict larger subsequent losses. For example, workers who were at the 10th percentile before the Great Recession suffered an average earning loss from 2007 to 2009 that was 18 percentage points larger than those who were at the 90th percentile. The 1980–83 double dip recession displayed just as strong a factor structure, with similarly large differences in the effects of the recession for workers who entered the recession at different points of the income distribution. The other two, smaller, recessions exhibited smaller gaps but the same factor structure. These patterns are seen clearly in the left panel of Figure 2, which plots the upward-sloping factor structure for all four recessions between the 10th and 90th percentiles of the five-year average income distribution.
Figure 2 also shows an interesting reversal within the top 5 percent and even more strongly inside the top 1 percent of the pre-recession income distribution. Workers who entered the Great Recession in the top 1 percent lost on average 30 percent of their 2007 income by 2009. Similarly, those in the top 0.1 percent lost 50 percent of their income between 2006 and 2011 (a much longer horizon). As surprising as this may sound, the Great Recession was not the most severe recession for very top earners: Earnings losses for the top 1 percent and 0.1 percent were more severe during the 2000–01 recession and just as bad during the 1989–94 period. These changes are not likely to be the result of wage declines; our labor earnings measure includes bonuses, restricted stock units at time of vesting, and exercised stock options.
Is this upward-sloping factor structure specific to recessions or does it also emerge in expansions? The answer is a partial "no." Expansions display a more complex pattern. This can be seen in the right panel of Figure 2, which plots the analogous graphs for the three expansions. In particular, workers who entered each expansion above the 70th percentile of the income distribution experienced an upward-sloping factor structure, which further stretched the income distribution at the top end. The opposite happens at the lower end, where those with lower pre-expansion income see larger increases in their income during the subsequent expansion and catch up to the rest of the workers. This catching up was very strong during the 1992–2000 expansion and weaker during the other two expansions, which is only partly due to the longer duration of the 1990s recession.
An important corollary to these findings on the factor structure is that a large part of the well-documented rise in income inequality during recessions and its partial reversal during expansions is due to this predictable factor structure and not from larger shocks.
Social Insurance Policy
The analysis in the preceding paper raises three questions. First, are the business cycle patterns in income risk specific to the United States, or do they hold more broadly in other developed economies? Second, since these findings were documented for male earnings; do the results extend to household earnings, which might benefit from within-household insurance? And three, how are these patterns affected by government social insurance policies, in the form of unemployment benefits, welfare, and the tax policy?
To provide a broad perspective on these questions, my paper with Christopher Busch, David Domeij, and Rocio Madera studies panel data from Germany and Sweden, covering roughly the same time period as the project described above.4 We supplement these with U.S. data from the PSID. These datasets provide information not only on household income but also on income taxes and a broad range of government benefits.
The cyclical behavior of both individual and household income is remarkably similar across these countries in terms of flat variance and procyclical skewness, which is somewhat surprising given that the countries differ in many details of their labor markets. Furthermore, skewness is procyclical within almost every subgroup—education level, gender, type of employment, occupation, and so on—that we examined. Therefore, the fundamental forces driving skewness over the cycle seem to be a robust feature of developed economies.
Second, moving from individual earnings to household earnings makes only a small difference to the cyclicality of risk, suggesting little within-household insurance against the business cycle component of individual income risk.
Third, government-provided insurance plays a more important role than within-household insurance in reducing downside risk in all three countries. The effect of government programs is weakest in the United States, and is much stronger (and comparable to each other) in Germany and Sweden.
How about Cyclicality of Employers?
About 93 percent of the individuals in our sample earn the majority of their labor income from wages and salaries, that is by working for a firm as opposed to by being self-employed. So it is natural to wonder if the cyclical behavior of the wage income of employees we found so far is also manifest in the distribution of employers' performance. An active literature has studied the cyclicality of firm outcomes, such as sales and profit growth rates and shocks to firm-level total factor production. These studies used panel datasets and typically made parametric assumptions similar to those made in the income dynamics literature discussed above. They found that key variables, such as firm-level sales or profit growth, had countercyclical variances.5
Sergio Salgado, Nicholas Bloom, and I revisit this conclusion and also examine the cyclicality of skewness, again using nonparametric methods and expanding the analysis to firm-level data from 40 or so countries, including almost all developed economies.6 In particular, we use Compustat from 1962 to 2013 for U.S. publicly listed firms, and to study firms in other countries, we use Compustat Global, OSIRIS, and ORBIS, which contain very rich data on sales, employment, and profits, on a very large number of firms.7
A robust finding across the vast majority of countries and different firm-level variables is that the skewness of growth rates is strongly procyclical—as was the case with individual income. In fact, this pattern of a lower tail of growth rates greatly expanding during recessions is also the main driver behind the counter-cyclicality of variance, which holds in some countries during some time periods, but is not as pervasive or robust as the procyclical skewness.
To summarize, the results of these three papers draw attention to fluctuations in skewness over the business cycle as a robust feature—much more so than fluctuations in variance, especially for earnings risk.
How Does Individual Income Risk Vary
over the Life Cycle and across the Population?
There is surprisingly little consensus on how the nature of income risk changes over the life cycle and across income groups. This lack of consensus is again mostly due to data limitations and the required parametric assumptions discussed above.
Fatih Karahan, Ozkan, Song, and I study these issues using the SSA panel data.8 A main finding is that income shocks are far from following a normal distribution, and the extent of deviation from the normal bell-curve benchmark varies significantly with age and income level. In particular, income shocks become much more negatively skewed as workers age, up to about ages 45 to 50, and as their incomes increase, up to about $100,000 per year.
Further, and more importantly, income shocks are much more concentrated for those with very low incomes and in the tails of the distribution—a feature called excess kurtosis. In other words, most individuals have small income changes in most years but experience very large up or down income moves—that also tend to be quite persistent—relative to a normal distribution, which predicts lots of middling shocks and few very large or very small shocks. The extent of this excess kurtosis also increases substantially with age and with income levels, again up to roughly the same age and income threshold as for skewness.
Recent follow up work on these findings has important implications for a range of economic questions. For example, George M. Constantinides and Anisha Ghosh show that an incomplete markets asset-pricing model with countercyclical (negative) skewness shocks generates plausible asset-pricing implications.9 Lawrence Schmidt goes one step further and consid-ers both negative skewness and thick tails (targeting the moments documented in my work with Ozkan and Song) and finds that the resulting model provides a plausible set of prediction for asset prices.10 With regard to fiscal policy, a recent paper by Mikhail Golosov, Maxim Troshkin, and Aleh Tsyvinski shows that using an income process with negative skewness and excess kurtosis implies a marginal tax rate on labor earnings for top earners that is substantially higher than under a traditional calibration with normally-distributed shocks with the same variance.11 Finally, Greg Kaplan, Benjamin Moll, and Giovanni L. Violante show that introducing earnings shocks with excess kurtosis into a New Keynesian model with household heterogeneity has important implications for the monetary transmission mechanism.12
To sum up, studying the higher-order moments of individual income dynamics seems to be a key step for better understanding the nature of the idiosyncratic risk facing workers. Precise estimation of these higher-order moments and documentation of how they vary over the business cycle and life cycle, as well as across the population, require large and clean panel datasets, which are rapidly becoming more available. This move towards big data holds great promise for the future of empirical work in this area, and will hopefully allow researchers to correct old misconceptions, reveal new and interesting findings, and push economic research forward.
Endnotes
K. Storesletten, C.I. Telmer, and A. Yaron, "Cyclical Dynamics in Idiosyncratic Labor Market Risk," Journal of Political Economy, 112(3), pp. 695–717.
F. Guvenen, S. Ozkan, and J. Song, "The Nature of Countercyclical Income Risk," NBER Working Paper 18035, May 2012, and Journal of Political Economy, 2014, 122(3), pp. 621-60.
These income changes we plot are closely linked, but are not the same as the innovations or shocks to income. In the paper, we have also linked these income changes to underlying persistent shocks to show that the same procyclical skewness emerges in the shocks as well.
C. Busch, D. Domeij, F. Guvenen, and R. Madera, "Asymmetric Business Cycle Risk and Government Insurance," Working Paper, University of Minnesota, 2016.
N. Bloom, "The Impact of Uncertainty Shocks," NBER Working Paper 13385, September 2007, and Econometrica, 77(3), 2009, 623–85.
For many developed countries the data is quite comprehensive, going back to the 1980s, and including both public and private firms. For others, the time horizon is shorter and only public firms are included.
F. Guvenen, F. Karahan, S. Ozkan, and J. Song, "What Do Data on Millions of U.S. Workers Say About Labor Income Risk?" NBER Working Paper 20913, January 2015.
G. Constantinides and A. Ghosh, "Asset Pricing with Countercyclical Household Consumption Risk," NBER Working Paper 20110, and forthcoming in the Journal of Finance.
L. Schmidt, "Climbing and Falling Off the Ladder: Asset Pricing Implications of Labor Market Event Risk," Working Paper, University of Chicago, 2016.
M. Golosov, M. Troshkin, and A. Tsyvinski, "Redistribution and Social Insurance," American Economic Review, 106(2), 2016, pp. 359–86.
G. Kaplan, B. Moll, G.L. Violante, "Monetary Policy According to HANK," NBER Working Paper 21897, January 2016.


