The Glass Ceiling and the Paper Floor: Gender Differences Among Top Earners, 1981-2012
While still small, the share of top earners who are women has increased over time, and women's chances of falling out of the top group have declined.
Individuals in the top 1 percent of the income distribution in the United States earn 15 percent of all pre-tax income and pay 40 percent of all individual income taxes. In The Glass Ceiling and the Paper Floor: Gender Differences Among Top Earners, 1981-2012 (NBER Working Paper No. 20560), Fatih Guvenen, Greg Kaplan, and Jae Song explore how the gender composition of this group has changed over the last three decades.
While the share of top earners who are women has been small throughout the period being studied, the authors find that over time women have become better represented in the top earnings group. Once in this group, women have a much greater chance of staying there today than 30 years ago. This suggests that women are shoring up what the authors describe as the "paper floor" through which a substantial number of top earning women used to slip back into lower-earning brackets.
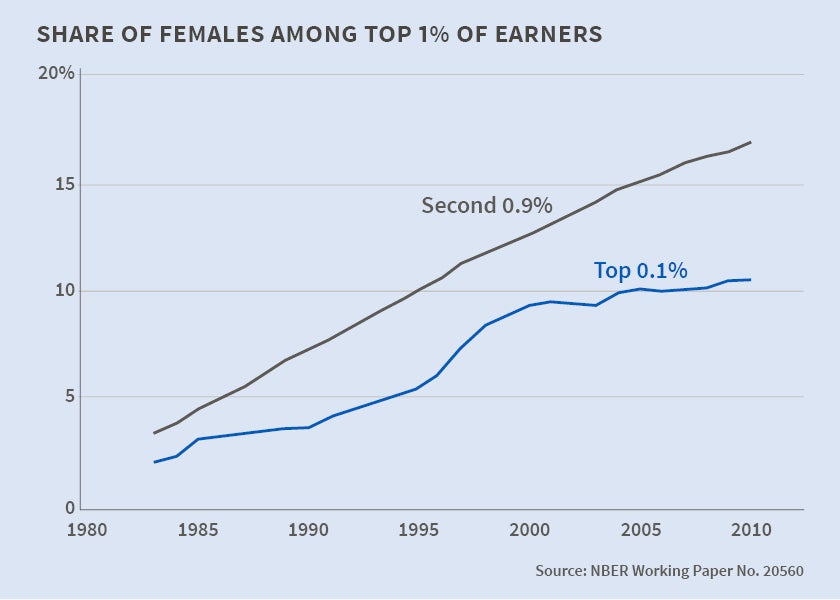
When earners were ranked by their average earnings over the 1981-85 period, women made up 1.9 percent of the top 0.1 percent and 3.3 percent of those in the next 0.9 percent of the distribution. By comparison, when earners were ranked by their average earnings in the 2008-12 period, women represented 10.5 percent and 17 percent of those groups. In 1981�85 there were 50.6 men for every woman in the top 0.1 percent, compared to 8.5 in 2008-12. This change does not appear to be the result of rising earnings by some members of the cohorts that were in the labor force in the earlier period, but rather is attributable to a greater share of women in the top-earning ranks of younger cohorts.
The authors caution that those identified as top earners based on short-horizon measures like annual earnings may not correspond to top earners based on lifetime labor market experience. Lifetime top earners have faster earnings growth between ages 25 and 43 than other groups, and the gender gap among top earners is largest among the 30-year-olds. The authors observe that this is consistent with the hypothesis that "career interruptions for family reasons explain a substantial portion of the top earnings gender gap."
The data suggest that only 7 to 9 percent of the increase in the female share in the top percentiles is due to increased female labor force participation. The similarity of gender composition of groups of top earners across industries suggests that the increase in female top earner membership is an across-the-board phenomenon.
The data set for the study was a 10 percent sample of the Social Security Administration Master Earnings File from 1981 to 2012. This file contains all of the information reported by employers on employee W-2 forms each year. The authors' sample was limited to people aged 25 to 60 who had annual earnings of at least $1,885, as measured in 2012 dollars.
In 2012, an individual had to earn at least $291,000 to be in the top 1 percent and $1,018,000 to be in the top 0.1 percent. For the five-year period 2008 to 2012, average earnings of $282,000 put an individual in the top 1 percent and earnings of $918,000 put an individual in the top 0.1 percent. The 2012 sample mean and median incomes were $51,000 and $35,000, down from the five-year averages of $53,000 and $38,000. Between 1981-85 and 2008-12, five-year average earnings grew by 139 percent for the top 0.1 percent, 63 percent for the top 1 percent, and 22 percent for the remaining 99 percent.
The authors conclude that a "dramatic increase in the persistence of female top earners has been an important factor in accounting for the rise in the share of females among top earners."
The degree of persistence at the top of the earnings distribution has increased over time for both men and women. In 1981, the chance that a woman in the top 0.1 percent of the earnings distribution would drop out of the top 1 percent in the next year was 64 percent. For women in the top 1 percent but not the top 0.1 percent, the analogous probability was 74 percent. For men, the comparable probabilities were 24 and 43 percent. In 2012, by comparison, the chance that a woman who was in the top 0.1 percent in 2011 fell below the top 1 percent was only 8 percent, compared with 7 percent for men. The corresponding probabilities for men and women in the top 1 percent, but not the top 0.1 percent, were 32 percent and 26 percent, respectively.
-- Linda Gorman


