Projecting Federal Deficits and Debt
The US federal budget situation has changed dramatically in the last 25 years. In 2001, projected surpluses totaling $5.6 trillion over the ensuing 10 years were expected to eliminate all public debt by 2006. At the end of the 2024 fiscal year, federal debt held by the public stood at approximately 98 percent of GDP, or $28 trillion. Recent legislative changes have accelerated the accumulation of federal debt, raising questions about the sustainability of current policies and their economic implications.
In Then and Now: A Look Back and Ahead at the Federal Budget (NBER Working Paper 34455), Alan J. Auerbach and William Gale develop fiscal projections that incorporate the recently enacted One Big Beautiful Bill Act (OBBBA) and analyze the economic ramifications of rising debt levels.
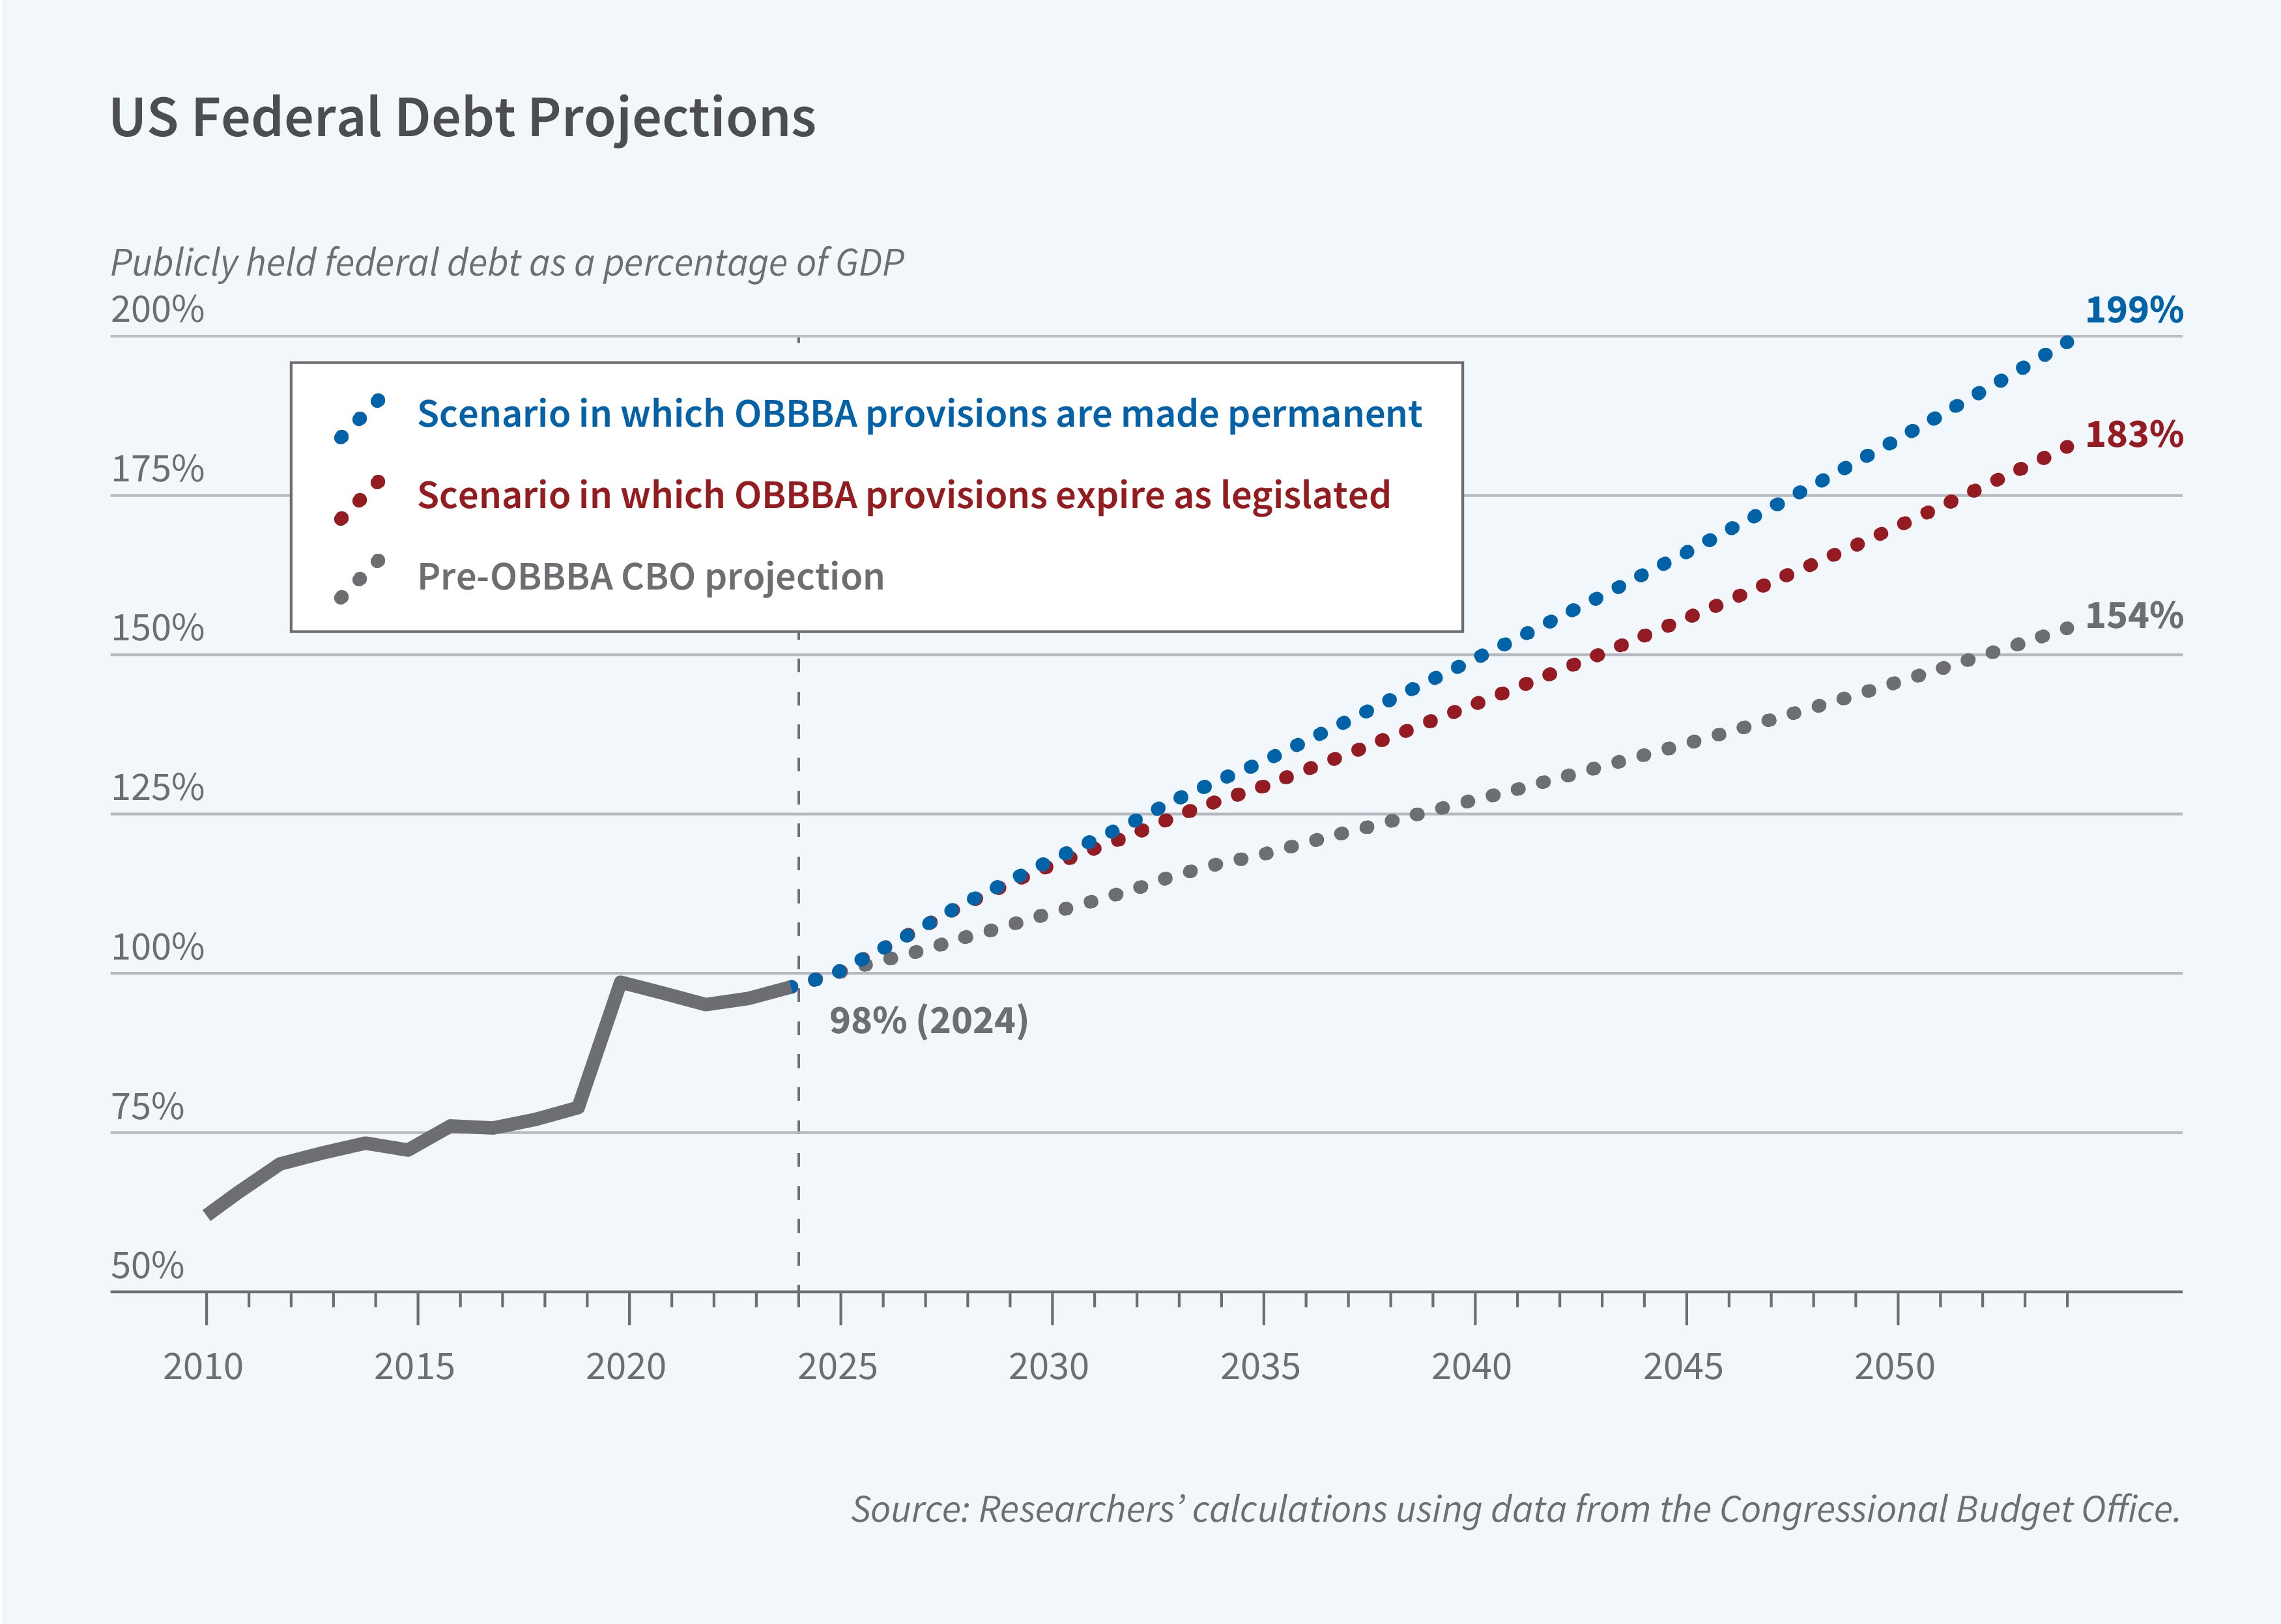
The researchers construct three scenarios for debt and deficits through 2054. The first, the “March 2025 baseline,” uses pre-OBBBA Congressional Budget Office (CBO) projections. The second, the “July 2025 baseline,” incorporates OBBBA as legislated. The third, their “current-policy baseline,” assumes OBBBA’s temporary tax and spending provisions become permanent.
The researchers rely on the CBO’s projections for the next decade. For the years beyond that 10-year window, they assume that revenues and mandatory spending grow at the rates projected in CBO’s March baseline, while discretionary spending remains constant as a share of GDP. Interest payments are calculated as the product of average interest rates from CBO projections and accumulated debt.
In the July 2025 baseline scenario, which incorporates OBBBA as written, the debt-to-GDP ratio reaches 183 percent by 2054, compared to 154 percent in the March baseline without OBBBA. The cumulative effect of OBBBA is thus a 29 percentage point increase in the debt-to-GDP ratio after three decades. If OBBBA’s temporary provisions are made permanent, as assumed in the current policy baseline, debt rises to 199 percent of GDP by 2054.
The primary deficit—the gap between noninterest spending and revenue—averages around 3 percent of GDP throughout the projection period. This is an unprecedented, sustained imbalance during a period of peacetime prosperity. Net interest payments are projected to rise from 3.2 percent of GDP in 2025 to 6.3 percent in 2054 under current law, far exceeding the previous historical peak of 3.2 percent in 1991. Rising interest payments account for more than 100 percent of the increase in the unified deficit through 2054.
Social Security, Medicare, and net interest together account for more than all of the projected growth in government spending relative to GDP through 2054. The projections assume that defense spending falls to its smallest share of GDP since before World War II, while nondefense discretionary spending as a share of GDP approaches its lowest level since 1962.
The researchers calculate “fiscal gap"—the permanent, immediate policy changes needed to meet specific debt targets by 2054. Starting in 2026 from the current-law baseline, stabilizing the debt-to-GDP ratio at its 2024 level would require permanent spending cuts or tax increases equaling 2.9 percent of GDP. This represents approximately $827 billion in 2024 dollars, equivalent to 34 percent of income tax revenues or 14 percent of noninterest spending. If OBBBA’s provisions are made permanent, the spending cuts or tax increases needed to close the gap rise to 3.4 percent of GDP.
If productivity growth exceeds current projections by 0.5 percentage points annually, the 2054 debt-to-GDP ratio under current policy scenario falls from 199 to approximately 158 percent. However, if productivity remains as forecast and instead interest rates respond to higher debt levels in a manner that is consistent with recent empirical estimates, rising 3 basis points per percentage point increase in the debt-to-GDP ratio, the ratio reaches 233 percent by 2054 in the current policy scenario.
William Gale thanks Arnold Ventures and the California Community Foundation for generous research support.


