Global Evidence on the Decline and Recovery of Rust Belt Cities
Manufacturing employment peaked in the United States and the United Kingdom in the 1970s, in France and Italy in the ‘80s, and in Germany and Japan in the ‘90s. Each of these countries experienced deindustrialization that lowered manufacturing employment. On average, between the peak manufacturing year for each country and 2010, total employment rose by 7.5 percent while manufacturing employment dropped by 7 percent.
In The World’s Rust Belts: The Heterogeneous Effects of Deindustrialization on 1,993 Cities in Six Countries (NBER Working Paper 31948), Luisa Gagliardi, Enrico Moretti, and Michel Serafinelli find that cities with higher shares of college-educated workers were more likely to recover from the loss of manufacturing jobs, and that cities that depended more on manufacturing jobs were more vulnerable to deindustrialization.
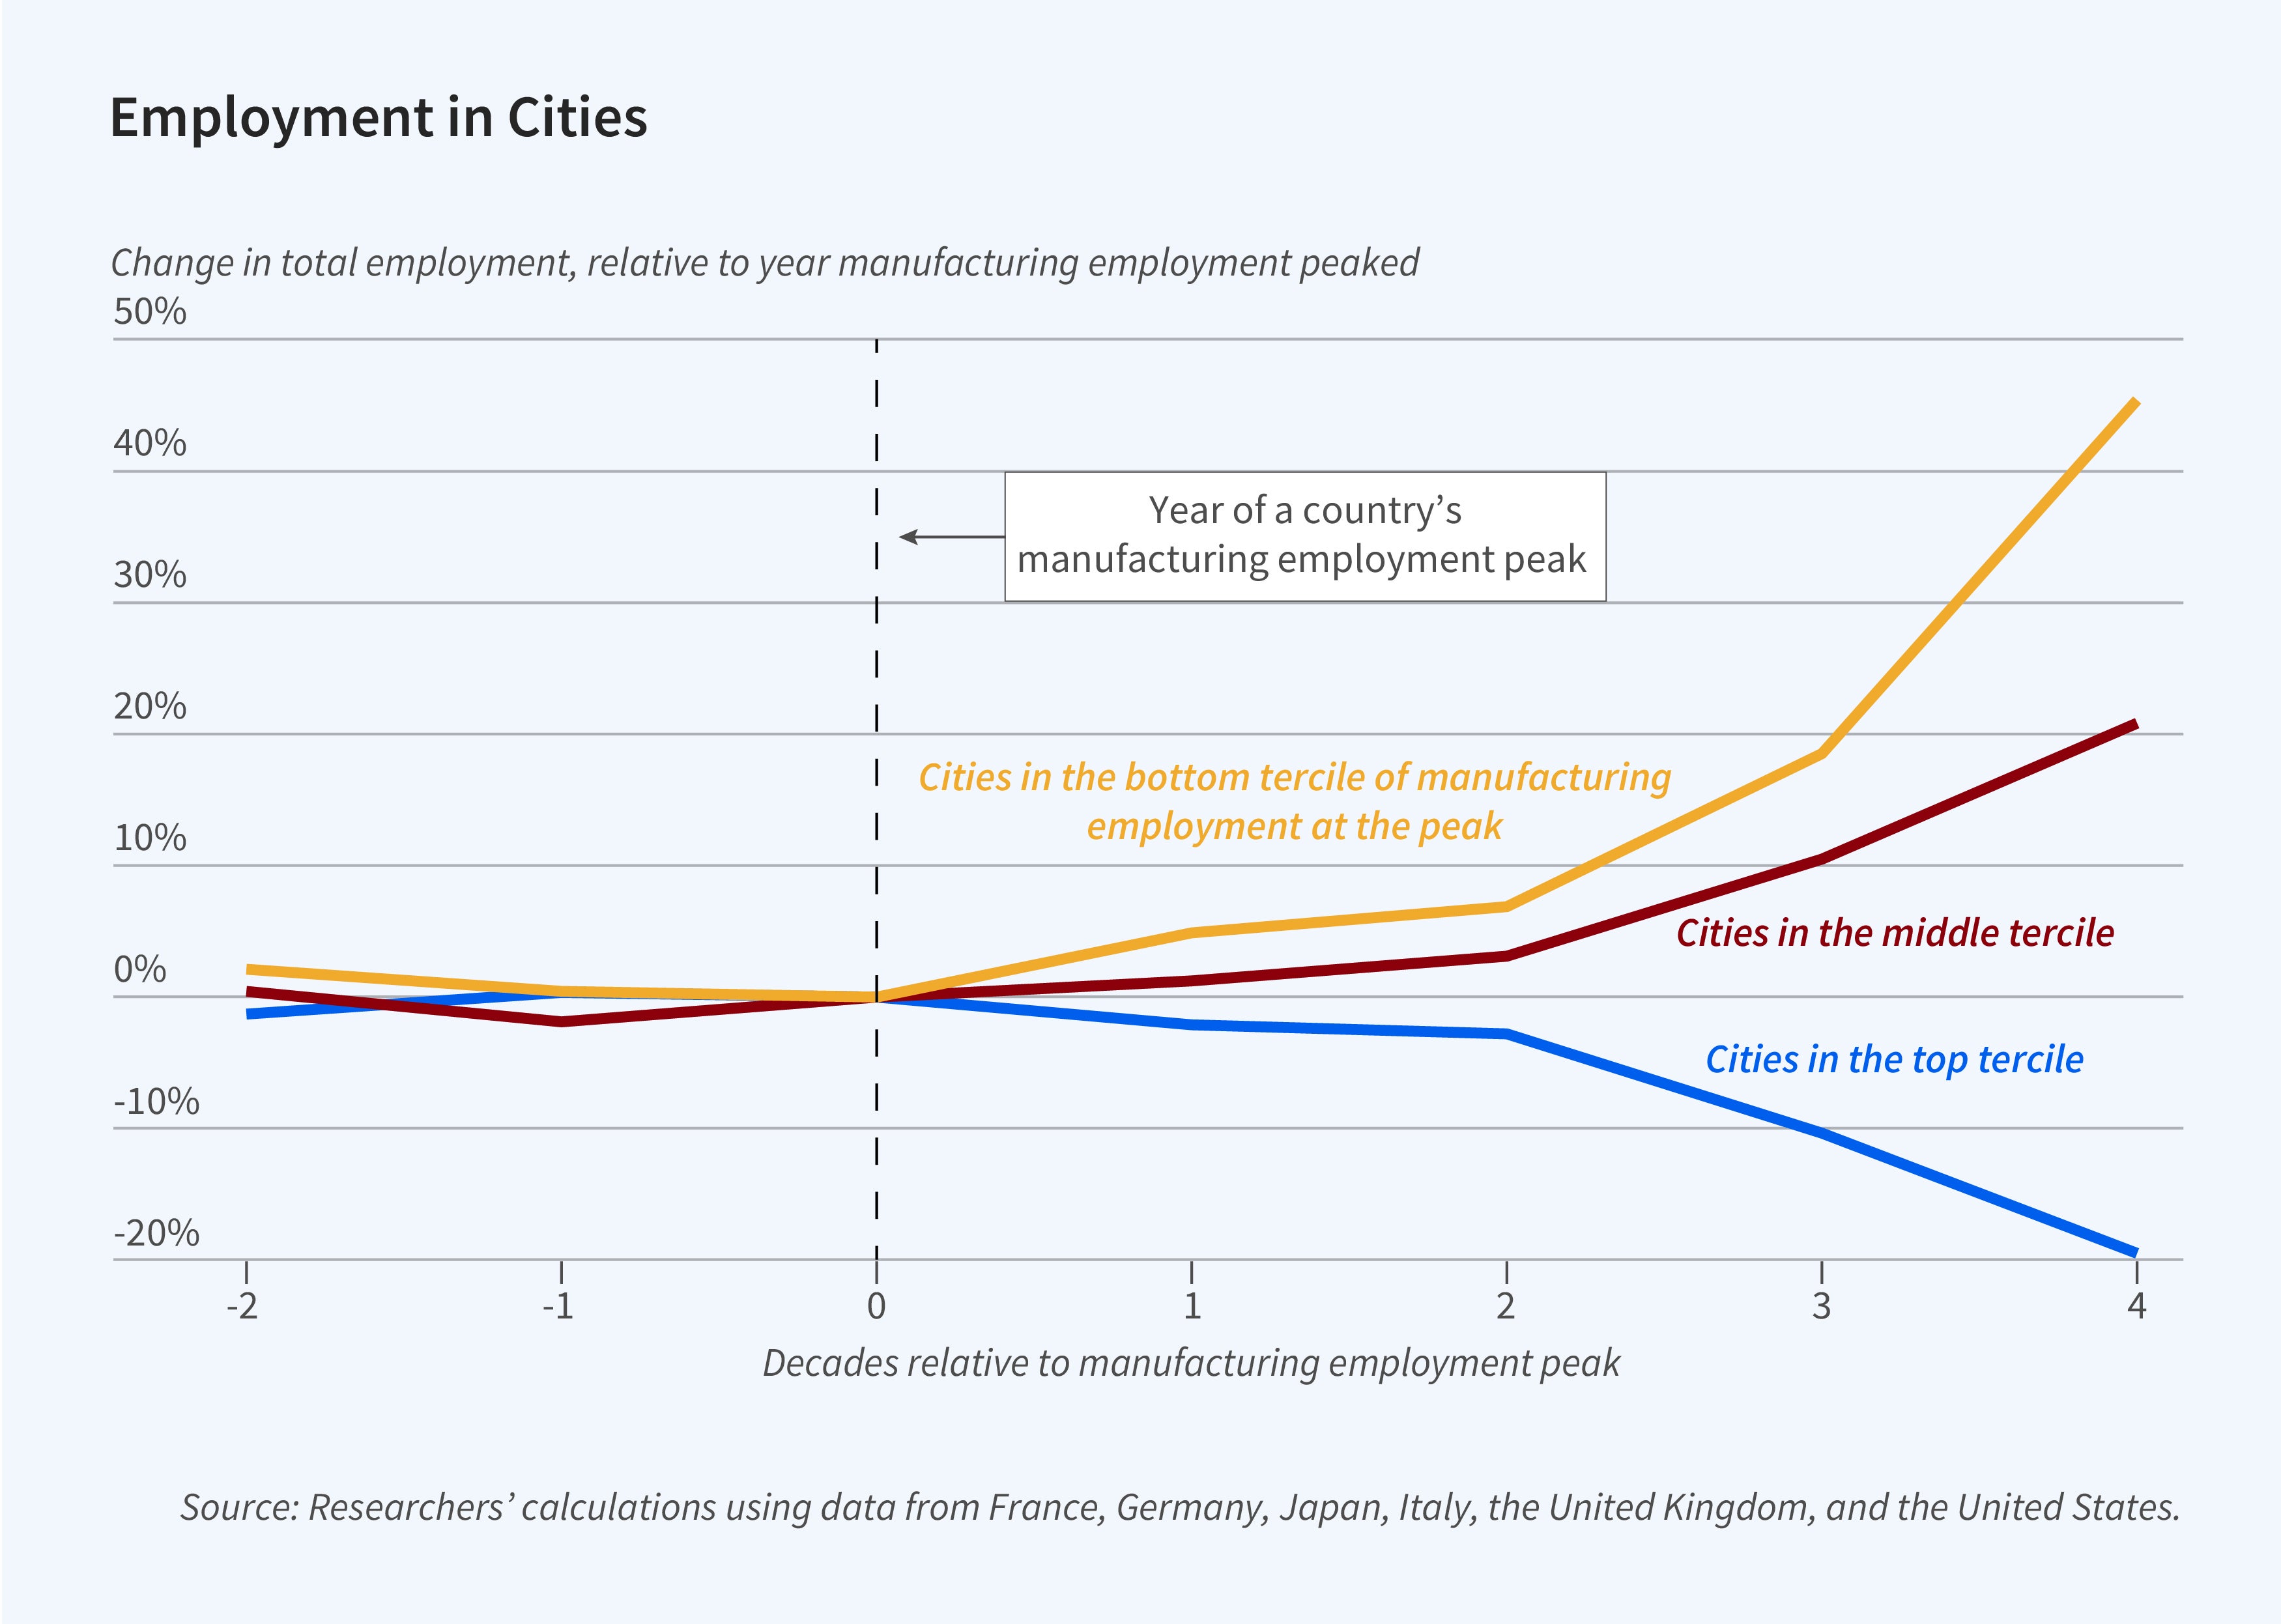
The researchers stratify cities into terciles based on their manufacturing employment share in the year of their country’s manufacturing peak. In the two decades preceding that peak, the average employment growth rates for cities in all terciles were similar to the aggregate employment growth rates in their respective countries. However, growth diverged in the post-peak decades. The tercile of cities labeled “former manufacturing hubs" experienced falling employment while cities in the other terciles experienced growth. A 1 standard deviation increase in a city’s initial manufacturing share, 16.1 percentage points, was associated with a 2.7 percent per decade decrease in total employment growth after the manufacturing peak.
Former manufacturing hubs with higher shares of college-educated workers were more likely to recover from employment losses related to deindustrialization.
While a majority of former manufacturing hubs lost employment relative to national benchmarks during deindustrialization, 34 percent of these cities either maintained or accelerated their employment relative to other cities in the same country. There are substantial differences in this experience across countries. For example, nearly half of German hubs successfully recovered to their prior employment levels, compared with only 17 percent of US hubs. The researchers suggest that US Rust Belt communities were hit harder than their international counterparts in part because of their relatively less educated workforces. The gap in the college-educated share of the workforce in hubs and non-hubs, 1.7 percentage points in the US, was larger than in other countries.
The researchers provide further evidence on the role of education by segmenting cities into quartiles based on the share of their residents with a college degree in the year of their country’s manufacturing peak. In the pre-peak decades, cities with and without better-educated workforces experienced similar rates of employment growth. During deindustrialization, however, cities in the top quartile by educational attainment experienced employment growth while those in the other quartiles experienced progressively greater total employment declines. A 1 percentage point increase in the share of college-educated workers correlated with a 3 percentage point increase in employment growth per decade.
— Leonardo Vasquez
The researchers acknowledge financial support from the UK Department for Business, Energy and Industrial Strategy and from the Clausen Center for International Business and Policy.


