Tracking the Cost of Complying with Government Regulation
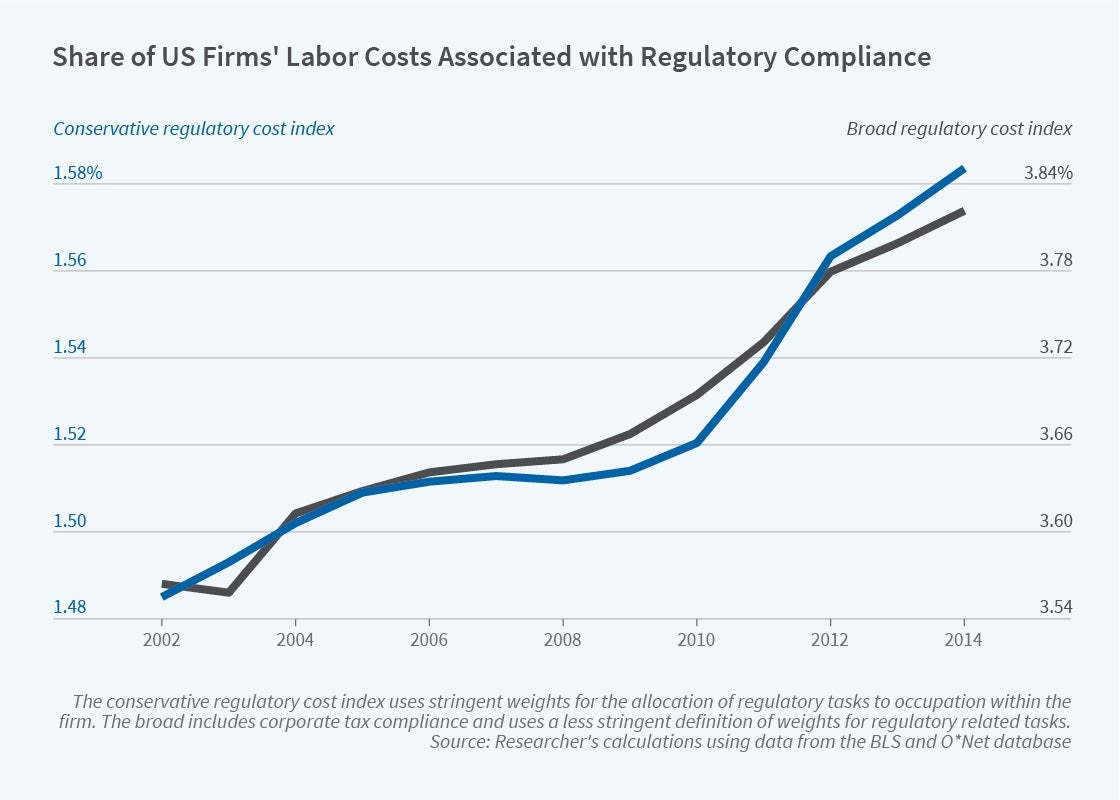
The average US firm spends between 1.3 and 3.3 percent of its total wage bill on regulatory compliance, estimate Francesco Trebbi and Miao Ben Zhang in The Cost of Regulatory Compliance in the United States (NBER Working Paper 30691). This wage bill grew at an annual rate of about 1 percent a year from 2002 to 2014, roughly half of the average annual GDP growth rate over the period. In 2014, the total wage bill devoted to regulatory compliance workers ranged from a conservative estimate of $78.7 billion and a broadly based estimate of $239 billion.
The researchers construct their estimates by measuring the regulation relatedness of each of the 19,636 labor tasks included in the US Department of Labor Employment and Training Administration’s O*NET system, a database that describes occupations in terms of their required day-to-day knowledge, skills, tasks, and work activities. They then aggregate each occupation’s regulation relatedness, weighted by spending on each occupation, for each of the 400,000 firms surveyed each year by the Occupational Employment and Wage Statistics survey, a stratified Bureau of Labor Statistics survey of all US industries.
The total wage bill for firms’ regulatory compliance work grew at an annual
rate of about 1 percent a year from 2002 to 2014.
Industry categories with greater than average regulatory expenses include transit and ground transportation at 3.9 percent of labor spending; financial services involving funds, trusts, and other investment vehicles at 3.3 percent; chemical manufacturing at 2.3 percent; and rail transportation and waste management and remediation services, both at 2.2 percent. The researchers focus only on the labor cost of regulatory compliance, omitting capital expenditure costs, lost profits created by compliance risk, and outsourced compliance costs such as accounting services. Labor costs as a share of total regulatory compliance costs, as reported by trade associations, vary from 93.9 percent for the securities industry to 68.4 percent for manufacturing.
Labor costs of performing regulation-related tasks have an inverted U-shape with respect to firm size, increasing until a firm employs about 500 people and decreasing thereafter. Though the average firm in the sample spent between 1.3 and 3.3 percent of total labor costs on regulation-related tasks each year, some firms spent close to nothing, others more than 10 percent. The researchers conjecture that the heavier burden on middle-sized firms may affect the size distribution of US firms.
The researchers analyze how their estimated labor costs varied around several high-profile regulatory changes. For example, they study the deregulation of the US oil and gas industry by the Energy Policy Act of 2005, and its subsequent re-regulation by executive order after the 2010 BP Deepwater Horizon oil spill. Their estimate of oil and gas industry compliance costs tracks those of a group of other industries, their control group, closely until 2005, after which it falls sharply. After 2010, compliance costs began rising again.
The researchers found some evidence that state as well as federal policies affect regulatory labor costs. Their state-level estimates of the wage bill for compliance workers, adjusted for the industrial composition of businesses in the state, were negatively correlated with measures of each state’s political inclination to vote for the Republican Party.
— Linda Gorman


