Banks That Relied on Branches, Not Remote Depositors, Fared Better in Recent Turmoil
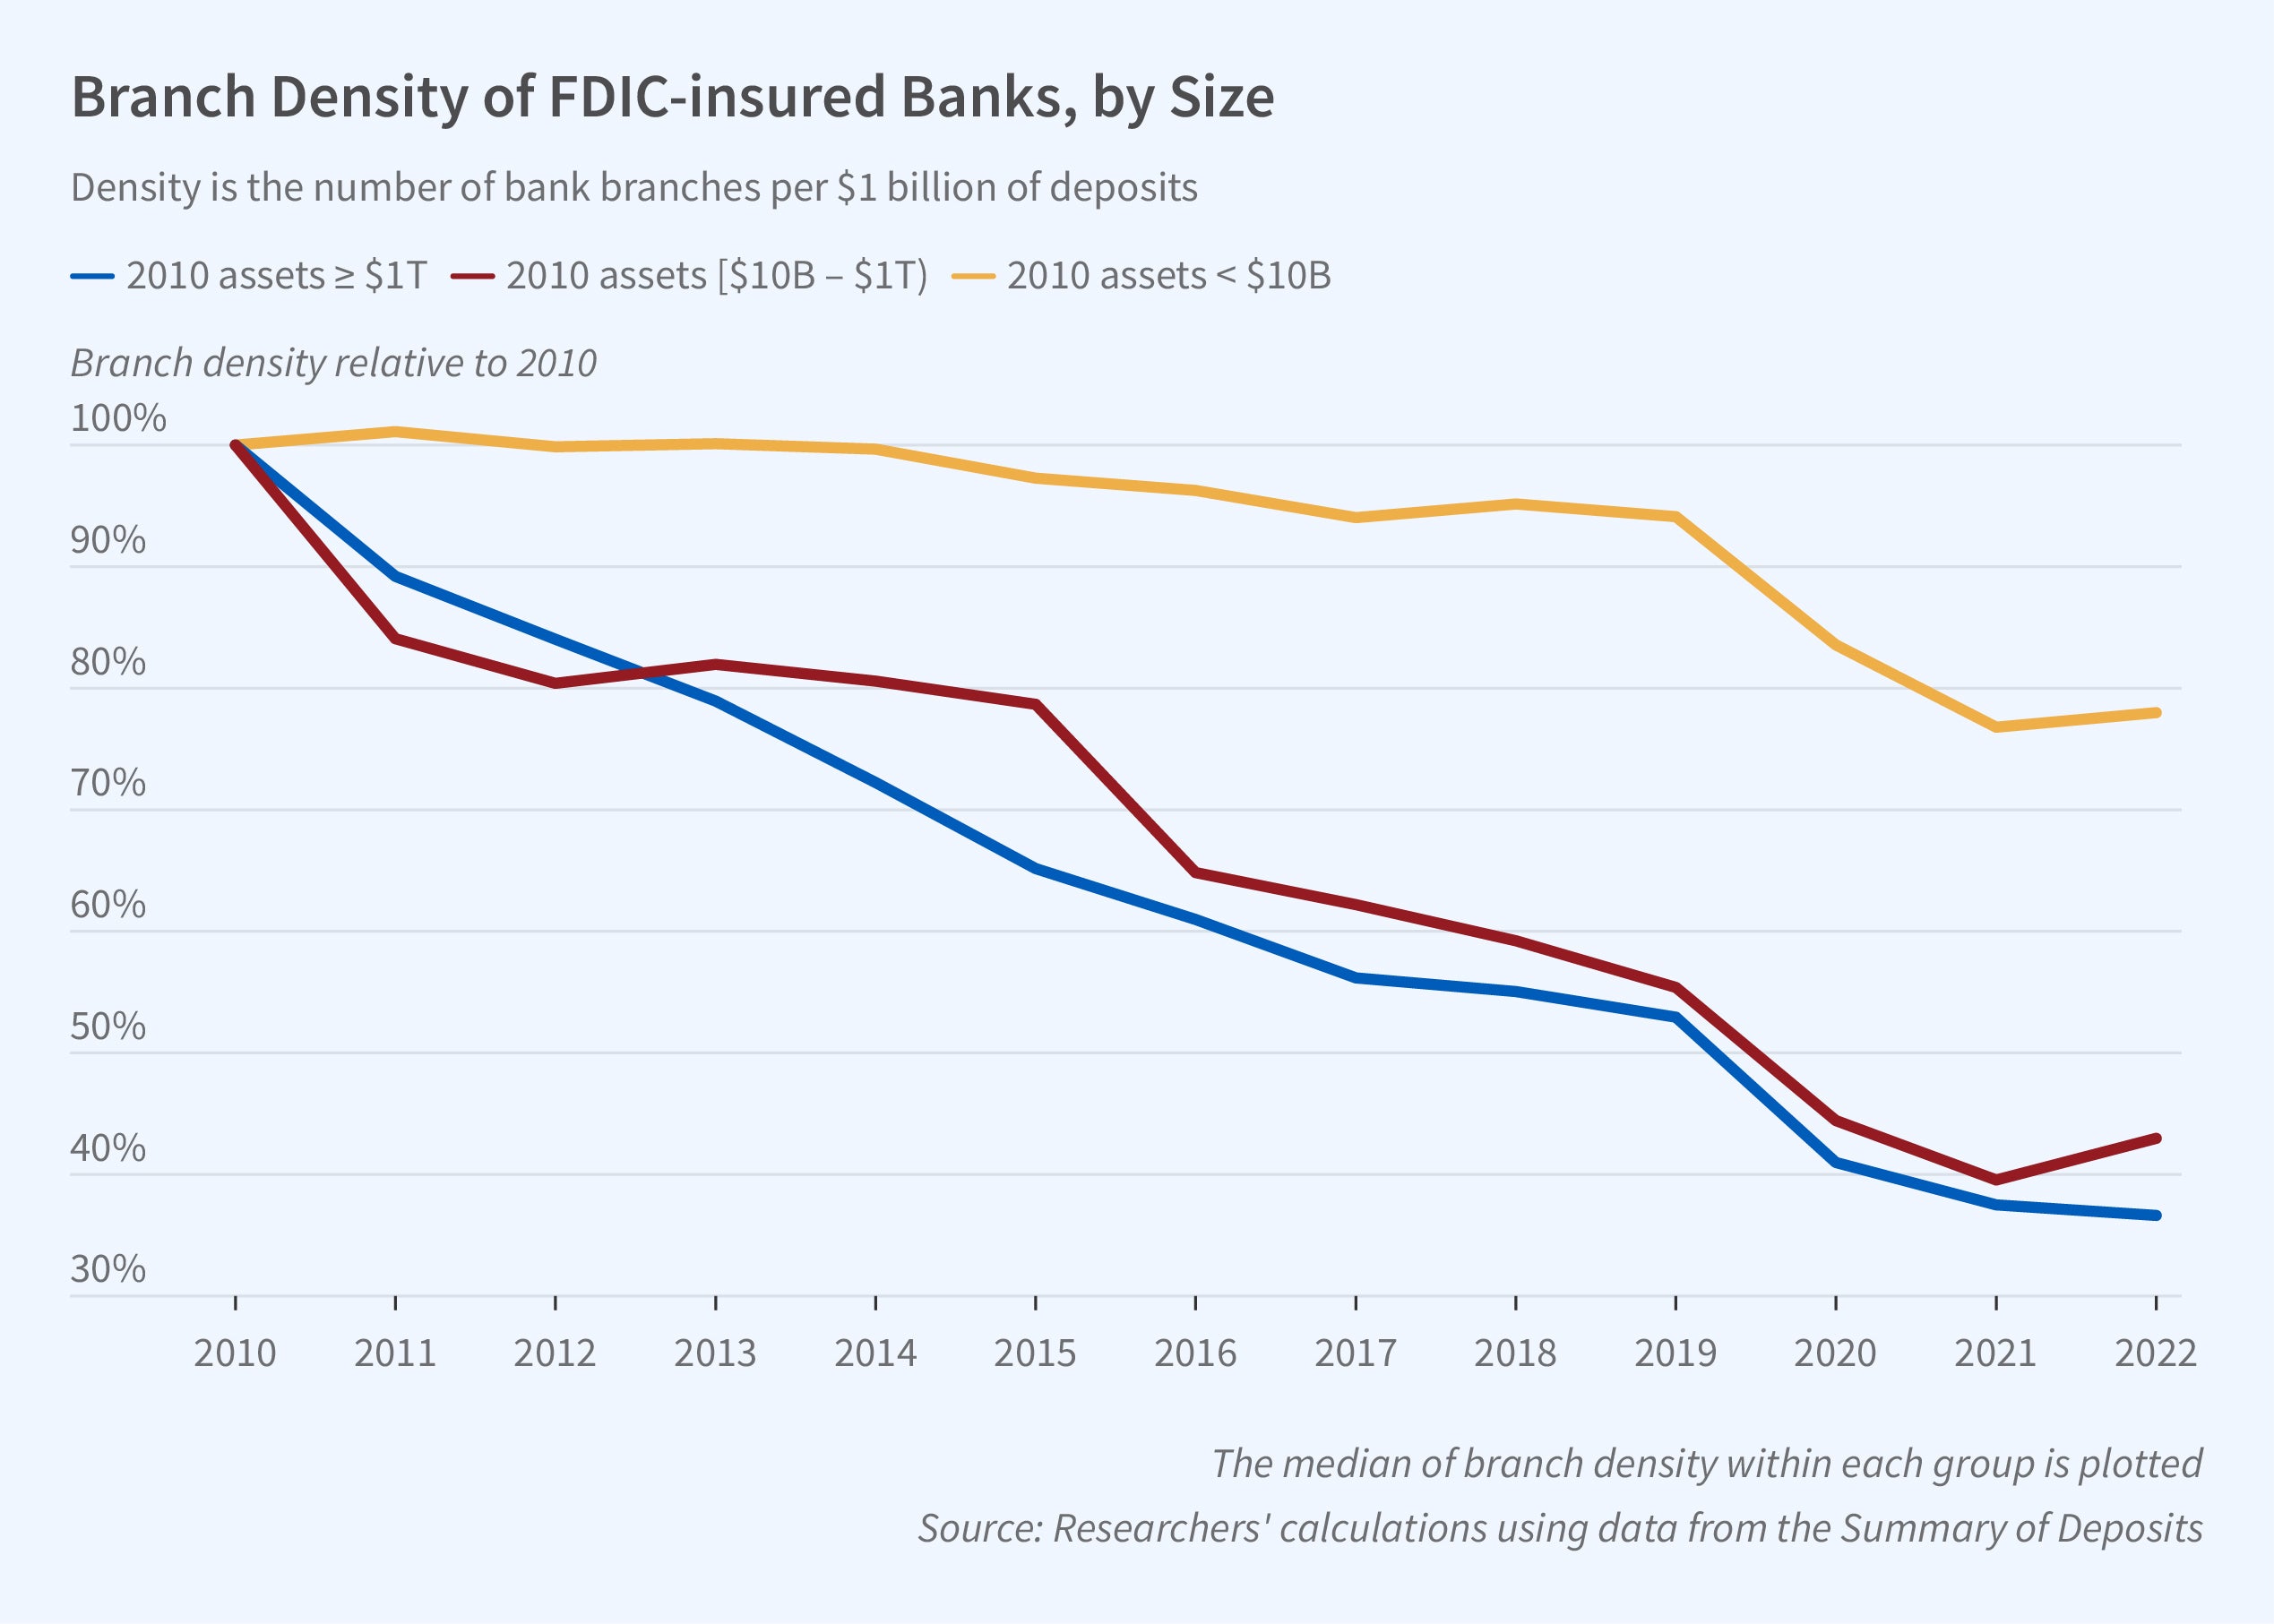
The number of bank branches in the United States declined from 99,550 in 2009 to 79,186 in 2022, while total deposits significantly increased. Overall branch density fell from 20 branches per $1 billion in deposits in 2010 to 9.2 branches per $1 billion in deposits in 2022.
In Bank Branch Density and Bank Runs (NBER Working Paper 31462), Efraim Benmelech, Jun Yang, and Michal Zator find that stock prices of banks with low branch density experienced larger declines around recent bank failures. They attribute these declines to a greater risk of large deposit outflows.
The Summary of Deposits provides deposit data for all FDIC-insured institutions. The researchers use it to aggregate the number of branches and deposits to the bank holding company level. They distinguish banks with very low branch density, at or below the 10th percentile; low density, between the 10th and 50th percentiles; and high density, above the 50th percentile. The growth rates of deposits between 2010 and 2019 were higher for the very low-density group (98 percent) than for the low-density group (32 percent) or the high-density group (19 percent).
Low values of branch density, the ratio of the number of bank branches to the bank’s total deposits, were negatively correlated with bank stock returns and positively correlated with outflows of uninsured deposits around Silicon Valley Bank’s collapse.
The researchers find that after controlling for bank size, deposits as a share of assets, the percentage of deposits that are insured, and estimates of mark-to-market losses, a 1 standard deviation decline in branch density, a drop of 5.8 branches per billion dollars in total deposits, was associated with 4 percent lower returns on the bank’s common stock around the time of the Silicon Valley Bank (SVB) collapse, and a 1.4 percent lower return around the First Republic Bank collapse. Furthermore, between Q4 2022 and Q1 2023, a 1 standard deviation lower branch density is associated with a 4.4 percent higher outflow of uninsured deposits.
The researchers posit that banks with lower branch density perform worse in episodes of distress because they attract depositors who access banking services via digital channels and have weaker relationships with banks. Digital services also tend to attract corporations that make large uninsured deposits and tech-savvy individuals who respond quickly to financial news. The researchers provide the following two pieces of evidence.
First, they demonstrate that increased investment in information technology (IT) is correlated with decreasing branch density and deposit flows. They categorize banks into those below the 50th percentile in IT investments, those between the 50th and 90th percentiles, and those at the 90th percentile or higher. From 2010 to 2019, deposits in banks with very high IT investments grew 105 percent compared with 59 percent and 27 percent for banks with high and low IT investments, respectively.
Second, traffic to bank websites was 15 percent higher during the collapse of SVB than in the prior six months. This increase was greater for banks with lower branch density. A 1 standard deviation lower branch density corresponded to a 29 percent increase in online traffic. Higher online traffic was also negatively associated with bank stock returns during the SVB and First Republic failures.
—Whitney Zhang


