Measuring Brexit’s Economic Toll on the United Kingdom
Nearly a decade has passed since British voters narrowly chose to leave the European Union in June 2016. The referendum's outcome set in motion a complex withdrawal process that did not conclude until 2023. During this period, businesses faced uncertainty about trade arrangements, regulatory frameworks, and labor mobility.
In The Economic Impact of Brexit (NBER Working Paper 34459), Nicholas Bloom, Philip Bunn, Paul Mizen, Pawel Smietanka, and Gregory Thwaites estimate that by 2025, the Brexit process had reduced UK GDP per capita by 6 to 8 percent, investment by 12 to 18 percent, employment by 3 to 4 percent, and productivity by 3 to 4 percent. These effects grew gradually over time.
The UK's 2016 decision to leave the EU lowered per capita GDP nine years later by more than 6 percent.
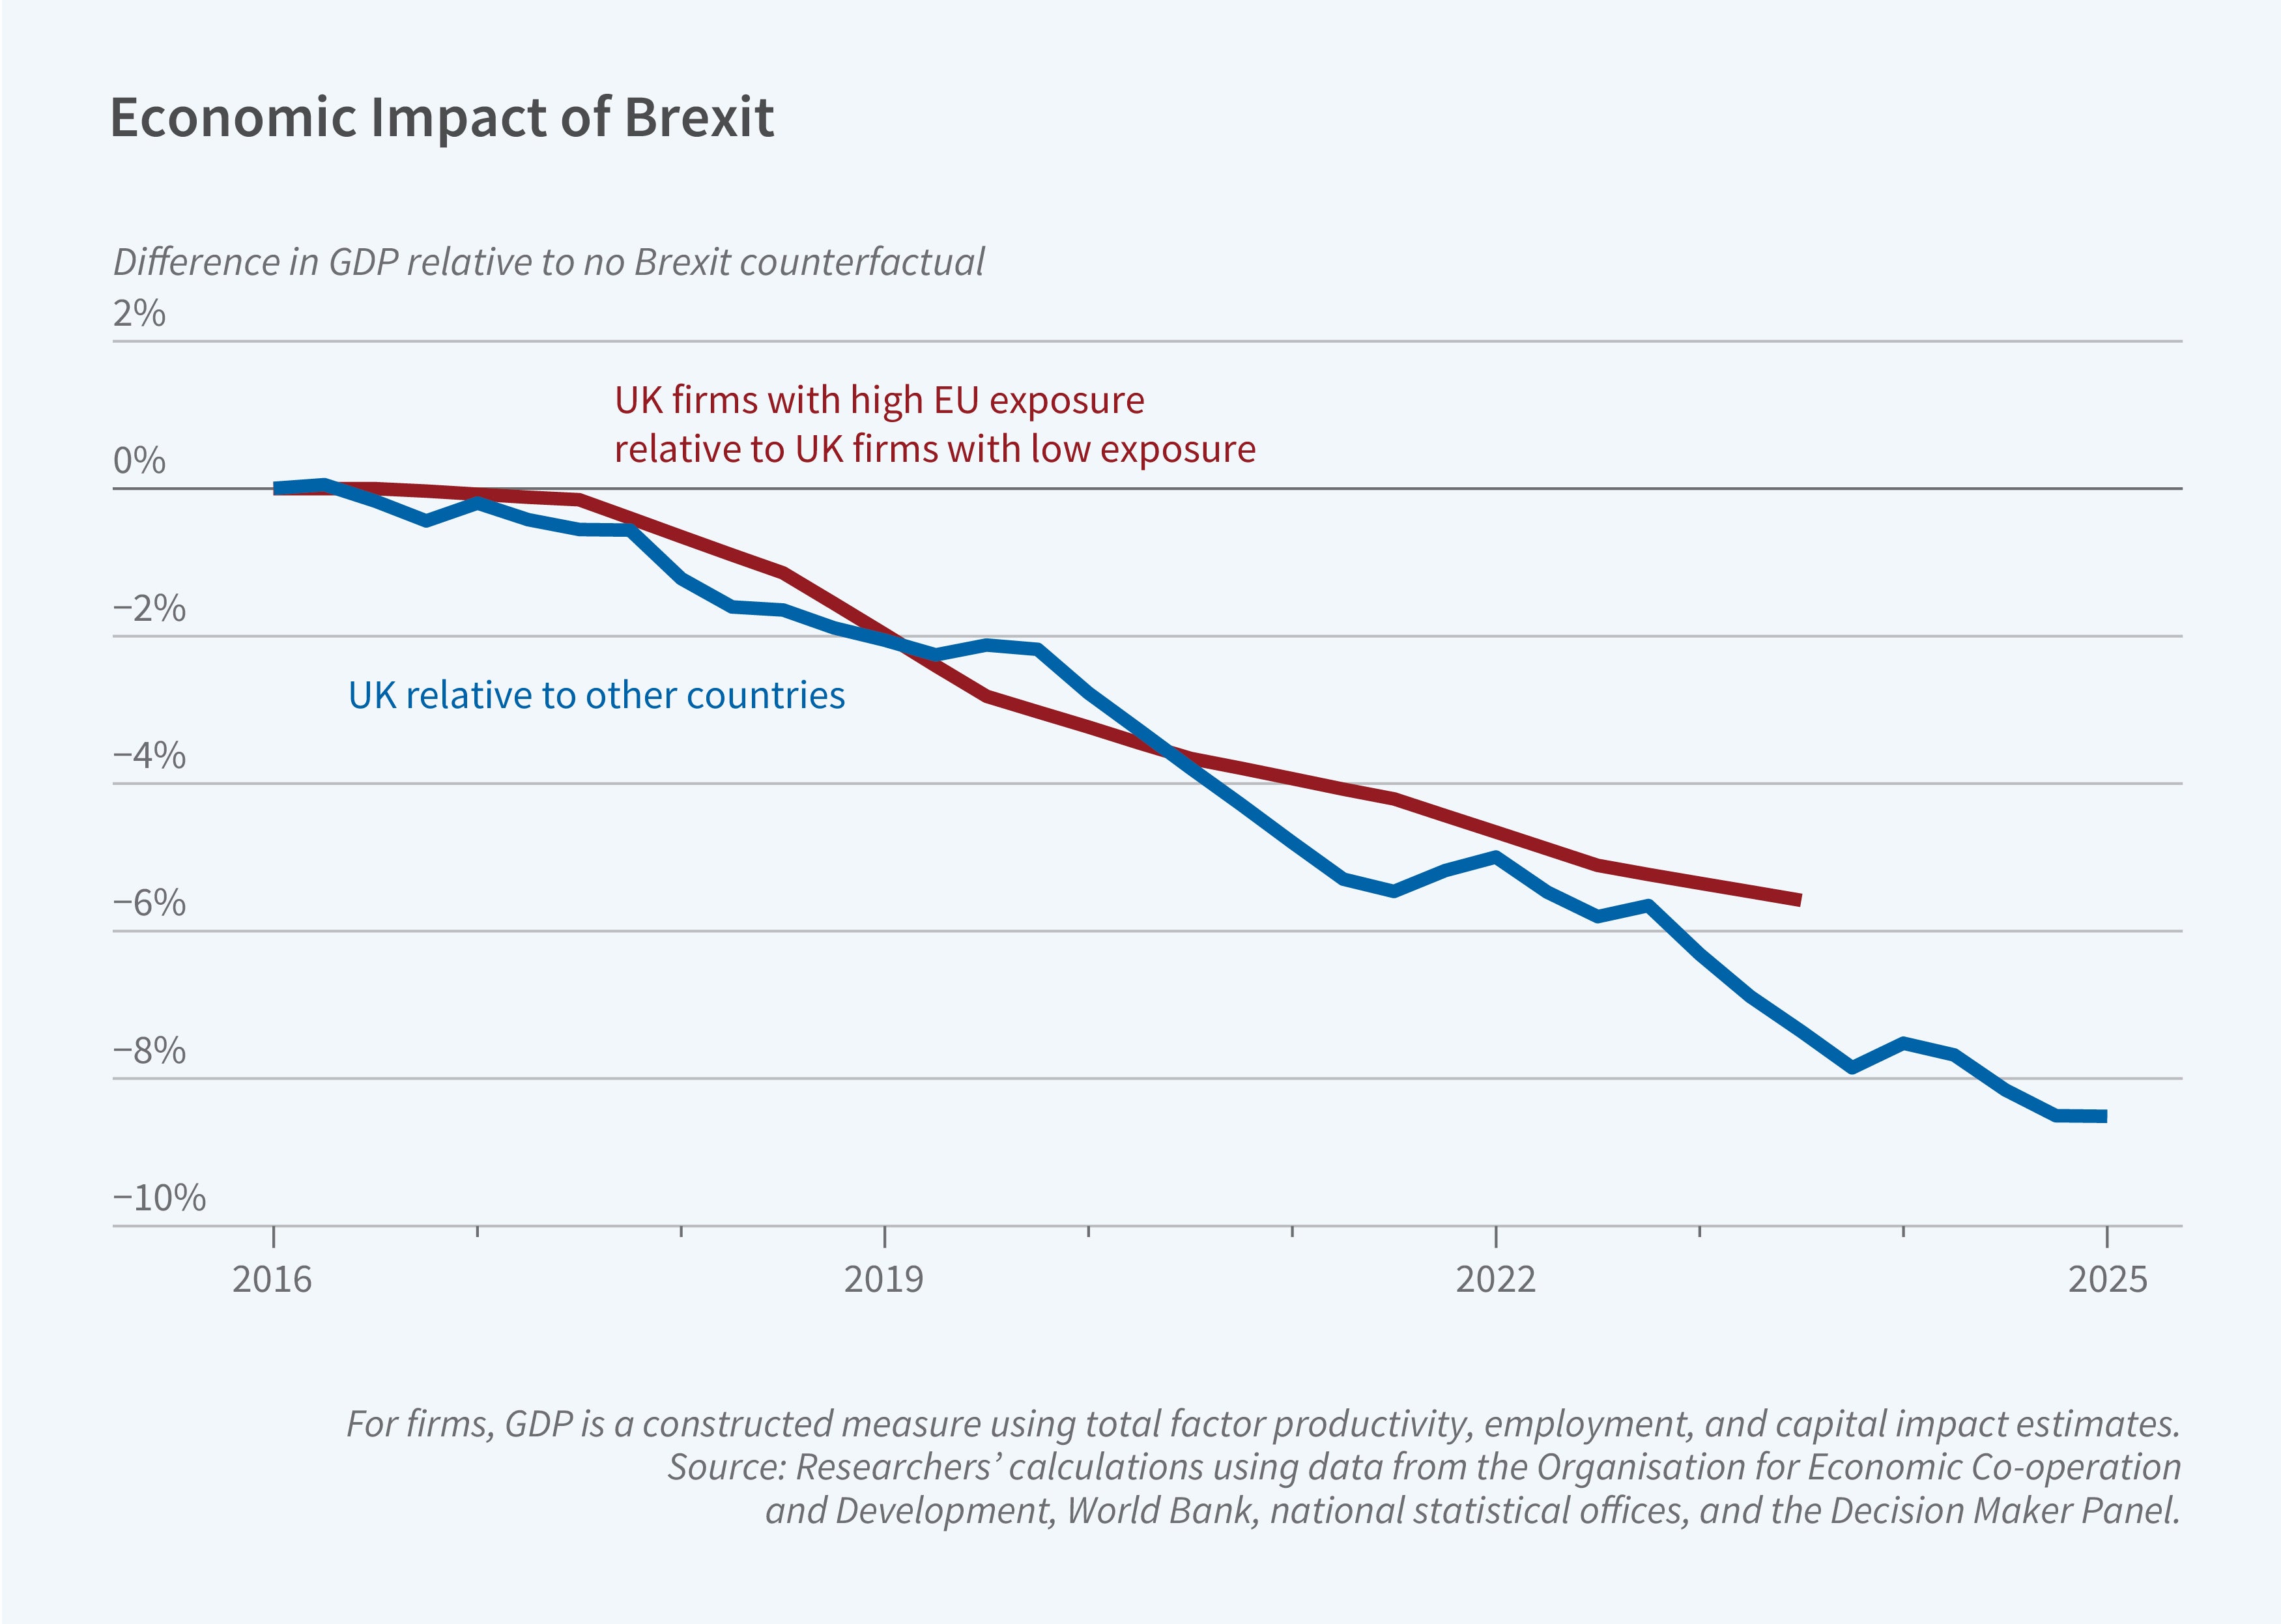
The researchers employ two complementary approaches to estimating the impact of Brexit: a macro-level analysis that compares UK economic performance after 2016 to an estimate of what the UK economy might have looked like in the absence of Brexit, based on the experience of 33 comparable countries, and a micro-level analysis that uses firm-level data from the Decision Maker Panel (DMP), a monthly survey of over 11,000 UK firms, with responses each month from 2,000–2,500 firms. The DMP covers approximately 10 percent of UK private sector employment.
The macro-based estimates of Brexit’s impact generally exceed the micro estimates, which are based on comparisons across firms with different degrees of EU exposure. The former suggest that GDP per capita was 8 percent lower in 2025 than it would have been without Brexit. The micro approach suggests a 6 percent decline. For business investment, the gap is larger: 18 percent versus 12 percent. The estimates for employment and productivity are more aligned, at between 3 and 4 percent for both approaches.
Four main channels explain these effects. First, Brexit generated persistent uncertainty that weighed particularly heavily on investment. Survey data show that nearly 40 percent of firms rated Brexit as one of their three main sources of uncertainty immediately after the referendum, rising to 55 percent in 2019 before declining following the December 2019 election that cleared the path for the UK's formal exit.
Second, lower expected future demand for goods and services reduced investment and, especially, employment growth. Third, productivity within firms suffered from reduced innovation, lower IT investment, and management time diverted to Brexit preparation. Nearly 10 percent of CFOs reported spending six hours or more per week on Brexit planning between 2017 and 2020. Finally, productivity declined because more productive, internationally exposed firms were disproportionately affected, leading to adverse reallocation effects.
Studies conducted around the time of the 2016 referendum forecast an average GDP per capita impact of approximately -4 percent. The researchers' estimates for 2021, five years after the vote, closely match these predictions. However, the longer-term impact of 6 to 8 percent exceeds initial forecasts, possibly reflecting the unexpectedly protracted nature of the Brexit process, which created uncertainty lasting nearly five years, rather than resolving quickly.
The researchers acknowledge support from ESRC research grants ES/P010385/1, ES/X013707/1, and ES/V004387/1.


