Are There Predictable Errors in Investor Expectations?
The accuracy of investor expectations is fundamental to understanding how efficiently financial markets process information. While extensive research has documented deviations from rational expectations in survey data, quantifying the practical importance of these distortions requires a benchmark of objective beliefs against which subjective expectations can be compared. Without such a measure, it is difficult to assess the extent to which investors systematically misuse available information when forecasting stock returns and corporate earnings.
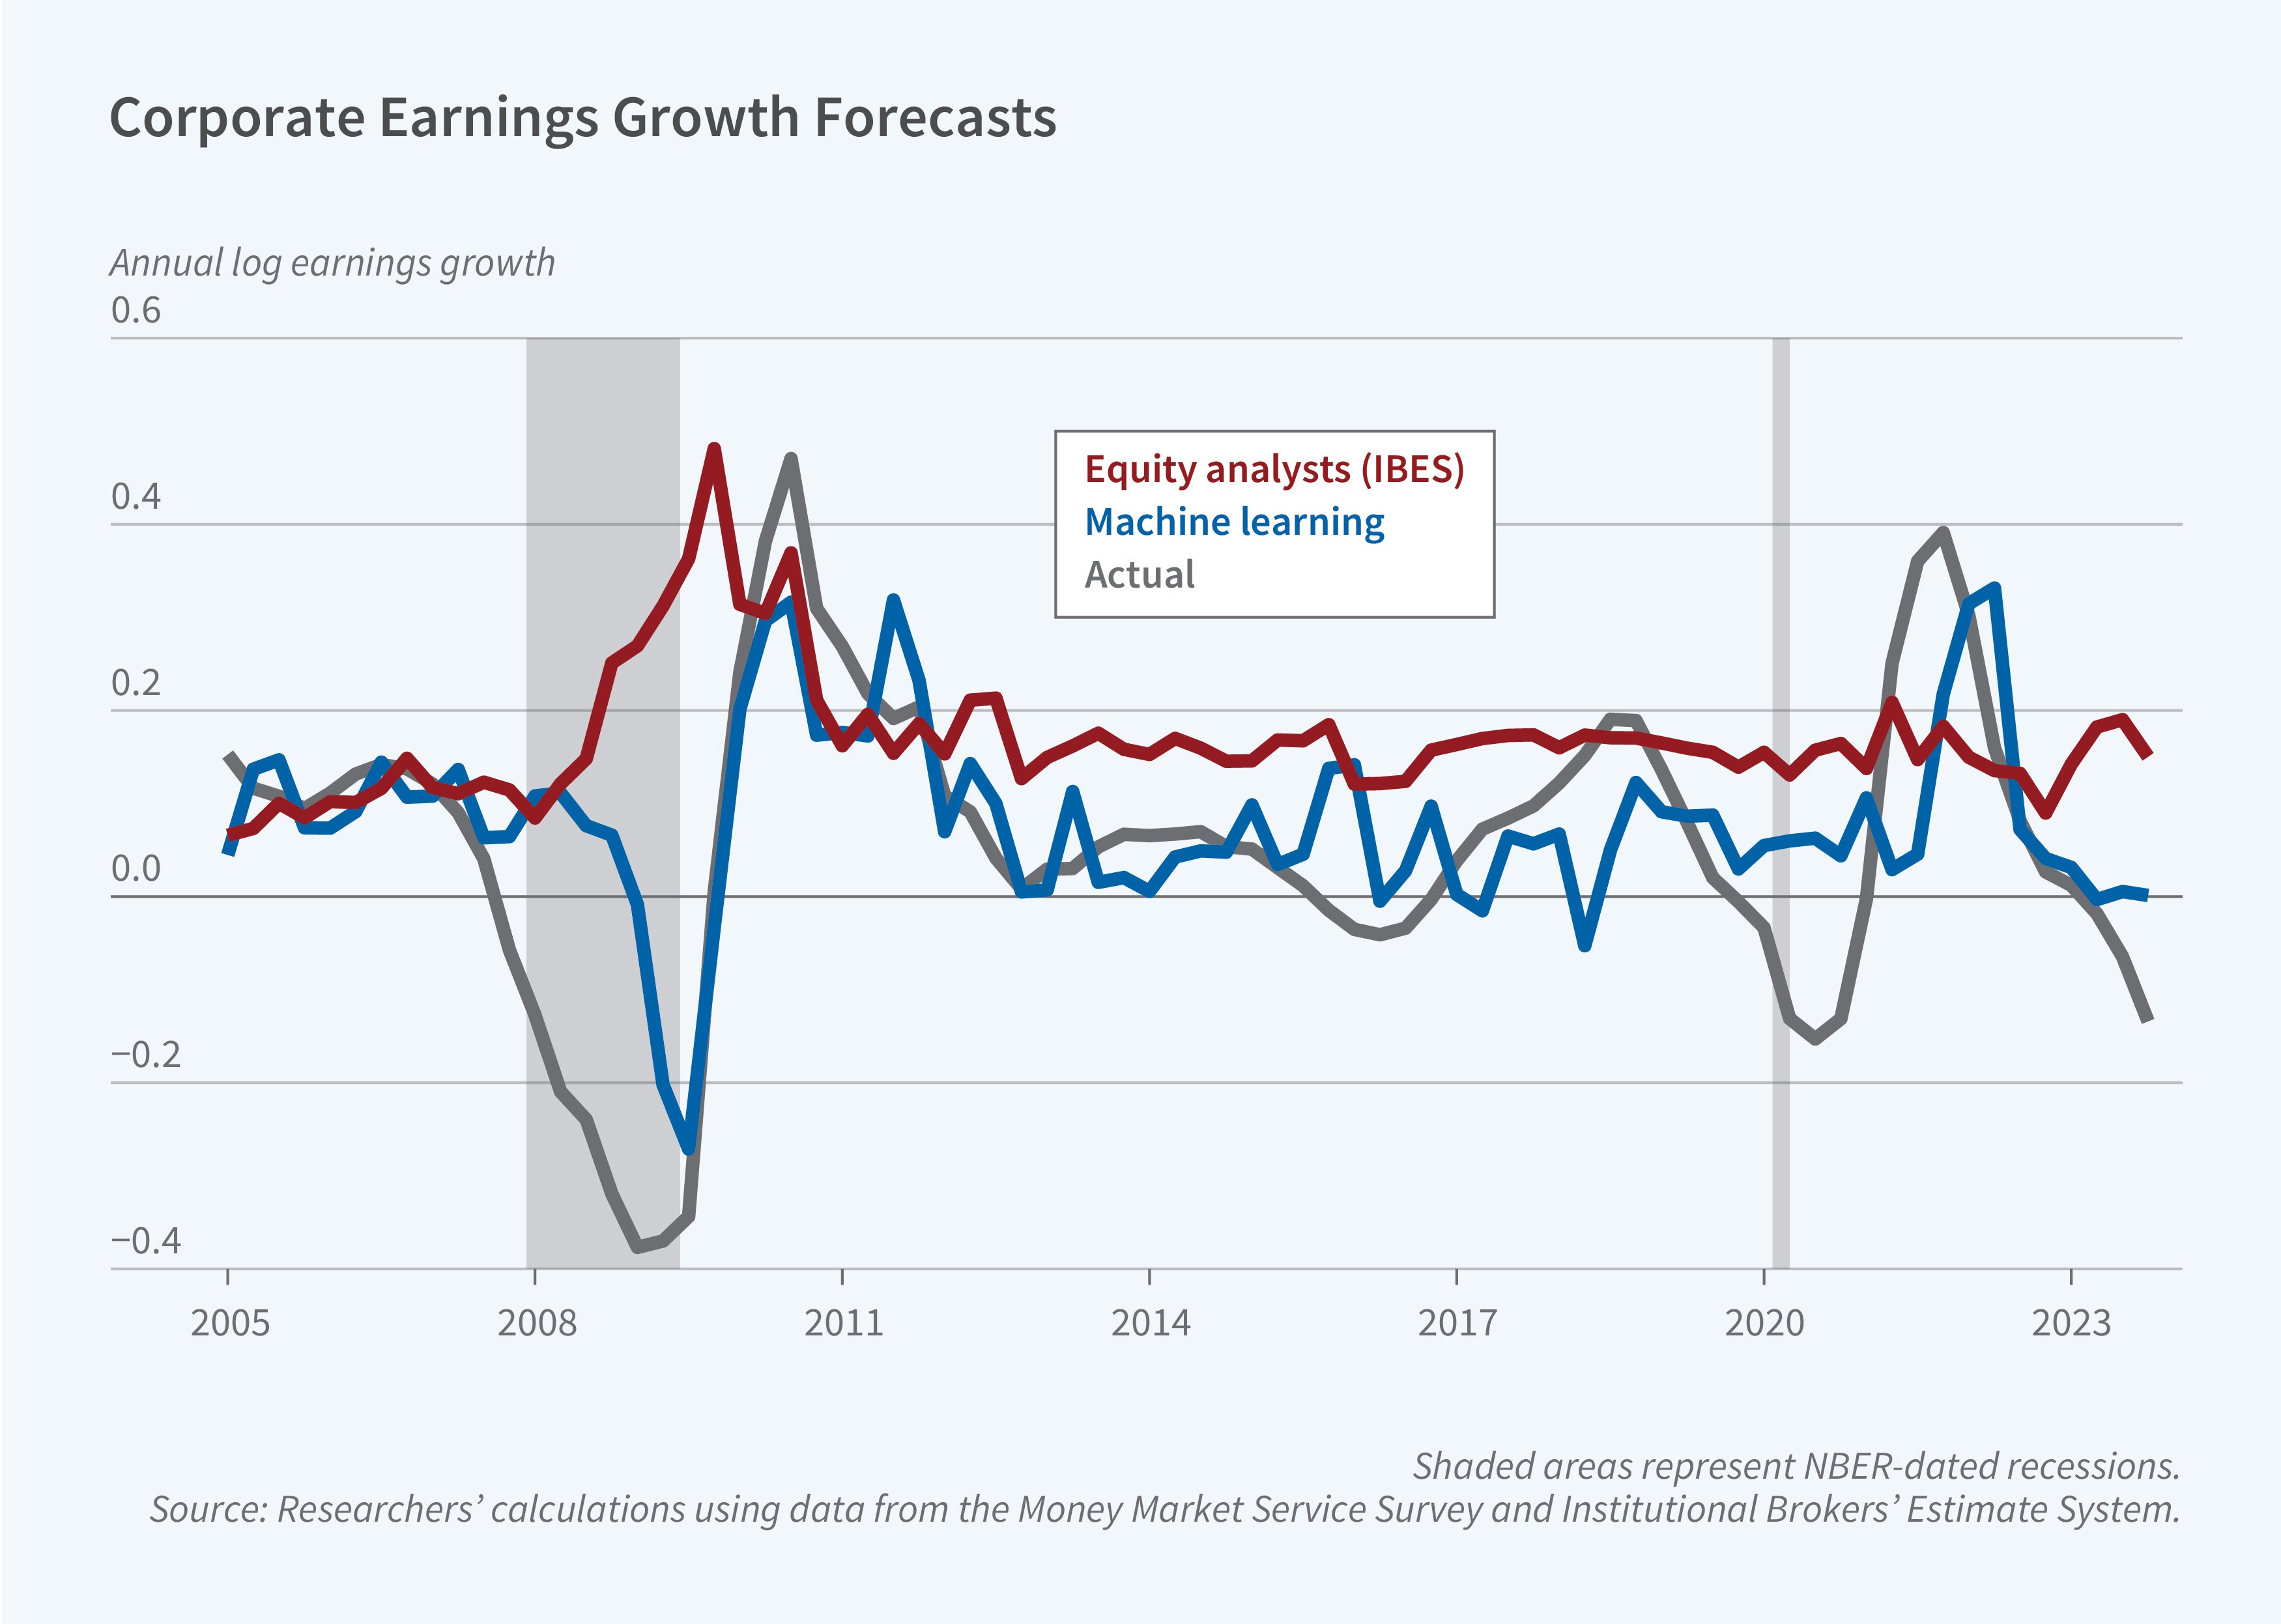
In The Prestakes of Stock Market Investing (NBER Working Paper 34420), Francesco Bianchi, Do Q. Lee, Sydney C. Ludvigson, and Sai Ma develop a machine learning framework to establish a benchmark and identify predictable mistakes, which they label "prestakes," in the expectations of market participants. The researchers train their machine model using historical data from 1970 to 2005 and then make real-time forecasts from 2005 through 2023. They restrict the model to using only information that actual investors could have obtained at each point in time.
Investors make predictable mistakes when forecasting earnings and stock returns, but machine learning models avoid them through adaptive learning.
The input data to the machine learning framework includes thousands of real-time economic time series, including 92 macroeconomic indicators, 147 financial market variables, consensus forecast surprises, Federal Reserve policy shocks, and text-based sentiment factors from approximately 1,000,000 Wall Street Journal articles. Crucially, the algorithm’s forecasts can differ from paired survey responses only when it can find demonstrable improvements in the survey response’s predictive accuracy during validation testing immediately prior to making each out-of-sample forecast.
For corporate earnings growth, the machine learning model’s forecasts are 63 percent more accurate than those of the median Institutional Brokers’ Estimate System equity analyst. For one-year stock returns, they are between 26 and 35 percent more predictive than forecasts from surveys of individual investors, CFOs, and professional forecasters. The machine learning forecasts were notably more accurate than those of survey respondents in predicting negative returns during both the 2008 financial crisis and the 2022 bear market.
The time-varying gap between forecasts from the machine learning model and surveys reveals when subjective beliefs systematically deviate from objective expectations. During the global financial crisis, survey forecasts of both earnings and returns were driven primarily by local means based on recent trends, exhibiting a form of recency bias. In contrast, the machine learning model drew on its longer-term memory, incorporating credit risk indicators, Treasury market variables, and Federal Reserve policy surprises that moved sharply before earnings declined. Survey respondents paid minimal attention to these early warning signals and showed little evidence of learning from past forecast errors.
The market returns predicted by the machine learning model are more sensitive to objective measures of market uncertainty than survey predictions are to investors' perceived risk measures. There is very little correlation between survey expectations and objective market uncertainty, which suggests that investor expectations are suboptimally responsive to evidence of changing market risk.
Trading strategies based on the machine learning forecasts generate substantial risk-adjusted returns. A long-only strategy that invests in the CRSP value-weighted index when model-based excess return forecasts are positive—and otherwise holds Treasury bills—would earn 4.6 percent per year more than a portfolio based on the Capital Asset Pricing Model. A long-short strategy that additionally shorts the market when raw return forecasts are negative produces an estimated risk-adjusted return of 9 percent per year. These gains are concentrated in periods of market turbulence. By comparison, strategies based on survey forecasts earn near-zero risk-adjusted returns because surveys rarely predict returns that fall below the Treasury bill rate, let alone stock market losses.
Sydney C. Ludvigson acknowledges support from the CV Starr Center for Applied Economics at NYU.


