Intergenerational Mobility in United States History
While social scientists have been studying the extent to which socioeconomic status is transmitted from one generation to the next for well over a century, the last decade has brought a surge of research on the topic within economics. This includes attempts to measure the strength of this transmission in the United States both in the present day and throughout the nation’s history. We believe there are at least two reasons for this.
First, there is a strong narrative among many Americans that the country is a “land of opportunity,” in which each person—through hard work—can build a better life than those who came before them. Especially in an era when inequality is increasing along many dimensions, it is critical to understand whether and for whom that opportunity exists, and what policies and institutions in our past have made the US a more or less mobile society.
Second, on a practical level, challenges with data and measurement have long made it difficult for researchers to produce convincing answers to even basic questions: Is mobility decreasing over time?1 Is the transmission of socioeconomic status stronger for sons than for daughters? Is status transmitted across multiple generations? However, recent innovations in record linking have opened new possibilities for rigorous analysis.
In this summary, we describe our own efforts (with collaborators) to enrich our understanding of socioeconomic mobility throughout US history. We begin with work to improve estimates of mobility for men by addressing measurement error and sample selection bias, made possible by new record links across historical US censuses. This includes the Census Tree—a set of over 700 million census-to-census links that we created by combining state-of-the-art linking methods with information from an online genealogy platform, FamilySearch. The Census Tree links have also facilitated our work to produce mobility estimates for women, alongside new measures of assortative mating. Finally, we describe our recent findings regarding the multigenerational transmission of status, the persistence of extreme wealth, and the transmission of health.
Correcting the Record for Men
For a long time, estimates of intergenerational transmission in the US were available only for White men, a group that made up roughly 45 percent of the population between 1850 and 1940. Women were excluded because the change of women’s surnames at marriage made it difficult to link them to their fathers. Even among men, linkage was difficult for Black men, many of whom were not recorded by name in the censuses before emancipation and who have been harder to link across the 1870–1940 censuses because enslavement left them with fewer unique surnames. Furthermore, most estimates relied on a single observation of the father’s status, which is a noisy measure of his long-run standing. That noise leads to attenuation bias, weakening the apparent link between father and son and making mobility appear greater than it was.
Fortunately, recent advances in methods for linking historical US censuses have yielded new datasets of sufficient size and quality to address these problems. The Census Linking Project was the first large-scale effort to link men across the 1850–1940 historical censuses by matching on stable characteristics like name, birth year, and birthplace.2 Buckles and Price, along with Jacob Van Leeuwen, Isaac Riley, Adrian Haws, and Haley Wilbert, built on this effort by incorporating links that FamilySearch users created and by using these links to train a machine learning algorithm.3,4 The resulting data resource, which we call the Census Tree, has 391 million links for men and is highly representative of the US population.
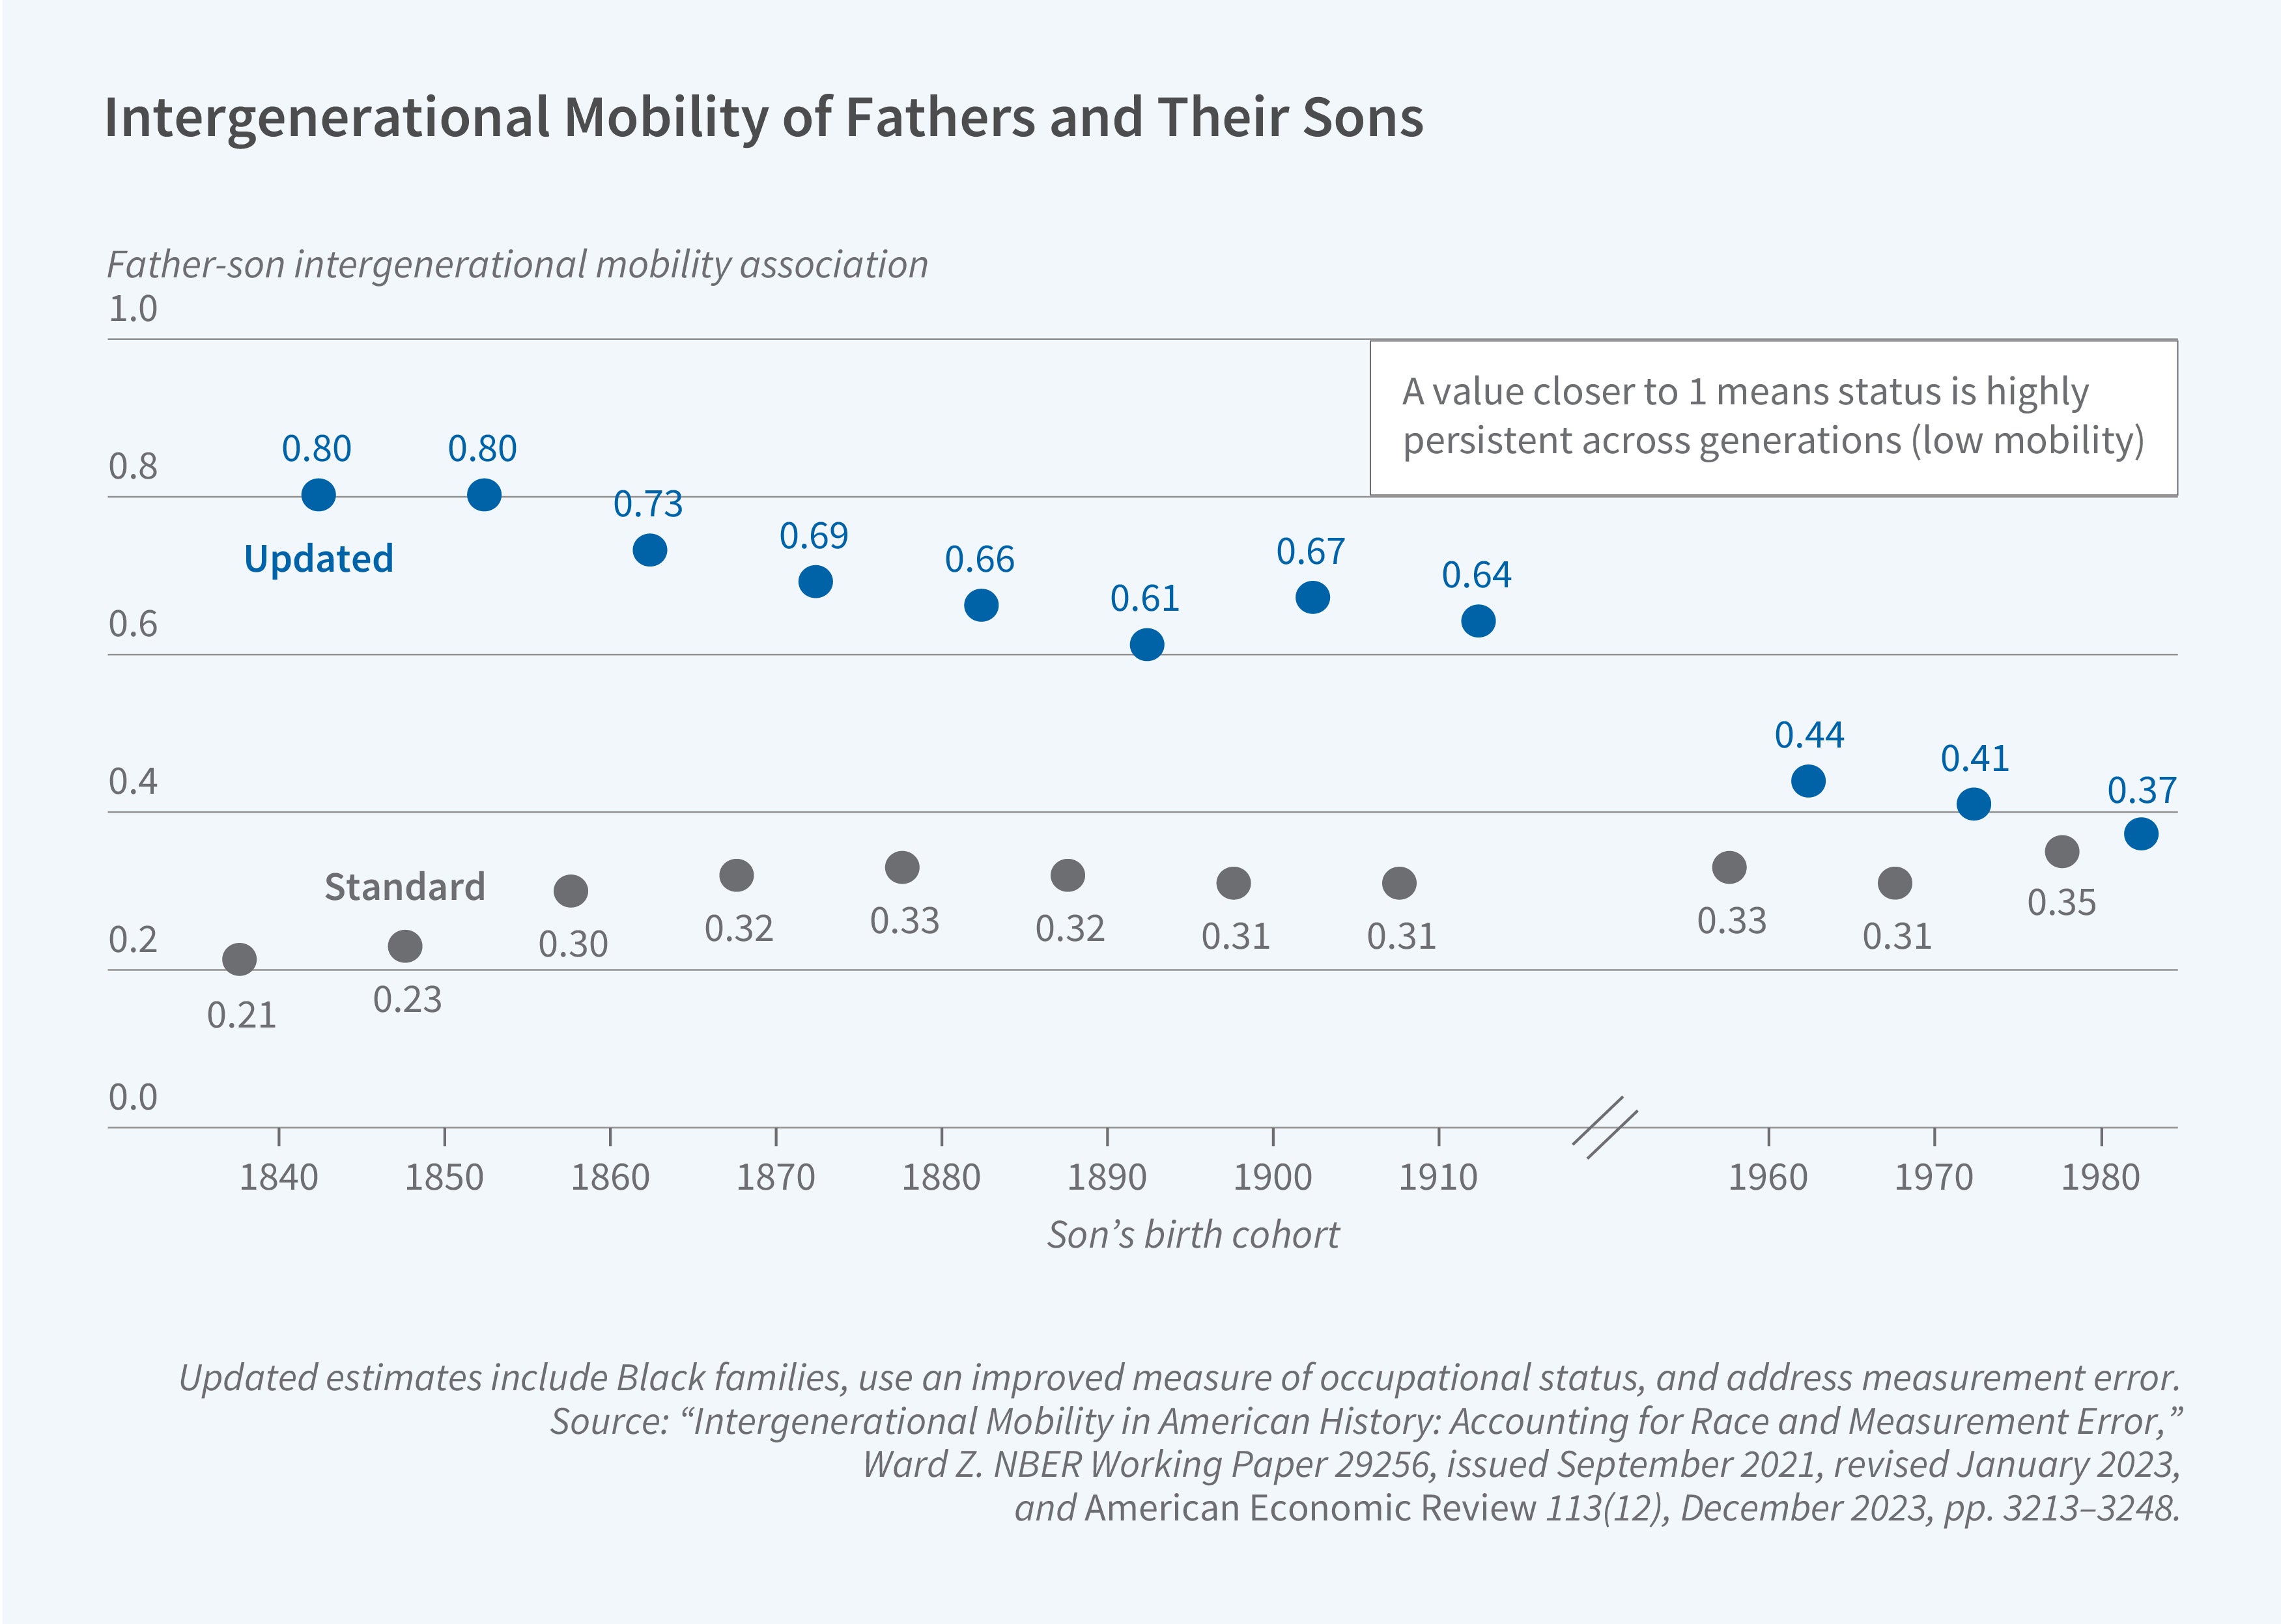
We use these links to create new estimates of the intergenerational transmission of socioeconomic status for men.5 First, we include Black men, rather than studying White men alone. Second, because multiple observations can now be obtained for the father, we can better pinpoint his long-run standing by averaging across observations or by using an instrumental variables (IV) strategy. Third, we refine how occupational status is measured, allowing men in the same occupation to differ in their status by race and region rather than treating them as identical. This matters because a given occupation carried very different economic status depending on where one lived and, under Jim Crow, on one’s race. In Figure 1, we show that these three changes make a big difference. Fathers and sons are far more tightly linked than previously thought, meaning that mobility in the past was substantially lower—overturning a long-held view that mobility was greater in the past.
New Mobility Estimates for Women
Important as these corrections are, they still measure the mobility of only half the population. In addition to providing the largest-ever set of links for men, the Census Tree was the first large-scale census-linking effort to include women. This breakthrough was possible because FamilySearch users often have private information, including maiden names, which help link married women to their fathers. As a result, the full Census Tree includes 314 million links for women.
With Wilbert, we use these links to create novel estimates of transmission from fathers to daughters as well as to sons.6 Another challenge when estimating historical socioeconomic mobility for women is that many do not report occupations. To address this, we create a new measure of socioeconomic status based on the average of the occupational status of one’s neighbors, which we call neighborhood-SES (n-SES). In addition to giving us a measure of status that does not rely on selection into either marriage or labor force participation, n-SES is a household measure that combines the resources of all family members.
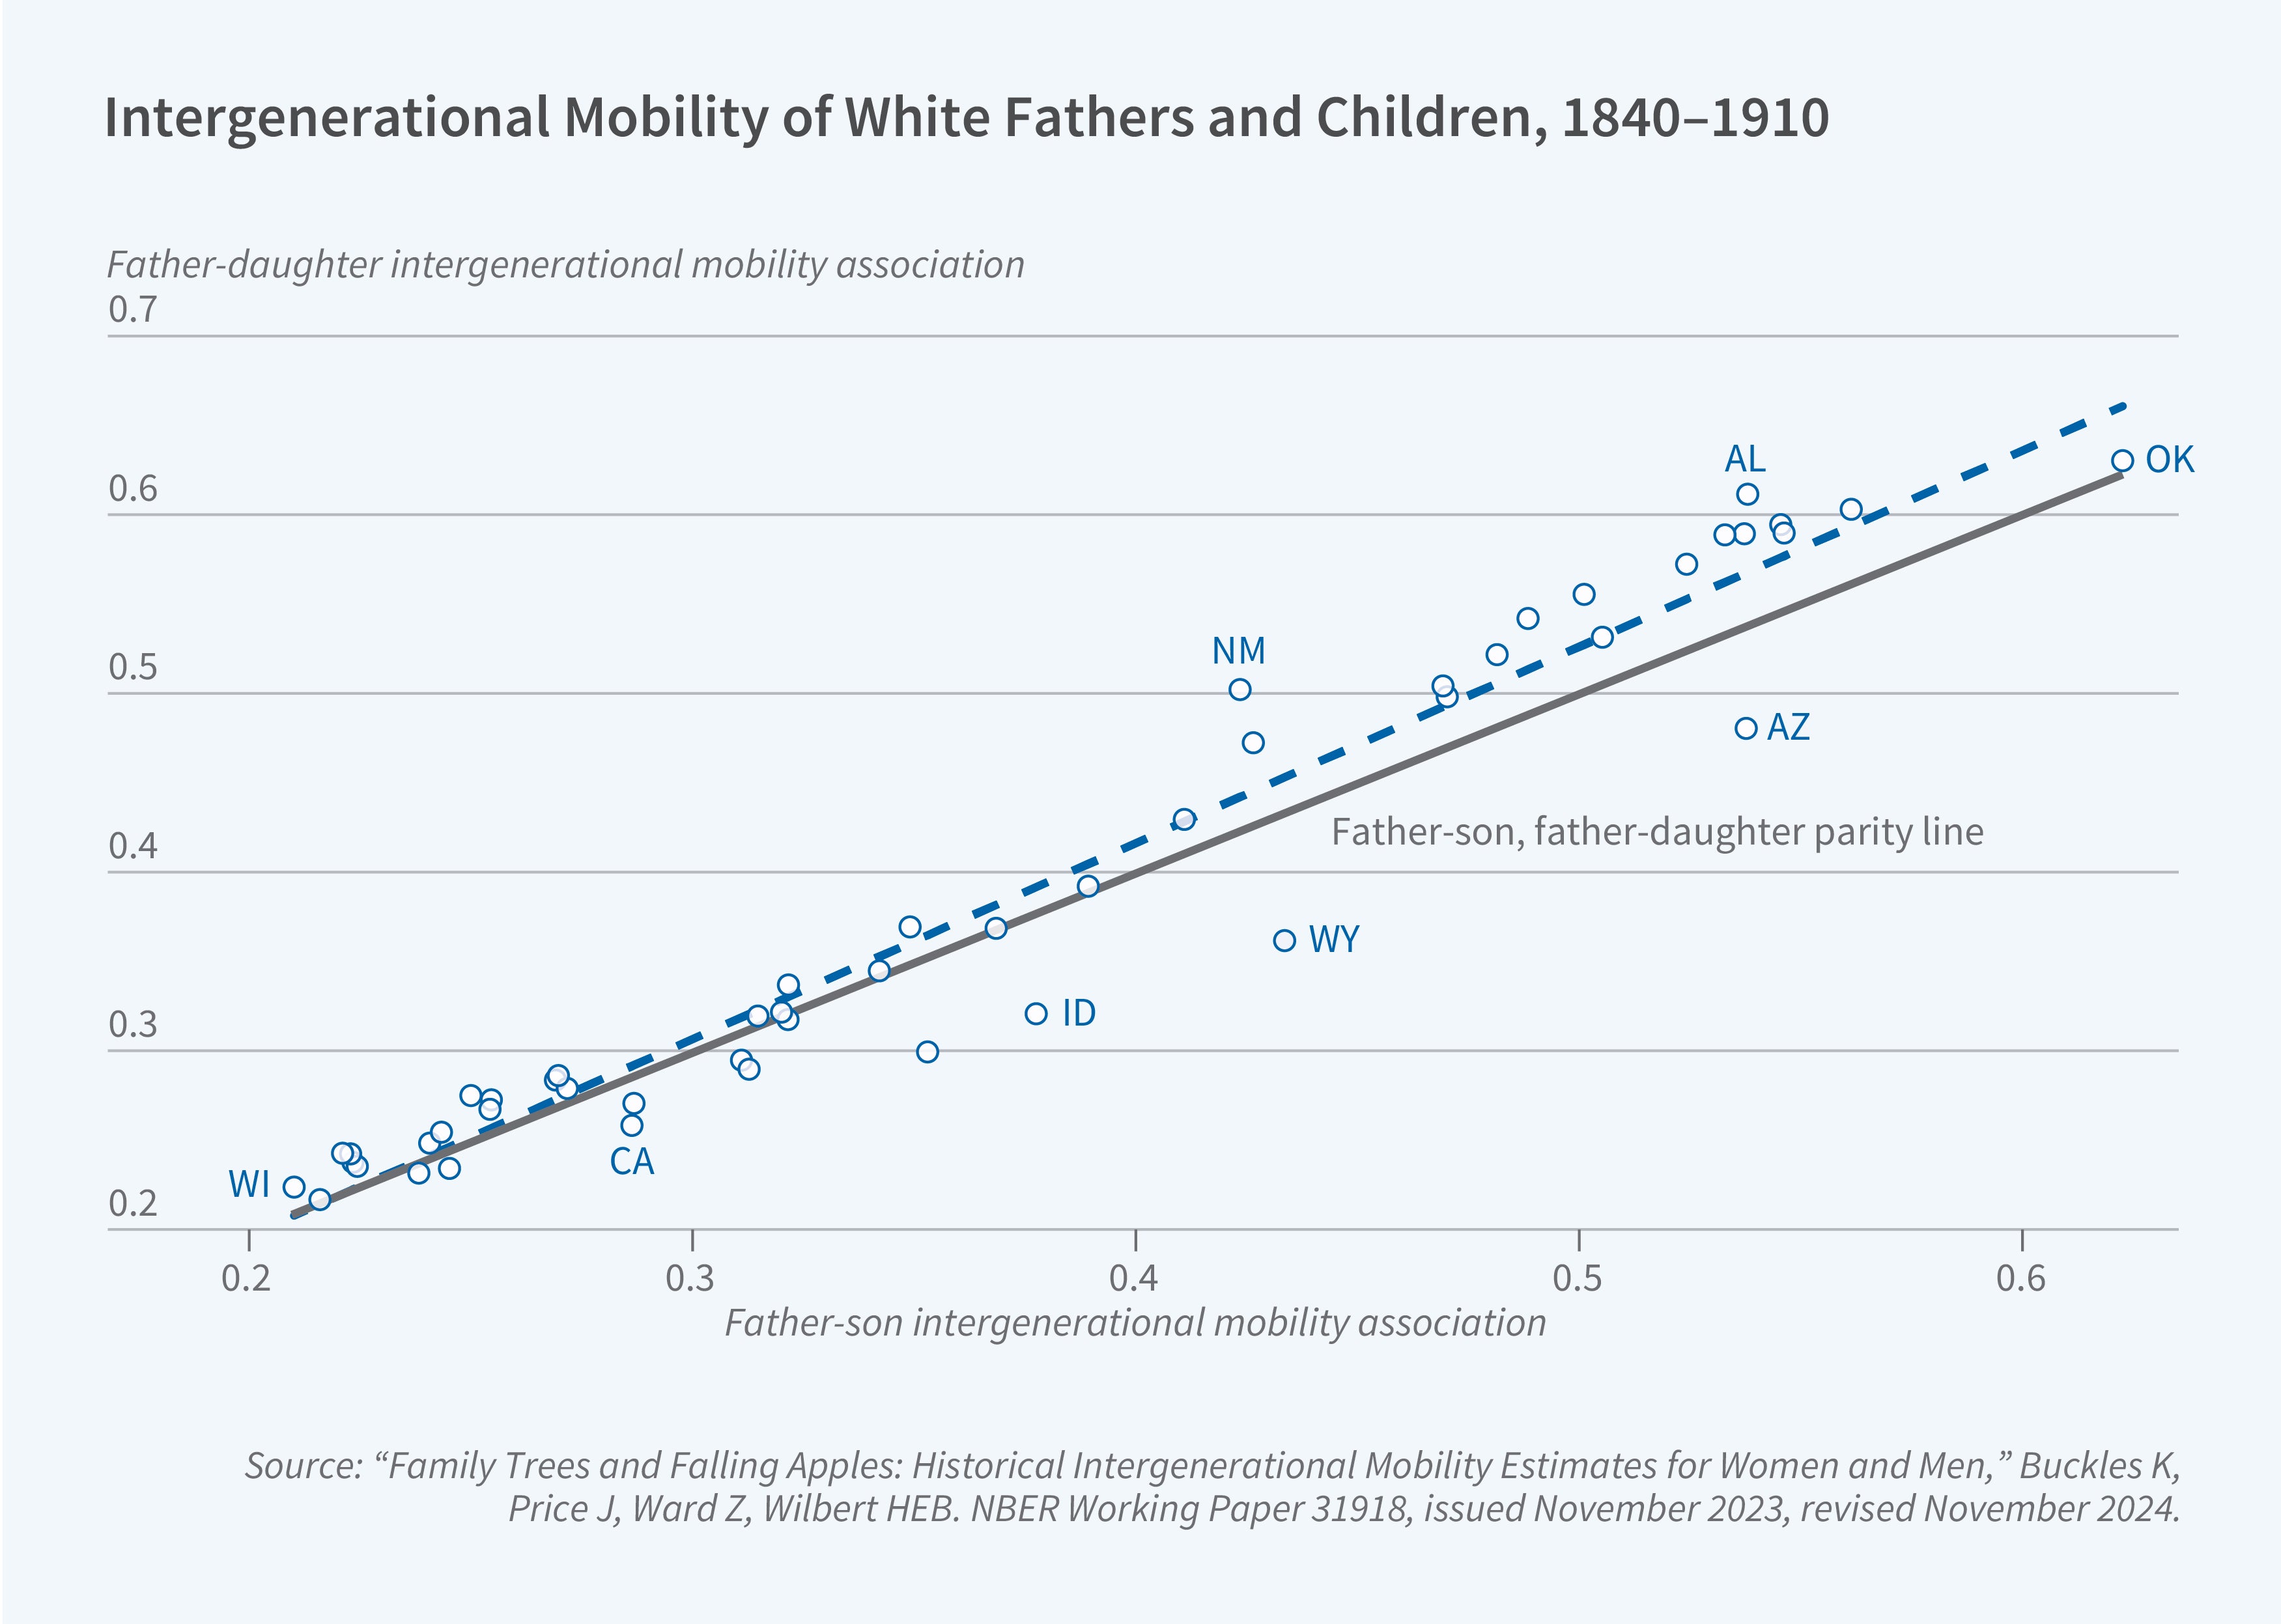
With these innovations, we show that socioeconomic mobility for daughters was remarkably similar to that of sons in the late nineteenth and early twentieth centuries. For both groups, mobility was low but increasing across the 1835–1915 birth cohorts. The similarity in the transmission coefficients for men and women persists when using different measures of status and for both OLS and IV estimates. It also holds within states, as Figure 2 shows. The correlation between the state-specific estimates for daughters and sons is very high at 0.974. This is true even though the state-specific estimates themselves range widely, suggesting that mobility estimates from a single state may not present a clear picture of mobility at the national level.
This similarity in estimates for sons and daughters was not a clear theoretical prediction and suggests strong assortative mating. Because the Census Tree also allows us to compare the occupational status of fathers and fathers-in-law, we can provide new national-level estimates of assortative mating that correct for measurement error. We find that assortative mating was much higher than many prior estimates suggest, ranging from a correlation coefficient for the fathers’ status of 0.75 for the 1840 birth cohort to 0.63 for the 1910 cohort.
Other Dimensions of Mobility
Strong transmission to both sons and daughters raises a further question: Did these advantages compound across multiple generations, so that great-grandparents remained more tightly linked to their descendants than the simple chain of parent-child links would predict? If so, mobility over the long run was even more limited than two-generation estimates suggest. This could happen either because of direct impacts from grandparents and great-grandparents, or because families carry advantages that are hard to observe in messy historical census data and pass them down beyond what any single parent-child link captures. Measuring multigenerational mobility has been difficult due to the lack of both intergenerational links and the repeated observations needed to correct the attenuation bias that affects two-generation estimates.
We address both problems, linking millions of great-grandchildren to their great-grandfathers in the Census Tree and again using multiple observations of each ancestor to correct for measurement error.7 We confirm that mobility was low both vertically and horizontally. Low vertical mobility means that there is a strong association between great-grandparents’ status and that of their great-grandchildren. We find evidence of low mobility horizontally in a strong correlation in education across second cousins—relatives who share only a great-grandparent and whose outcomes should be all but unrelated in a truly mobile society. Within Black and White groups separately, accounting for extended kin lowers mobility only slightly below what two-generation estimates imply, suggesting a small amount of excess persistence. Pooling groups for a national picture, however, shows that two-generation estimates substantially overstate long-run mobility because persistent racial inequality slows the rate at which families converge to the average across generations.
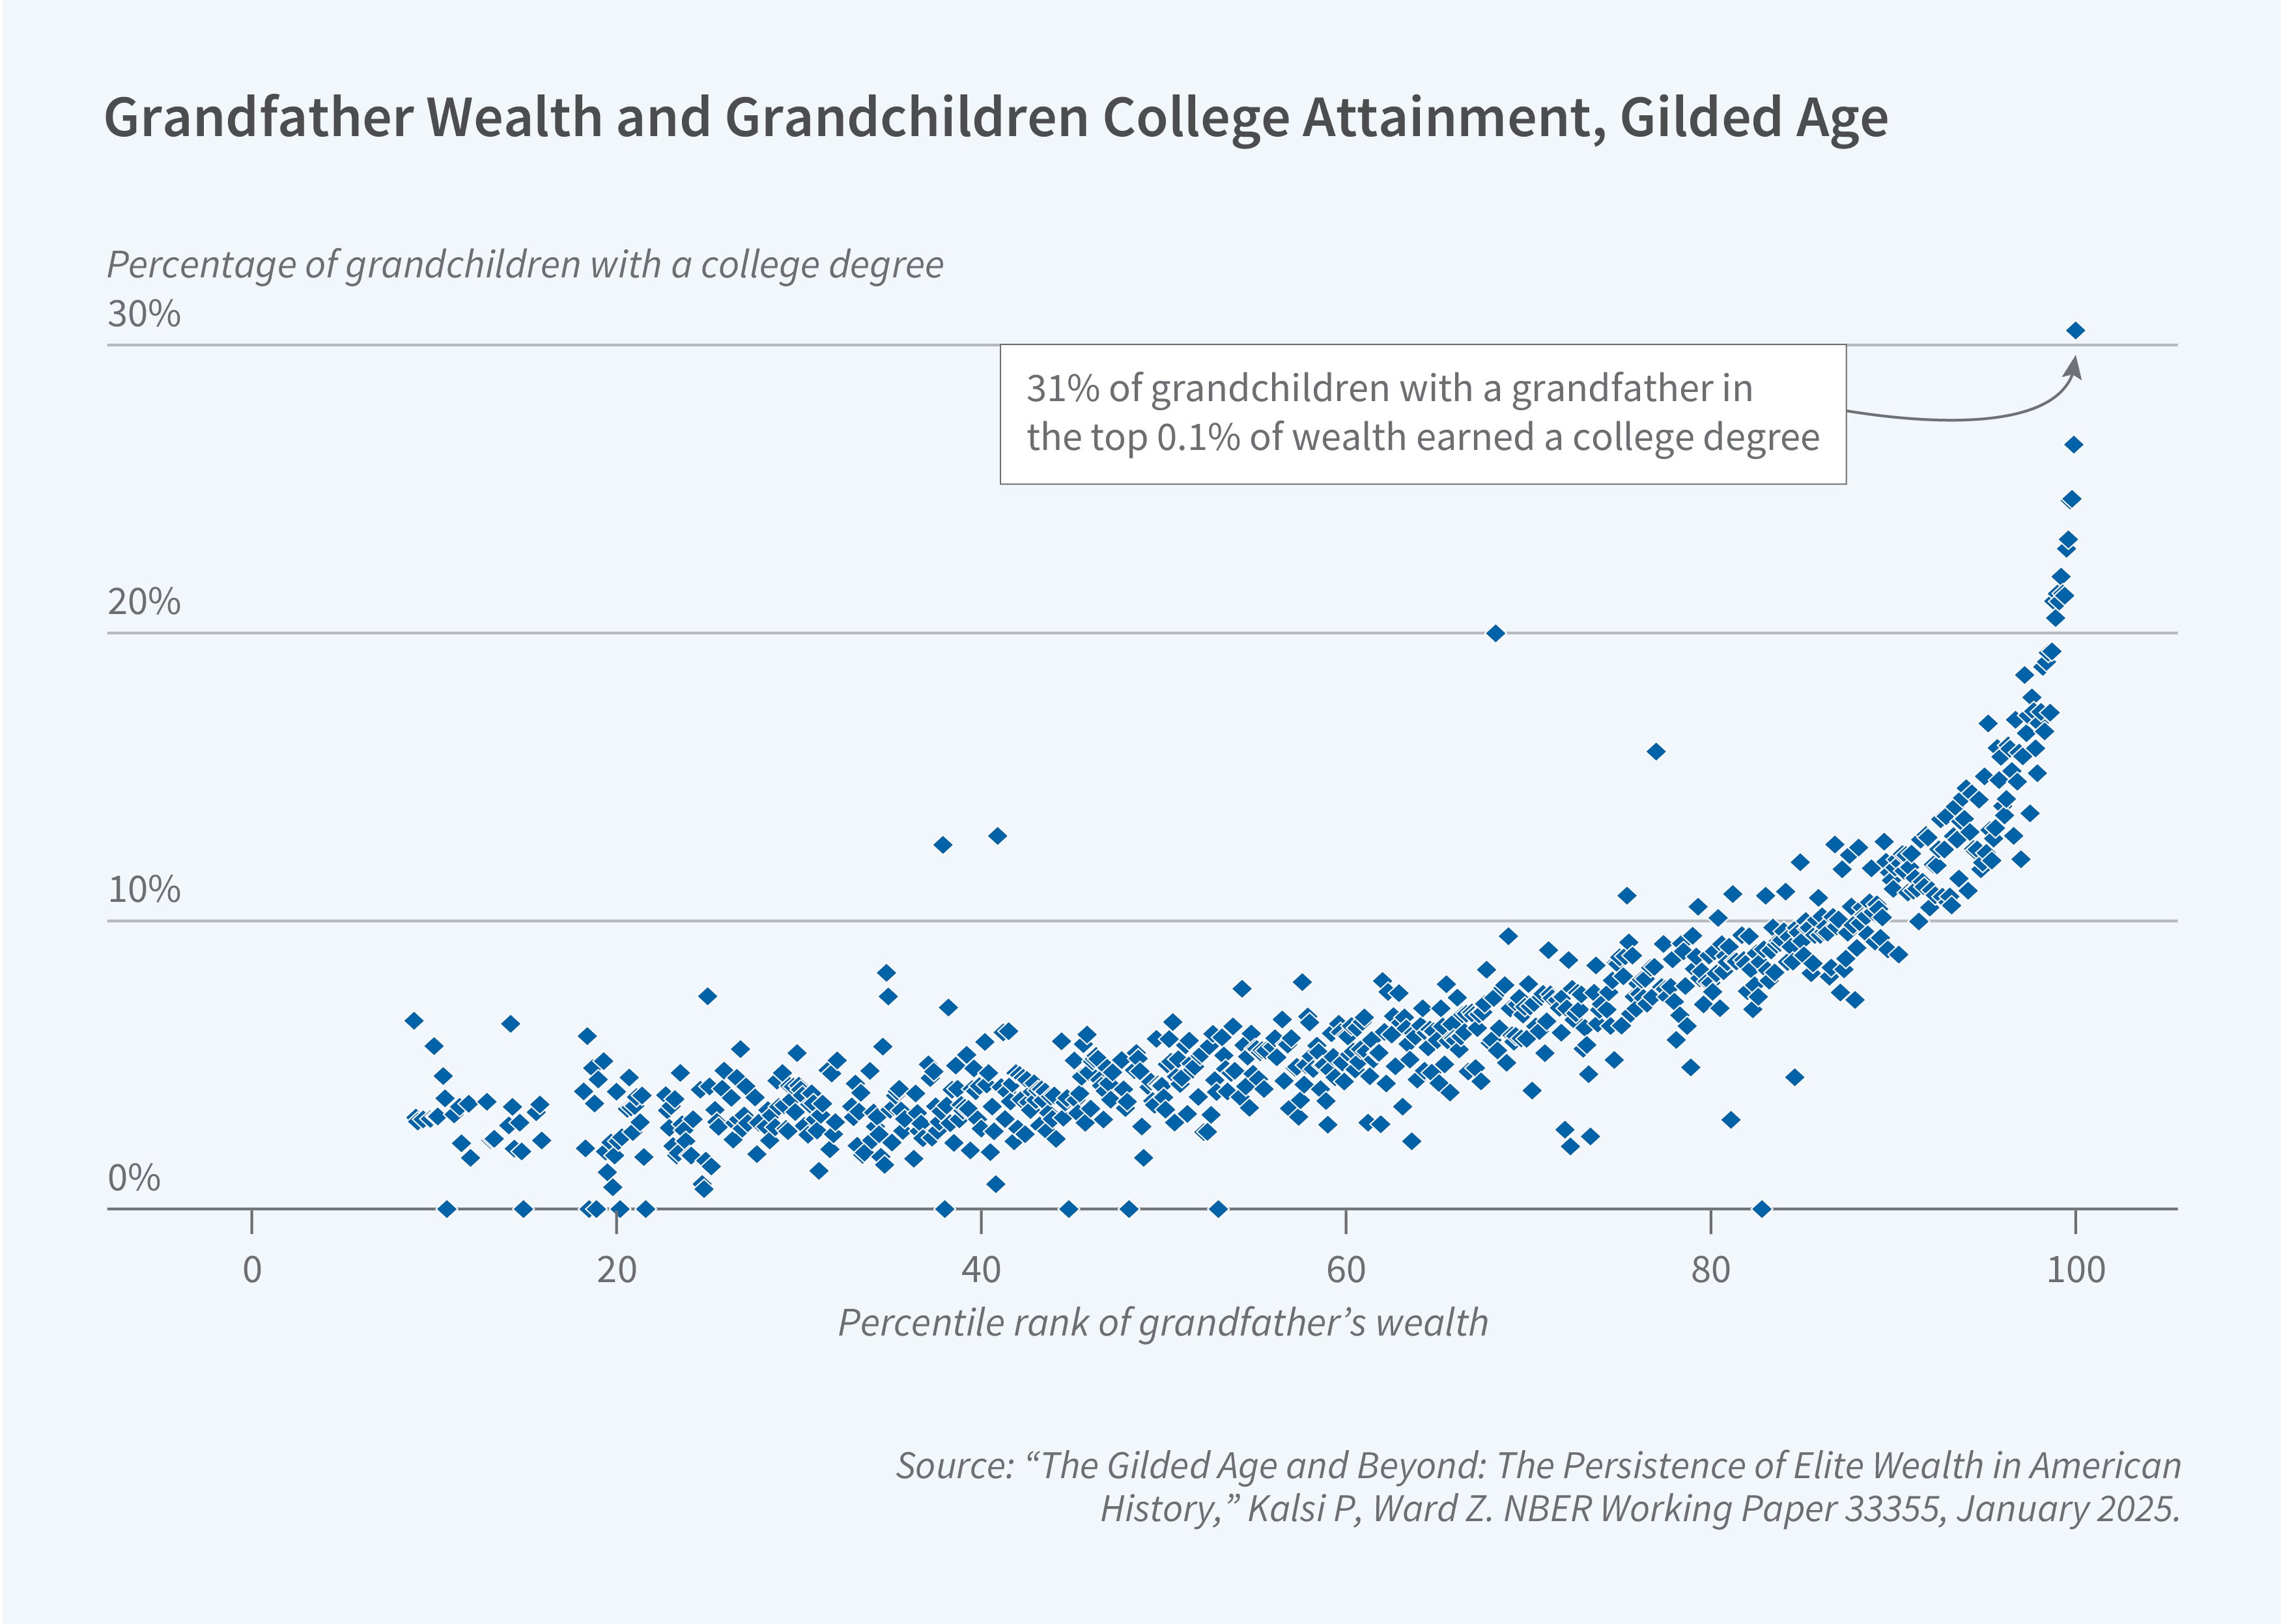
In another paper, Ward with Priti Kalsi turn to generational wealth.8 Did being born into an extremely wealthy family give children and grandchildren larger advantages than being merely well-off? This is hard to address with standard historical mobility measures that rely on occupational titles that do not distinguish an especially wealthy farmer or merchant from a middling one. To capture extreme advantage directly, we draw on markers of wealth recorded in the historical censuses, such as property values, and signs of affluence, like employing several live-in servants. We then link millions of records to trace the wealthiest families across their own lifetimes, from parents to children and from grandparents to grandchildren. We find that the top tail was surprisingly fluid. Most elite families did not hold their position for long, and the majority fell out of the top within a single generation. Yet mobility was nonlinear across the wealth distribution. Starting at the top sharply raised the odds of staying there, whether measured by grandchildren’s wage income, college attainment, or home values (Figure 3). Extreme wealth was the most persistent, such that the advantages of the richest families faded more slowly across generations.
Finally, we acknowledge that while our own work and that of others has focused on the transmission of socioeconomic status, much of the value of status lies in the benefits it confers. These include access to resources that are necessary for health and happiness. Unfortunately, these measures of well-being are not widely available in historical data sources, but using the same genealogy platform that we used to create the Census Tree, Price, Sandra Black, Neil Duzett, Adriana Lleras-Muney, and Nolan Pope are able to observe lifespan—a proxy for health—across generations for over 26 million people born between 1880 and 1920.9 Using both parent-child and sibling pairs, we find that the intergenerational persistence of lifespan has never been much larger than 0.15 (Figure 4).
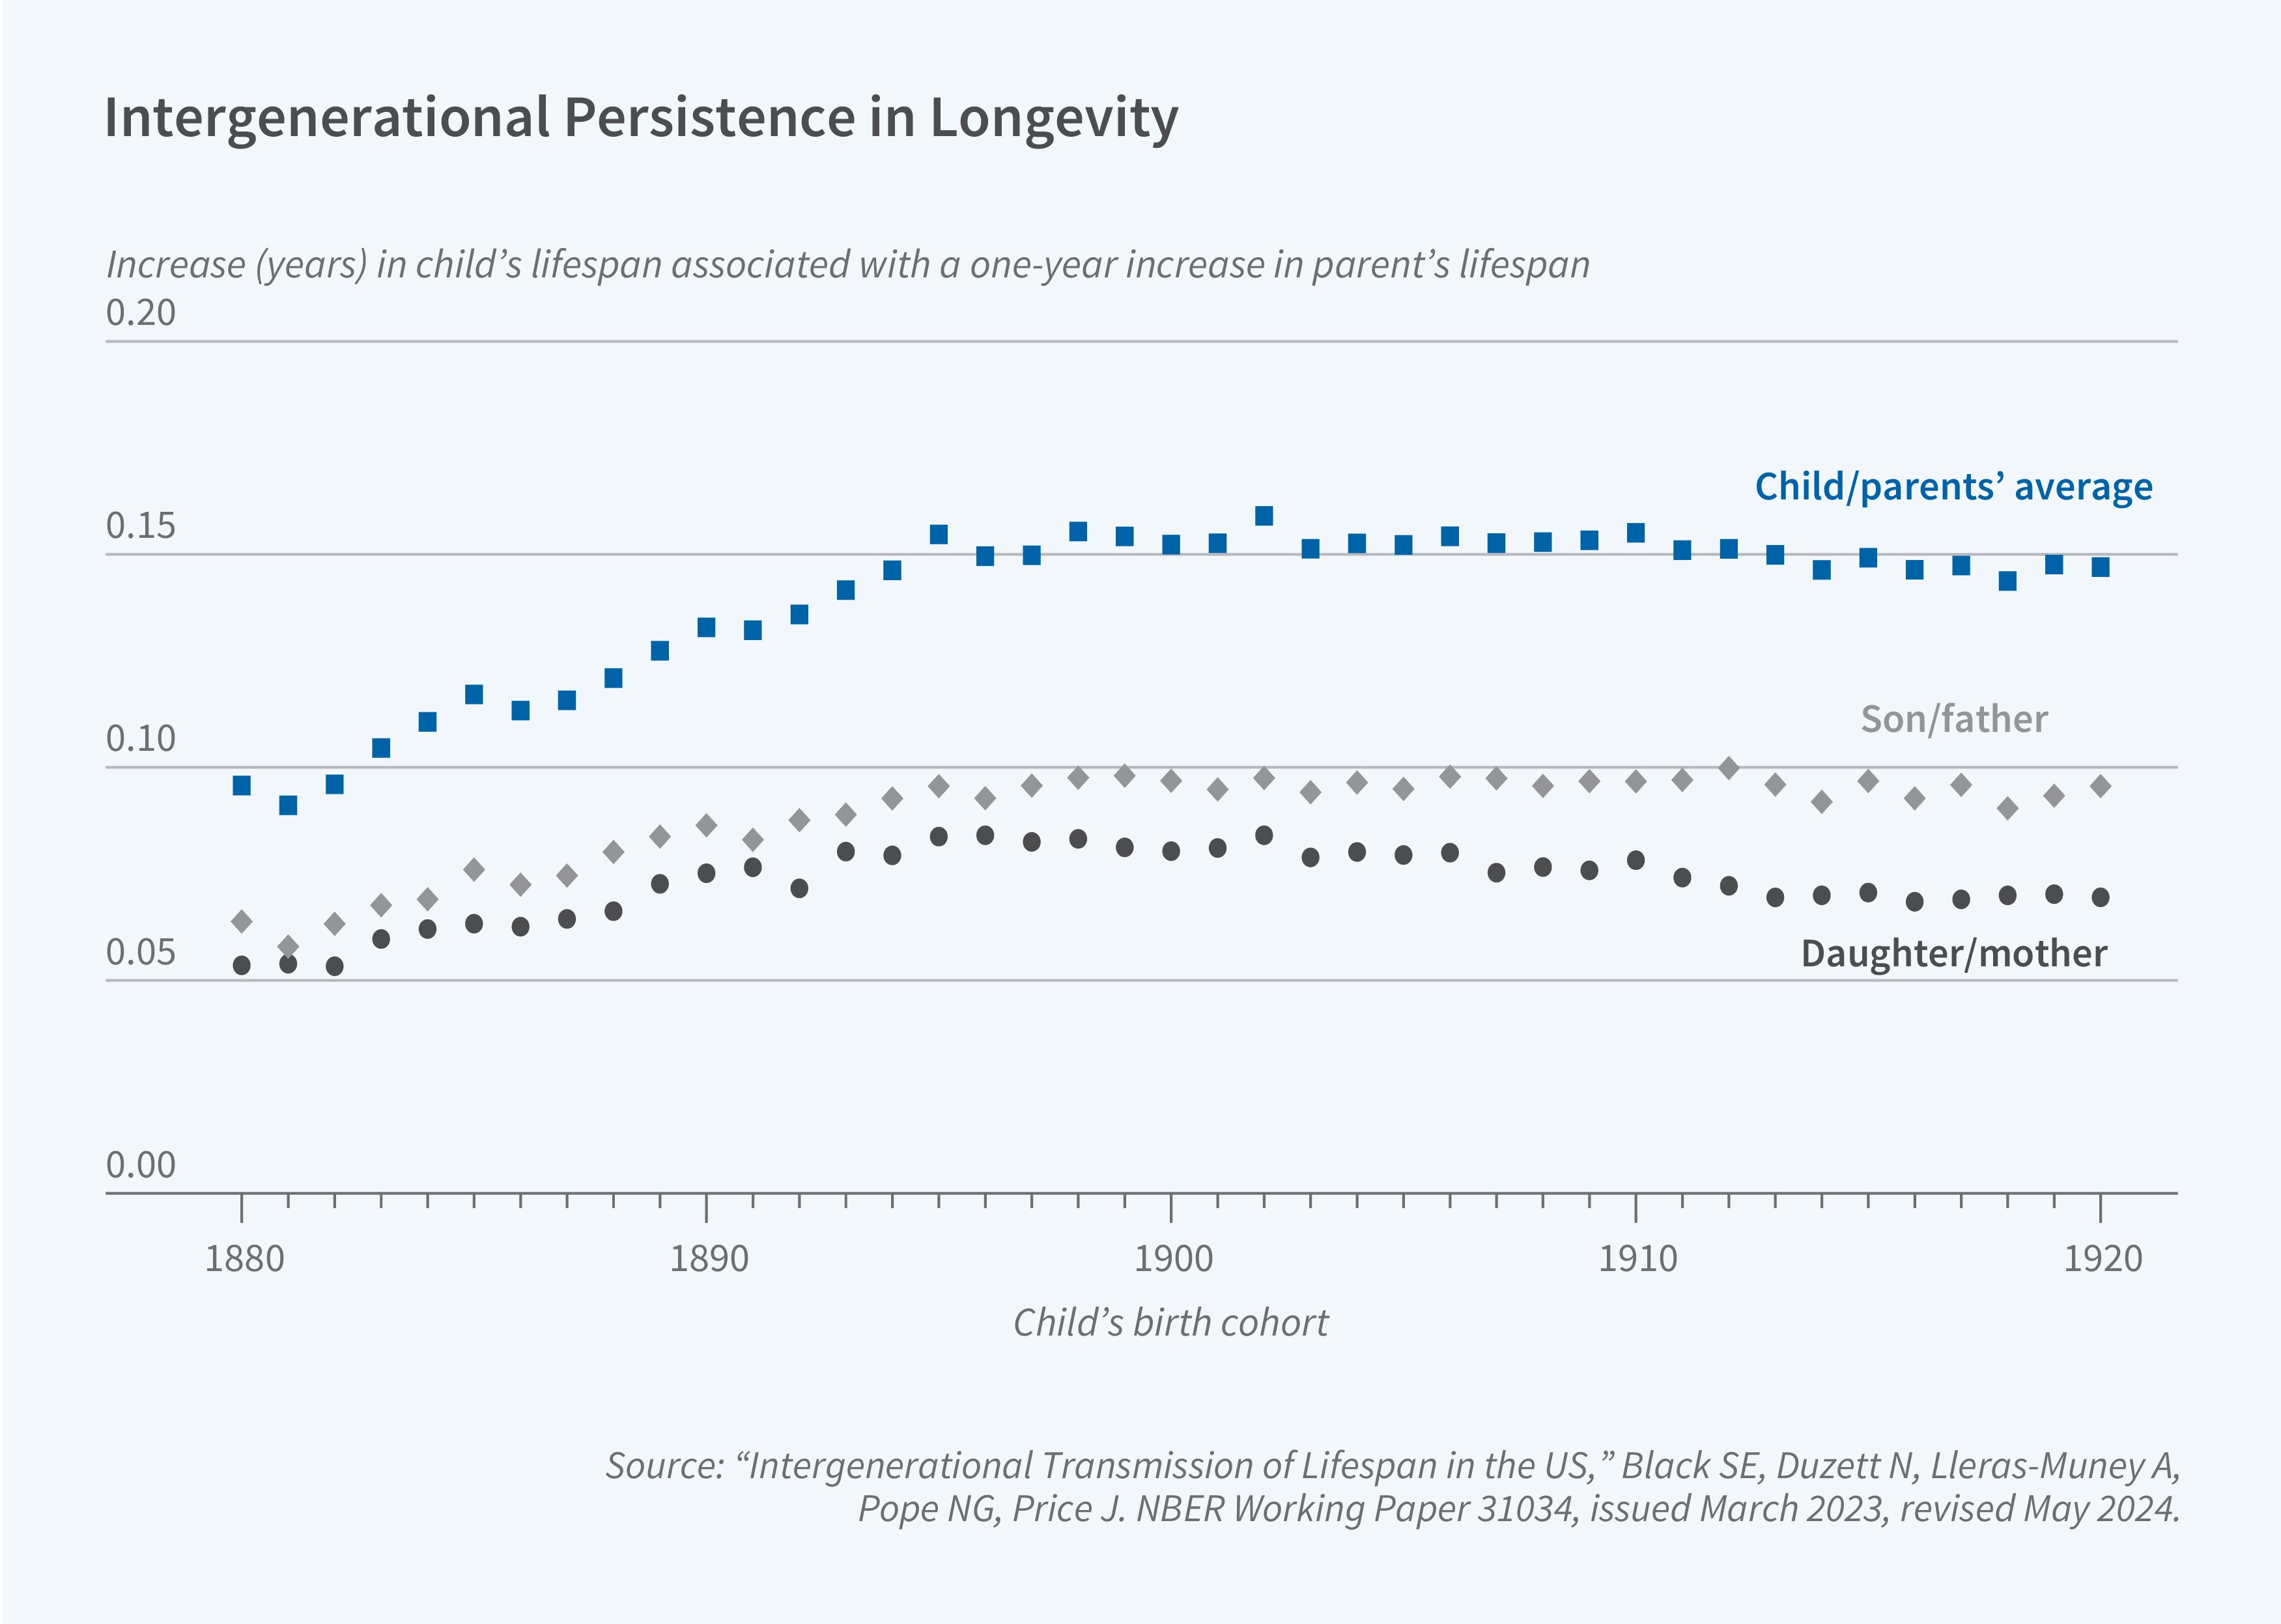
These small estimates are surprising given the important genetic determinants of health and the strong transmission of occupation-based status. Even among twins, the correlations in lifespan are low, indicating that there is a large stochastic component in lifespan that is unrelated to family influences such as genetics or shared environments. This suggests that measures that incorporate health or other measures of well-being may show more intergenerational mobility than measures of socioeconomic status alone.
Endnotes
“Intergenerational Income Mobility in the United States,” Solo G. American Economic Review 82(3), June 1992, pp. 393–408.
“Automated Linking of Historical Data,” Abramitzky R, Boustan LP, Eriksson K, Feigenbaum JJ, Pérez S. NBER Working Paper 25825 (May 2019), and Journal of Economic Literature 59(3), September 2021, pp. 865–918.
“Combining Family History and Machine Learning to Link Historical Records,” Price J, Buckles K, Van Leeuwen J, Riley I. NBER Working Paper 26227, September 2019, and Explorations in Economic History 80(C), April 2021, article 101391.
“Breakthroughs in Historical Record Linking Using Genealogy Data: The Census Tree Project,” Buckles K, Haws A, Price J, Wilber HEB. NBER Working Paper 31671, issued September 2023, revised November 2024, and Explorations in Economic History 98(C), October 2025, article 101717.
“Intergenerational Mobility in American History: Accounting for Race and Measurement Error,” Ward Z. NBER Working Paper 29256, issued September 2021, revised January 2023, and American Economic Review 113(12), December 2023, pp. 3213–3248.
“Family Trees and Falling Apples: Historical Intergenerational Mobility Estimates for Women and Men,” Buckles K, Price J, Ward Z, Wilbert HEB. NBER Working Paper 31918, issued November 2023, revised November 2024.
“Like Great-Grandparent, Like Great-Grandchild? Multigenerational Mobility in American History,” Ward Z, Buckles K, Price J. NBER Working Paper 33923, June 2025.
“The Gilded Age and Beyond: The Persistence of Elite Wealth in American History,” Kalsi P, Ward Z. NBER Working Paper 33355, January 2025.
“Intergenerational Transmission of Lifespan in the US,” Black SE, Duzett N, Lleras-Muney A, Pope NG, Price J. NBER Working Paper 31034, issued March 2023, revised May 2024.