Experiences, Expectations, and Asset Prices
Asset prices are inherently forward-looking. Stock prices reflect investors’ expectations of dividends many years into the future. Prices of long-term bonds reflect investors’ expectations of future short-term interest rates and inflation over the life of the bond. To understand why asset prices fluctuate, one must understand the forces that shape investor expectations. This is a fundamental question in asset pricing and macrofinance.
Models with full-information rational expectations (FIRE) sidestep the expectations-formation question by presuming that investors not only process information rationally but also know the correct structure and parameters of the data-generating process, which then pins down the expectations. Investors would need to know, for example, the long-run mean of dividend growth or the long-run mean of interest rates, even though such quantities are difficult to estimate precisely despite many decades of data. If the objective process is hard for econometricians to infer ex post, it is implausible that all investors know it in real time.
Economists must therefore ask how investors form beliefs, what information they use, and how they weight it. For asset pricing, the most important forces are those that systematically push the expectations of many investors in a common direction and thereby influence aggregate asset demand. The expectations of any individual investor, whether retail or professional, may be shaped by a wide range of idiosyncratic influences. Many of these influences offset one another when demand is aggregated across investors and therefore leave no trace in equilibrium prices. The key question is which common forces survive aggregation and leave a measurable imprint on asset prices.
The research that I describe in this summary shows that lifetime experiences are one such systematic force, exerting a broad and persistent influence on expectations and asset prices. When investors form beliefs about the future, they place substantial weight on the macroeconomic conditions and asset returns they have experienced over their lifetimes. As new observations accumulate and generations turn over, beliefs gradually adjust and asset prices move with them. This process generates persistent, low-frequency variation in asset prices.
Experience-Based Expectations
In a series of papers, Ulrike Malmendier and I show that lifetime experiences have a pervasive influence on financial decisions and expectations. To identify these effects cleanly and distinguish them from other determinants of beliefs, we exploit variation across age cohorts. Because individuals of different ages have lived through different histories, they have accumulated systematically different experiences. If people draw on those experiences when forming expectations, these differences should translate into predictable differences in beliefs across cohorts.
Using data from the Survey of Consumer Finances and its predecessor surveys extending back to the 1950s, we find that individuals who have experienced higher real stock-market returns over their lifetimes allocate a larger share of their financial wealth to equities.1 In a shorter sample containing individual investors’ return expectations, we also find that those with more favorable return experiences are more optimistic about future stock-market returns. Our estimates indicate that the influence of an experienced return observation on beliefs and decisions wanes over time, consistent with fading memory of past experiences.
In subsequent work, we focus more directly on experience effects in subjective expectations by studying inflation forecasts from the Michigan Surveys of Consumers (MSC), which are available from the 1950s onward.2 We find that cohort-level expectations are well described by a model in which individuals learn about the long-run mean and the short-run persistence of inflation from the inflation outcomes they have experienced over their lifetimes. Strikingly, the estimated pattern of memory decay closely resembles that found in our earlier work on stock returns and investment decisions. For a 50-year-old individual, for example, an inflation realization observed in the most recent quarter receives about twice as much weight as one experienced 15 years earlier.
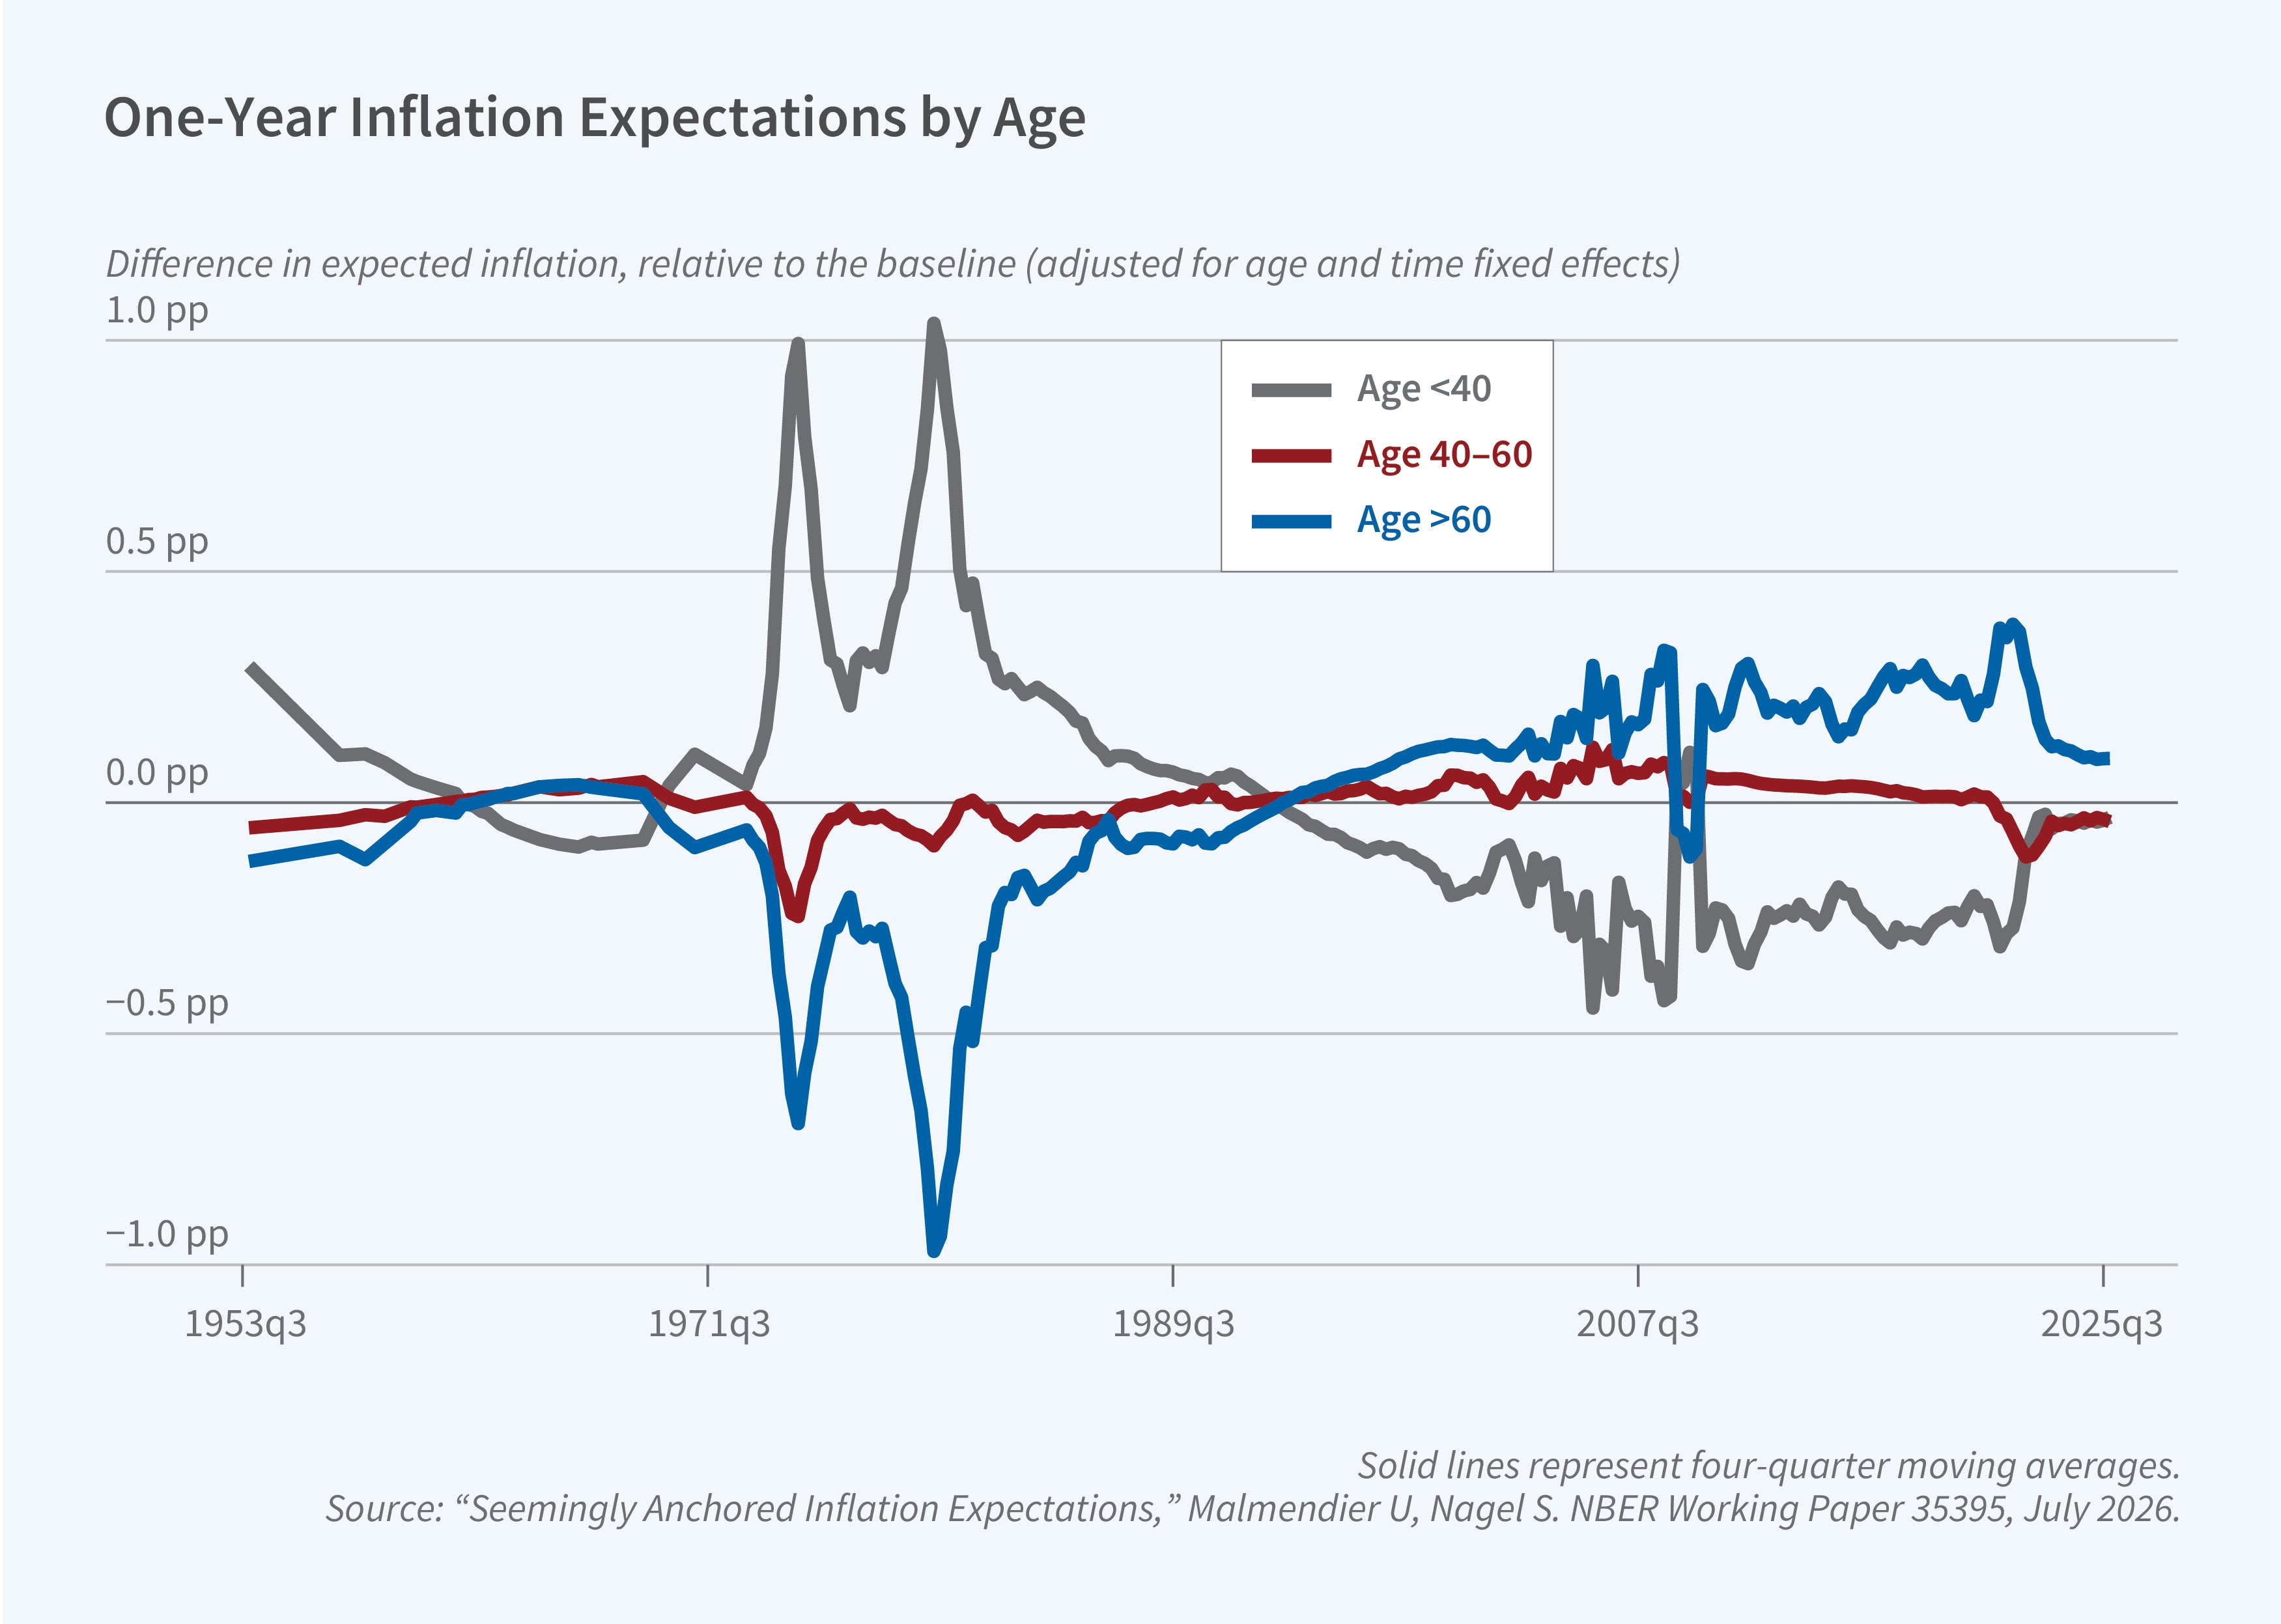
Figure 1 illustrates the key patterns in one-year inflation expectations using updated data through 2025 (the sample ended in 2009 in our original study). The dots show MSC expectations averaged within three age groups. During the 1970s, the gap between younger and older respondents widened steadily. By the early 1980s, individuals under 40 expected inflation to be more than 2 percentage points higher than did those over age 60, consistent with the fact that younger cohorts’ lifetime experiences were dominated by the high inflation of the 1970s. The gap then took roughly a decade to disappear. In the two decades preceding the COVID-19 pandemic, the pattern reversed: Older individuals expected higher inflation than younger individuals did, consistent with older cohorts retaining memories of the inflationary 1970s. The lines show the predictions of an experience-based learning model in which individuals infer the properties of the inflation process from the inflation outcomes observed over their lifetimes, placing greater weight on recent experiences within their lifetimes than on more distant ones earlier in life. The model accounts for much of the evolving dispersion in expectations across age groups.
These experience effects are not confined to consumers. In joint work with Zhen Yan, we show that the same experience-based model of inflation expectations, with the same weighting of past inflation outcomes as estimated for consumers, also helps explain disagreement about the inflation outlook among individual monetary policymakers.3 In this analysis, we use the inflation forecasts reported by members of the Federal Open Market Committee in the Federal Reserve’s semiannual Monetary Policy Report to the Congress. Although experience effects are smaller among policymakers than among consumers, they are economically relevant even for experts supported by professional staff and quantitative economic analyses.
Fading Memory in the Aggregate
Time-varying differences in beliefs across age groups provide a clean source of identification for experience effects, but for asset pricing the relevant object is, roughly speaking, the belief of the average investor.4 The key feature of experience-based learning in this respect is fading memory. For the average investor, memory fades partly because individuals place greater weight on recent observations than on experiences from earlier in life, and partly because generational turnover brings younger investors into asset markets with experience sets concentrated on more recent data.
When each cohort learns from its own experience, the dynamics of the average belief are well approximated by a constant-gain learning rule. Under constant-gain learning, new observations always receive a constant positive weight, so older observations gradually fade from memory and learning is perpetual. Even with this focus on average beliefs, the cross-cohort evidence from expectations surveys is still valuable because it identifies the rate at which memory decays. Specifically, the experience-based learning model estimated on MSC survey data on inflation expectations implies a weight of 1.8 percent on a new quarterly observation in a constant-gain updating scheme that approximates the dynamics of average beliefs. Rather than choosing a fading-memory mechanism to fit asset prices directly, I discipline an asset pricing exercise using this memory-decay rate implied by the estimates from the cohort-level survey data. In other words, I ask whether the belief-formation mechanism that explains the expectations in survey data well can, with the same parameters, also help explain properties of asset prices.
Growth Experiences and Stock Market Valuation Cycles
A standard present-value identity says that a high price-dividend ratio for a stock market index must reflect some combination of high expected future dividend growth and low expected future returns. Under FIRE, the usual empirical interpretation is that variation in valuation ratios mostly reflects time-varying risk premia, because dividend growth is difficult to forecast while stock index excess returns relative to risk-free interest rates are forecastable with the price-dividend ratio. However, this evidence is based on ex post predictive regressions and is unlikely to reflect the expectations investors held when making their portfolio decisions. Indeed, subjective excess-return expectations elicited from retail investors, professional forecasters, and corporate executives do not covary with the price-dividend ratio in the manner implied by these ex post regressions.5
Experience-based learning offers a different interpretation. In this framework, investors perceive long-run dividend growth as uncertain and learn about it from realized dividend growth observations, with the influence of past observations fading over time. Now suppose a sequence of strong realized dividend growth raises their estimate of long-run growth. Because they expect higher future dividends, they bid up stock prices relative to current dividends. The resulting high price-dividend ratio of the stock market index therefore reflects subjective optimism about cash flows rather than a willingness to accept lower expected returns. When optimism eventually turns into disappointment, elevated valuations are followed by low realized returns. Thus, the same episode can appear to investors as a boom justified by dividend expectations and as return predictability to an econometrician studying the data ex post.
Zhengyang Xu and I show that this mechanism helps reconcile several key facts about asset prices and survey expectations.6 We build an asset pricing model in which the representative investor learns about the long-run growth rate of dividends with a constant-gain learning rule. In constructing these experience-based growth beliefs, we fix the weight on a new quarterly dividend observation in this updating rule at the value of 1.8 percent implied by the microdata estimates on inflation expectations in the MSC. Given this relatively low weight on newly arriving data, beliefs adjust only slowly, which generates persistent valuation cycles, consistent with the high persistence of the price-dividend ratio and other valuation measures in empirical data. It also predicts that elevated experience-based growth beliefs should forecast lower subsequent excess returns in ex post analyses; empirically, this relationship is strong in US data from 1927 to 2019. At the same time, the mechanism explains why valuation ratios need not be negatively related to subjective expected excess returns: Valuation cycles arise from fluctuations in subjective cash-flow expectations rather than from time-varying risk premia. Accordingly, valuations should instead be positively related to subjective dividend expectations, a prediction supported by evidence from equity analysts’ earnings forecasts.
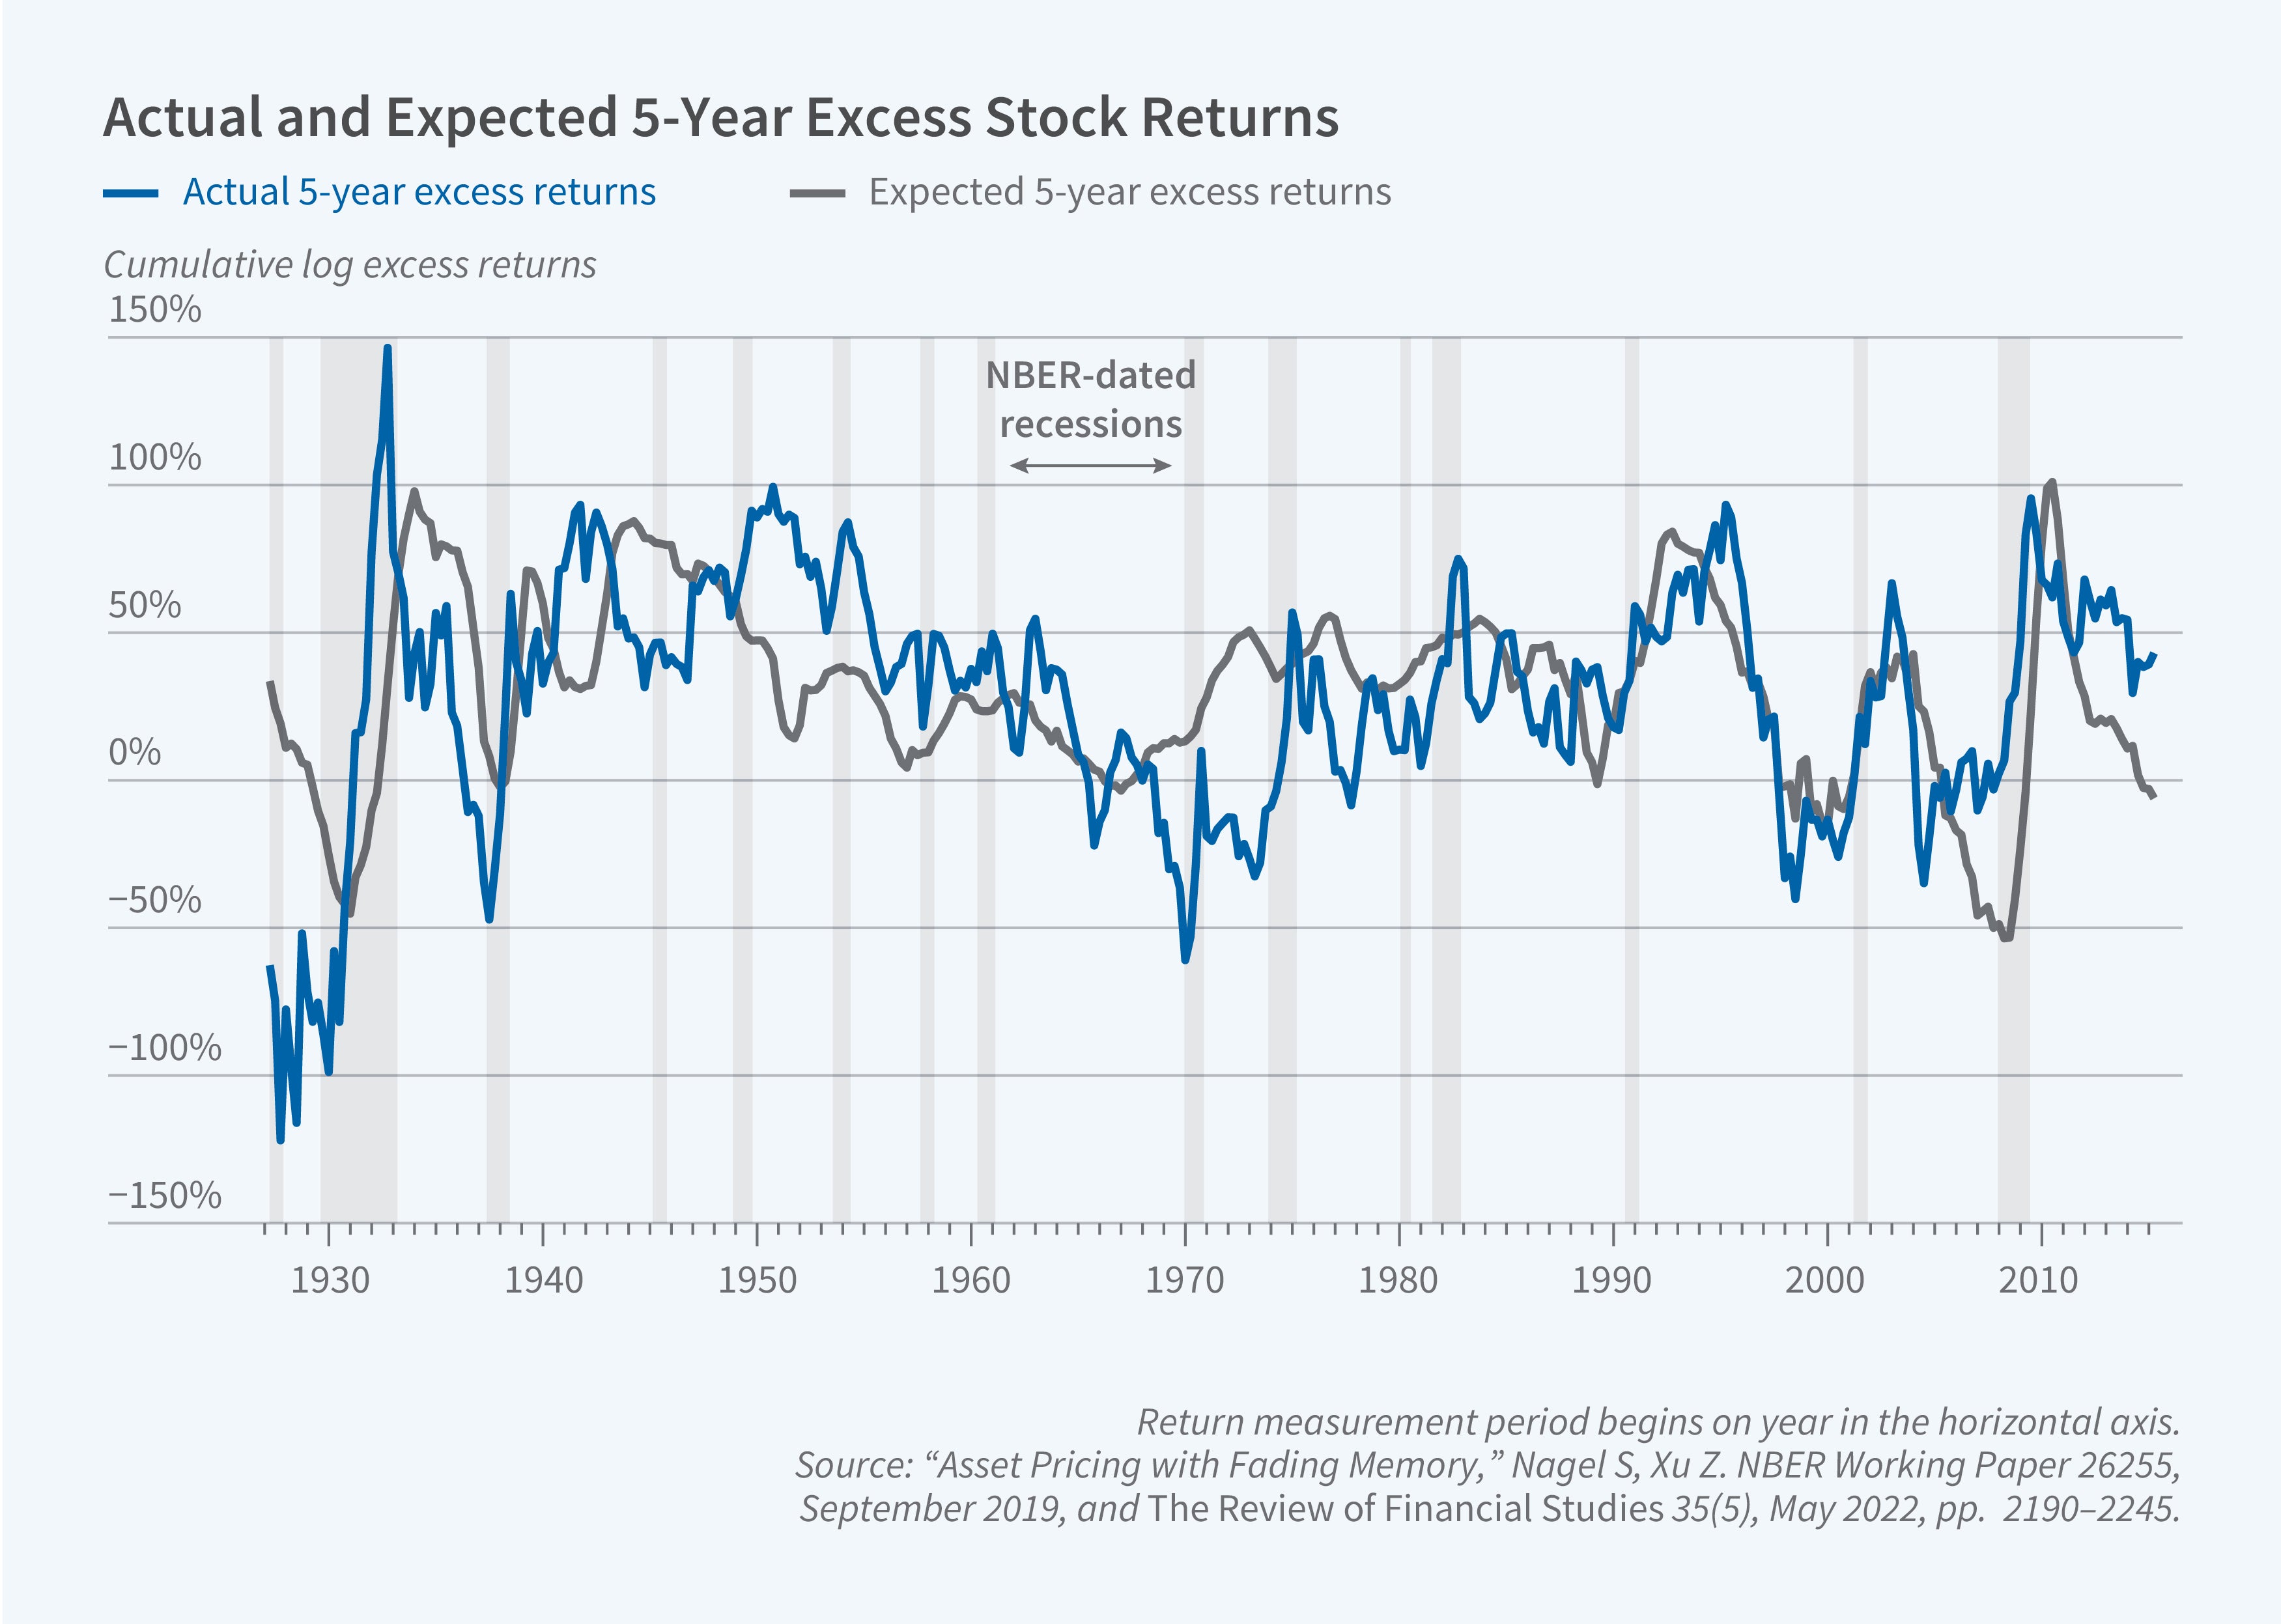
Figure 2 illustrates the relationship between experience-based growth beliefs and stock market index returns in excess of Treasury bill yields over the next five years. In this plot, the experience-based growth beliefs are translated into predicted five-year excess returns. These predicted excess returns are inversely related to experience-based growth beliefs: when investors have experienced high growth in stock payouts, including dividends and repurchases, such as in the late 1990s, predicted excess returns are low; when they have experienced low growth in payouts, such as during the depths of the Great Depression in the 1930s or coming out of the global financial crisis in 2009, predicted excess returns are high. The figure also shows that actual realized five-year excess returns are strongly positively related to these predicted excess returns. This pattern is consistent with the view that high experienced payout growth generates optimistic beliefs and elevated valuations, which result in future disappointment, on average.
Inflation Experiences and the Secular Dynamics of Real Interest Rates
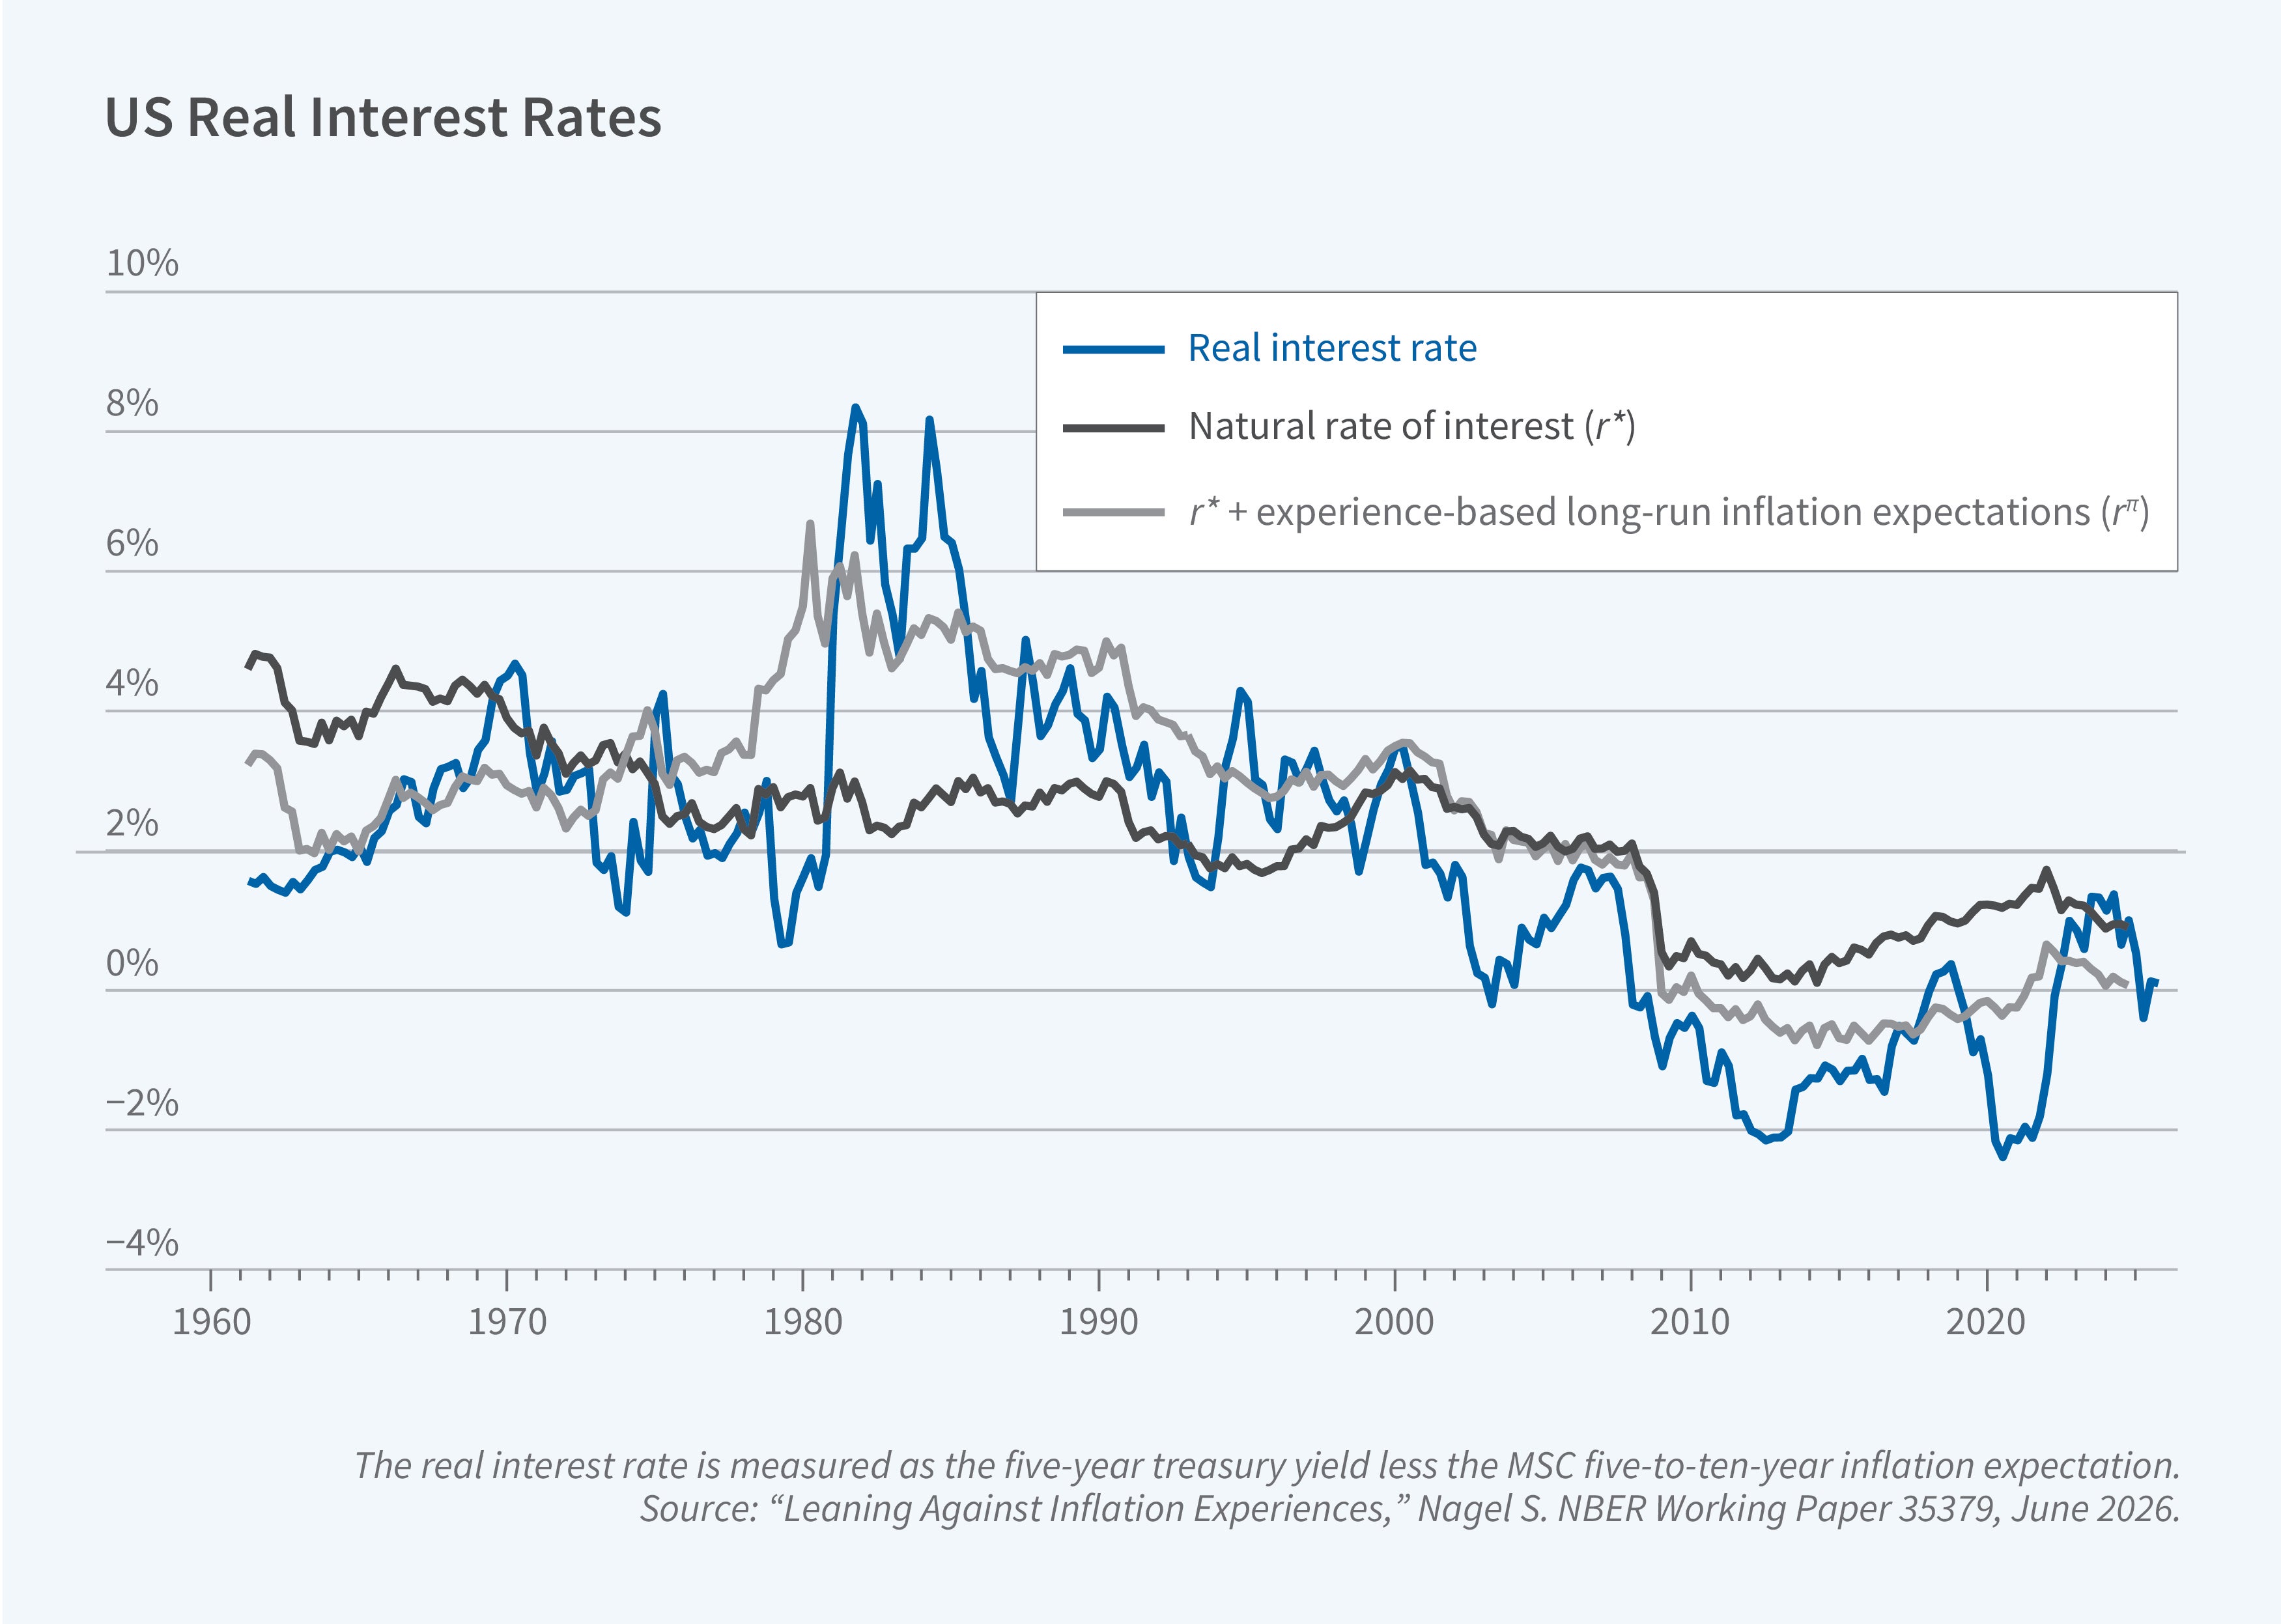
Real interest rates in advanced economies have moved in large, persistent waves. In the US, the five-year ex ante real Treasury yield rose from about 1 percent in the 1960s to around 8 percent in the early 1980s, then declined for decades and turned negative after the global financial crisis. Standard explanations emphasize movements in the natural rate of interest caused by productivity, preferences, demographics, and other fundamentals. Those forces likely matter, but common estimates of the natural rate leave much of the secular variation in real interest rates unexplained. Much of the remaining variation is explained by experience-based formation of inflation expectations and by monetary policymakers’ leaning against deviations of these expectations from inflation targets.7
When the long-run inflation expectations of consumers and corporate decision-makers are shaped primarily by accumulated historical experience, central bank communication about inflation targets may have only limited influence on those expectations. Consequently, if a period of high realized inflation has pushed long-run expectations above the central bank’s explicit or implicit target, policymakers sustain high real interest rates for an extended period. Doing so generates a sequence of low inflation realizations that gradually alter experience-based beliefs and eventually bring long-run expectations back into line with the target.
Moreover, expectations of long-run inflation based on experience are effectively the economic agents’ subjective perception of the central bank’s inflation target. Given that current long-run inflation expectations are already equal to this perceived target, they therefore expect both inflation and the short-term interest rate in the future to remain, on average, at their current levels. High experience-based expectations of long-run inflation are thus accompanied by high expected future nominal and real interest rates, resulting in elevated yields across the entire term structure of nominal and real interest rates.
Empirically, this prediction is strongly supported by the data. Experience-based long-run inflation expectations, constructed using a constant-gain updating scheme that assigns a weight of 1.8 percent to each new quarterly inflation observation, are positively related to real interest rates across the maturity spectrum in the US, the UK, Germany, and Japan, using data extending back to the 1960s in the US and back to the 1970s in the other countries.
Figure 3 illustrates this relationship for the US. It plots the five-year ex ante real interest rate, measured as the five-year Treasury yield less the MSC five-to-ten-year inflation expectation. The figure also shows an estimate of the natural rate of interest, r*, which is typically central to explanations of secular movements in real rates.8 Yet variation in r* leaves much of the low-frequency movement in real interest rates unexplained. Adding the component associated with experience-based long-run inflation expectations, rπ, substantially improves explanatory power. For example, rπ helps account for the prolonged period of elevated real interest rates during the 1980s. Thus, the combination of experience-based inflation expectations and monetary policy that leans against the effects of inflation experiences generates substantial secular variation in real interest rates beyond variation in the natural rate of interest.
Malmendier and I further show that experience-based formation of long-run inflation expectations also explains well the reduction in the level and the stabilization of US long-run inflation expectations from the early 1980s to the years prior to the COVID-19 pandemic, purely based on learning from realized inflation data, without invoking any direct expectations-stabilizing effects of communication about the inflation target by the Federal Reserve.9 This finding implies that the Federal Reserve may still need to respond forcefully to future inflationary shocks in order to keep inflation aligned with its target. Unlike in models in which central bank communication of an inflation target anchors long-run expectations, the experience-based mechanism requires a persistent real interest rate response, similar to those observed in the past, if the US economy is hit by a sustained sequence of inflationary shocks.
Endnotes
“Depression Babies: Do Macroeconomic Experiences Affect Risk-Taking?” Malmendier U, Nagel S. NBER Working Paper 14813, March 2009, and The Quarterly Journal of Economics 126(1), February 2011, pp. 373–416.
“Learning from Inflation Experiences,” Malmendier U, Nagel S. The Quarterly Journal of Economics 131(1), February 2016, pp. 53–87.
“The Making of Hawks and Doves: Inflation Experiences on the FOMC,” Malmendier U, Nagel S, Yan Z. NBER Working Paper 23228, March 2017, and Journal of Monetary Economics 117, January 2021, pp. 19–42.
“Experiences, Expectations, and Asset Prices,” Nagel S. NBER Working Paper 34675, January 2026, and Journal of Business Economics 96(1), January 2026, pp. 1–24.
“Dynamics of Subjective Risk Premia,” Nagel S, Xu Z. NBER Working Paper 29803, February 2022, and Journal of Financial Economics, 150(2), November 2023, article 103713.
“Asset Pricing with Fading Memory,” Nagel S, Xu Z. NBER Working Paper 26255, September 2019, and The Review of Financial Studies, 35(5), May 2022, pp. 2190–2245.
“Leaning Against Inflation Experiences,” Nagel S. NBER Working Paper 35379, June 2026.
“Measuring the Natural Rate of Interest,” Federal Reserve Bank of New York, https://www.newyorkfed.org/research/policy/rstar. The r* series is the Laubach-Williams natural interest rate estimate series provided by the Federal Reserve Bank of New York.
“Seemingly Anchored Inflation Expectations,” Malmendier U, Nagel S. NBER Working Paper 35395, July 2026.