Monopsony Power in Labor Markets
In the standard labor market model taught in introductory economics classes around the world, relationships between firms and workers are just another transaction, mediated by the impersonal market forces of supply and demand. From this perspective, the labor market is best described as being perfectly competitive, where wages are set by the market, with little room for any employer choice.
This “Econ 101” view of the market has a lot of explanatory power. But, as generations of “institutionalist” labor economists have pointed out, it is incomplete. It presumes that the “law of one price” — which postulates that identical commodities have the same price everywhere — holds for workers and their wages. As a result, the model emphasizes the supply of human capital and technology-induced demand as the primary levers that move wages and employment, with little role for firms, power, norms, or interventionist institutions. The competitive model generally portrays efforts to shape the terms of voluntary contracts between workers and firms — like union contracts, minimum wages, or even social conventions — as of secondary importance at best or counterproductive at worst. Fraught arguments about the allocation, and even the definition, of power are unnecessary, as in the words of the late Milton Friedman: “The employee is protected from being coerced by his employer by the existence of other employers for whom he can work.”1
What are the empirical implications of the theory, and do they match up with the real world? For example, in the hypothetical case of a company reducing wages by 10 percent, the competitive model predicts that all workers eventually will quit and go to competitors. Firms have no scope for wage setting, and the market determines a worker’s value at every firm. But is this borne out in the data?
A growing body of experimental and quasi-experimental estimates from a wide variety of contexts suggest otherwise. Even in thick urban labor markets in high-income countries, the share of workers who are likely to leave in response to a hypothetical 10 percent wage cut is much smaller, perhaps 20 to 30 percent, and is often lower for women. In developing economies, it is lower still. This suggests that employers have wide latitude to set wages. A higher wage helps recruit and retain workers, but the market does not dramatically constrain companies’ wage decisions and different employers can make different choices. That is, employers exercise monopsony power — the labor market analog of demand-side monopoly power that gives sellers a degree of control over pricing.
This essay summarizes our recent research on the prevalence of monopsony power and the sources and changing aspects of that power. We also describe our investigation of how monopsony power can affect the provision of nonwage amenities as well as explain a variety of quirks in the labor market, like the widespread use of round-number wage offers or the mixed evidence on the effects of the minimum wage. We end with a discussion of policy and institutional implications of monopsony power as well as new opportunities to study these issues by analyzing the growing set of policy experiments that rebuild countervailing power.
Why Monopsony?
The growing interest in monopsony power fundamentally comes from the wide gap between the theoretical predictions of the competitive model and empirical findings. Perhaps no other prediction is as clearly at odds with the evidence as the “law of one price” in the labor market. Early twentieth-century labor economists marshaled some evidence on this point, but the advent of high-quality, matched employer-employee data, combined with attention to transparent quasi experiments, has moved the research frontier considerably. At this point, there is a large body of evidence for firm-specific wages where workers’ wages partly reflect the productivity and profitability of their employers, which violates the law of one price.2 This naturally pushes us to examine models of the labor market in which employers have some choice in setting wages as opposed to passively taking wages as mere prices of skills, net of disamenities, as dictated by the market.
Some support for monopsony as an influence on wage setting comes from recent studies of the effect of mergers and concentration on wages, which complement earlier evidence on the small effects of the minimum wage on employment. While these indirect failures of the perfect competition model are compelling, the most direct evidence quantifying monopsony measures how firm-level labor supply reacts to plausibly exogenous change in wages. Experimental and quasi-experimental changes in wages across workers, holding all else equal, have been shown to lead to only moderate changes in quits and recruits, a point we will explore in detail in the next section. All this evidence points towards pervasive monopsony as a force in the labor market, where firms set wages for groups of workers, losing those who have better outside options but making profits off those who do not.
What is behind the prevalence of monopsony power in the labor market? Here it is useful to consider the triumvirate of monopsony power: concentration, search frictions, and job differentiation. Concentration refers to having a small number of employers in the market — in the extreme case, a company town. Of course, company towns are rare, but recent research suggests a perhaps surprising amount of concentration in many local labor markets.
However, if concentration were the only source of market power, monopsony power would not be endemic. A key second factor is that job searches are difficult. Large firms set wages for many jobs without having to compete with themselves, creating a bubble of noncompetitive behavior within a workplace. Employees find searching for jobs costly, and many vacancies and possible matches are only communicated informally through social networks.
The third major reason that labor market monopsony exists is that different workers may value the same jobs, paying the same wage, differently. Jobs are more than sources of income and employees factor in more than compensation when making job choices. Many aspects of a job matter, including relationships with coworkers and supervisors, commute times, tastes/abilities for particular tasks, scheduling, and hours. Dube, Naidu, and Adam Reich emphasize that subjective experiences of work — such as meaning and a sense of purpose, managerial respect, and the experience of dignity — are important to workers.3
The taste for the same job and knowledge about outside jobs vary for different workers, which gives employers some scope to reduce wages, losing some workers who would rather work elsewhere but keeping those for whom the job is the best they could hope to find.
Measuring Monopsony Power
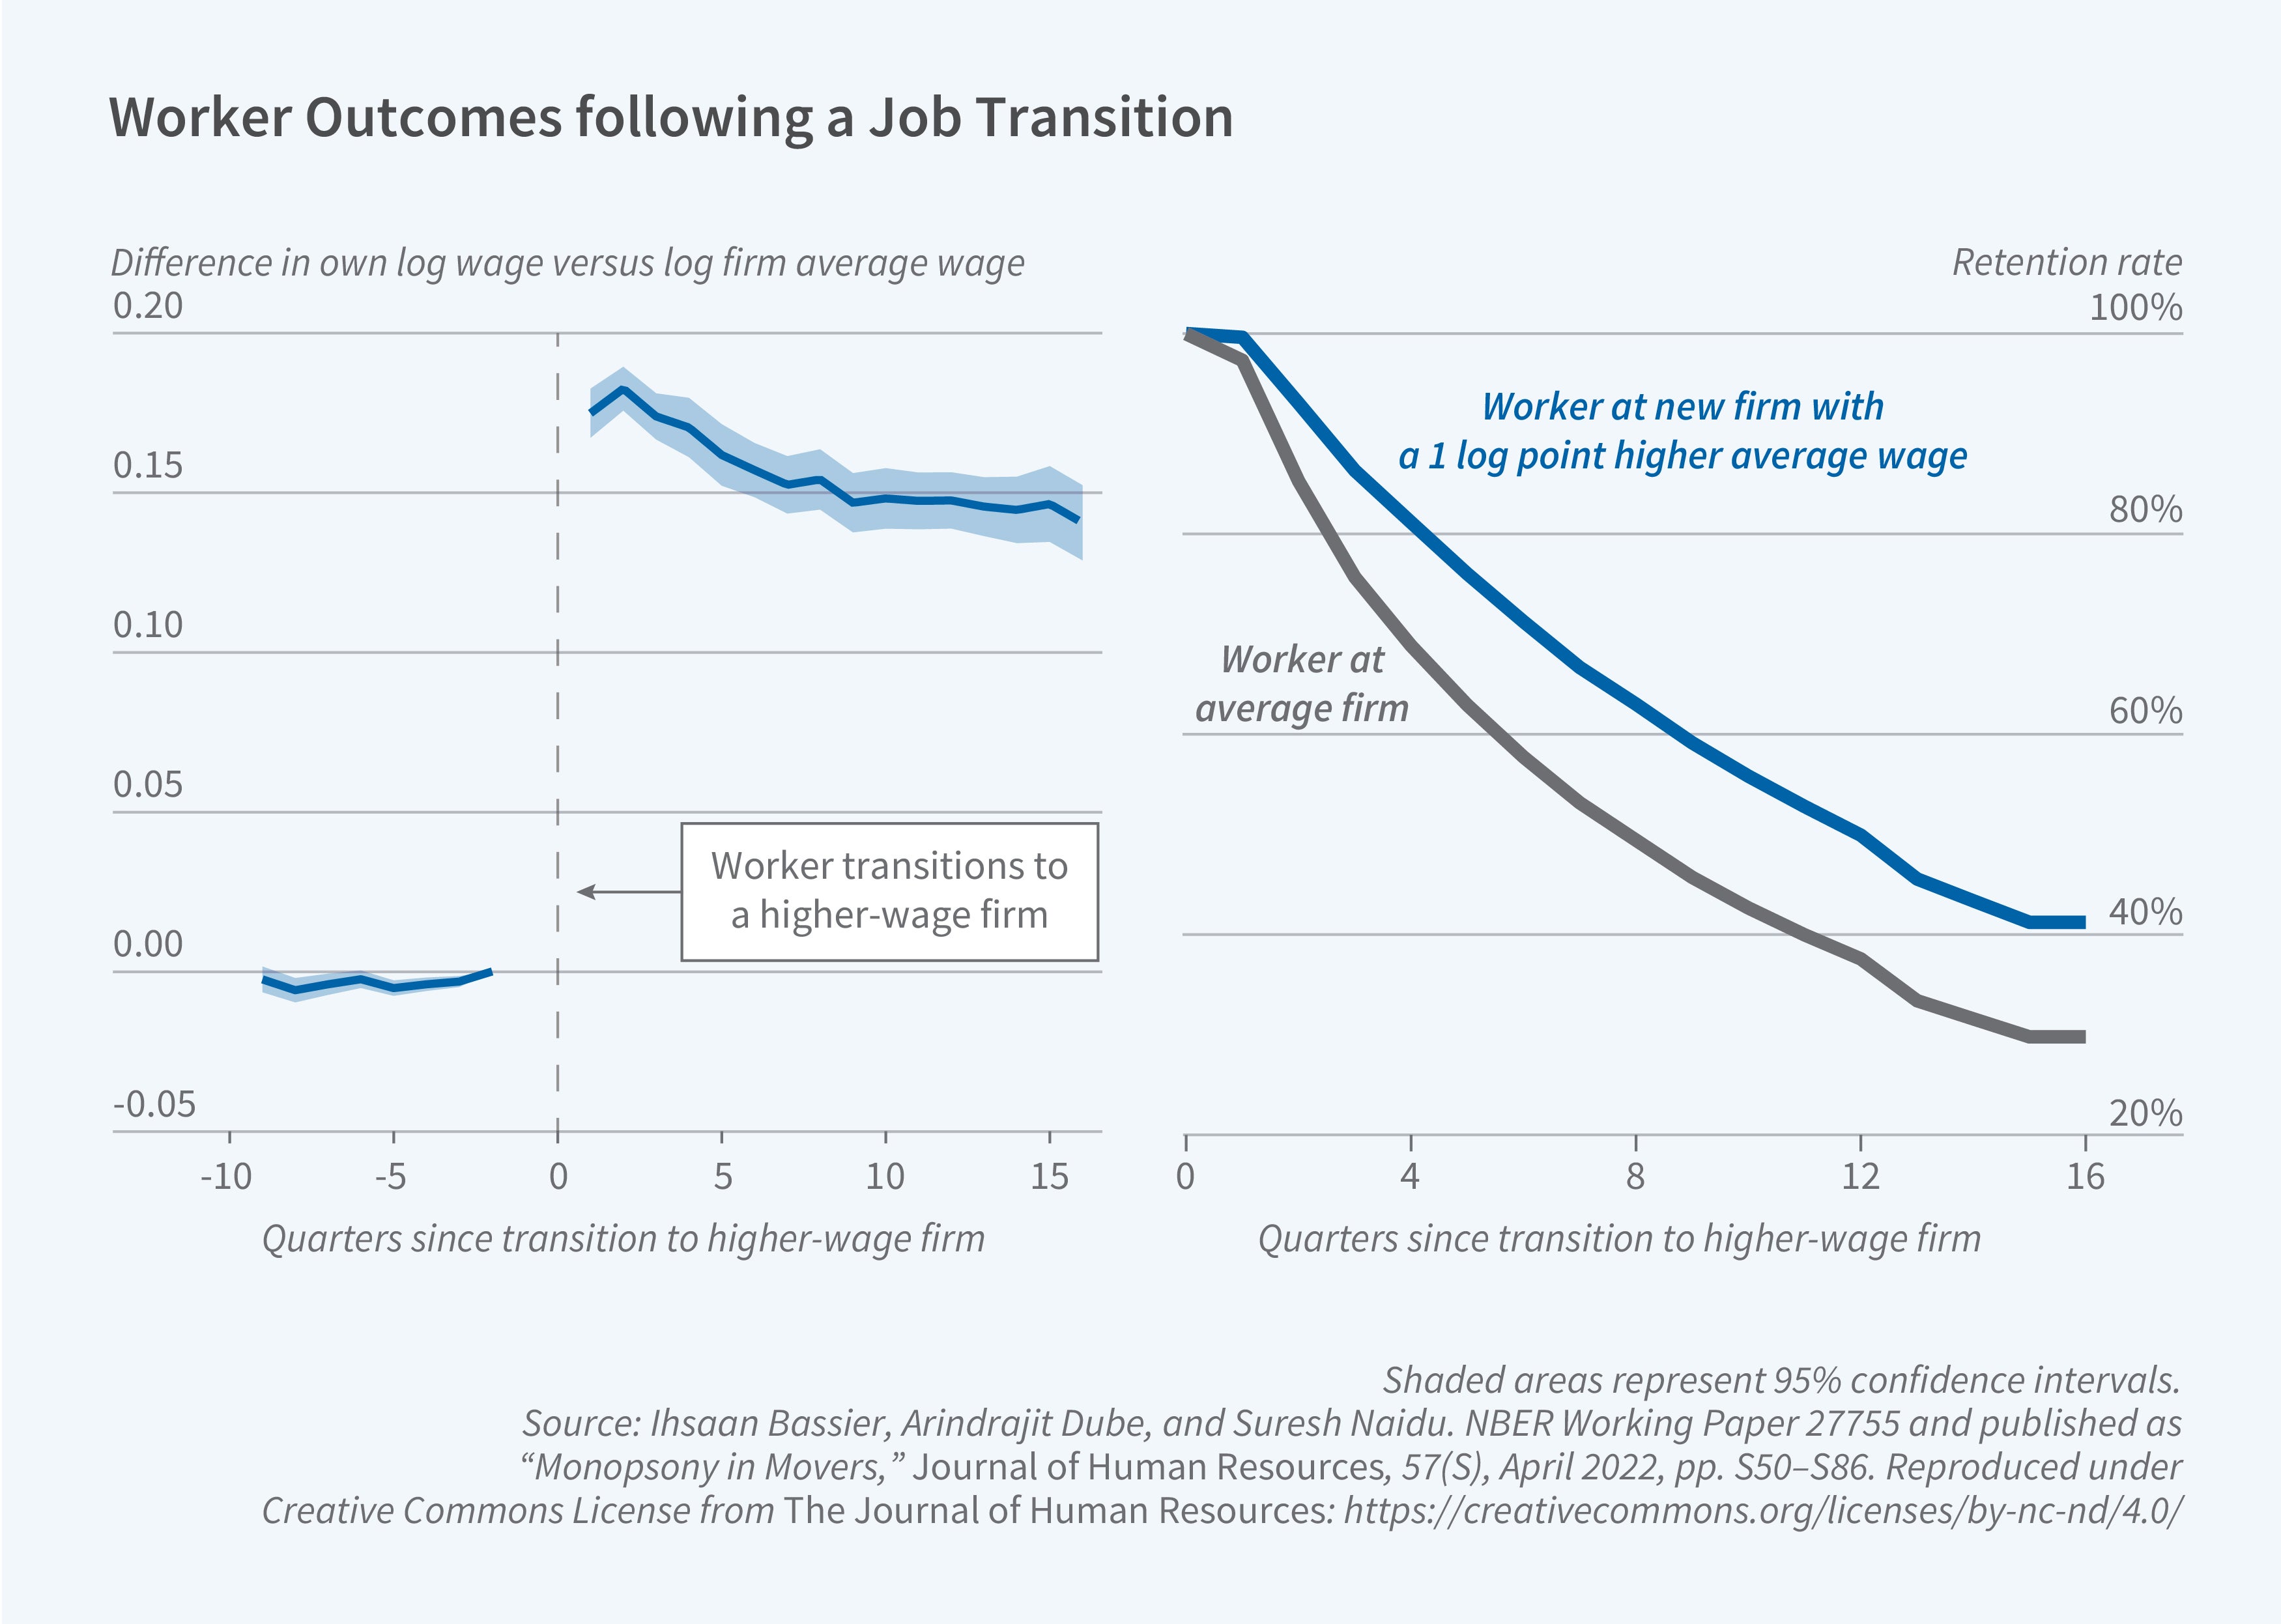
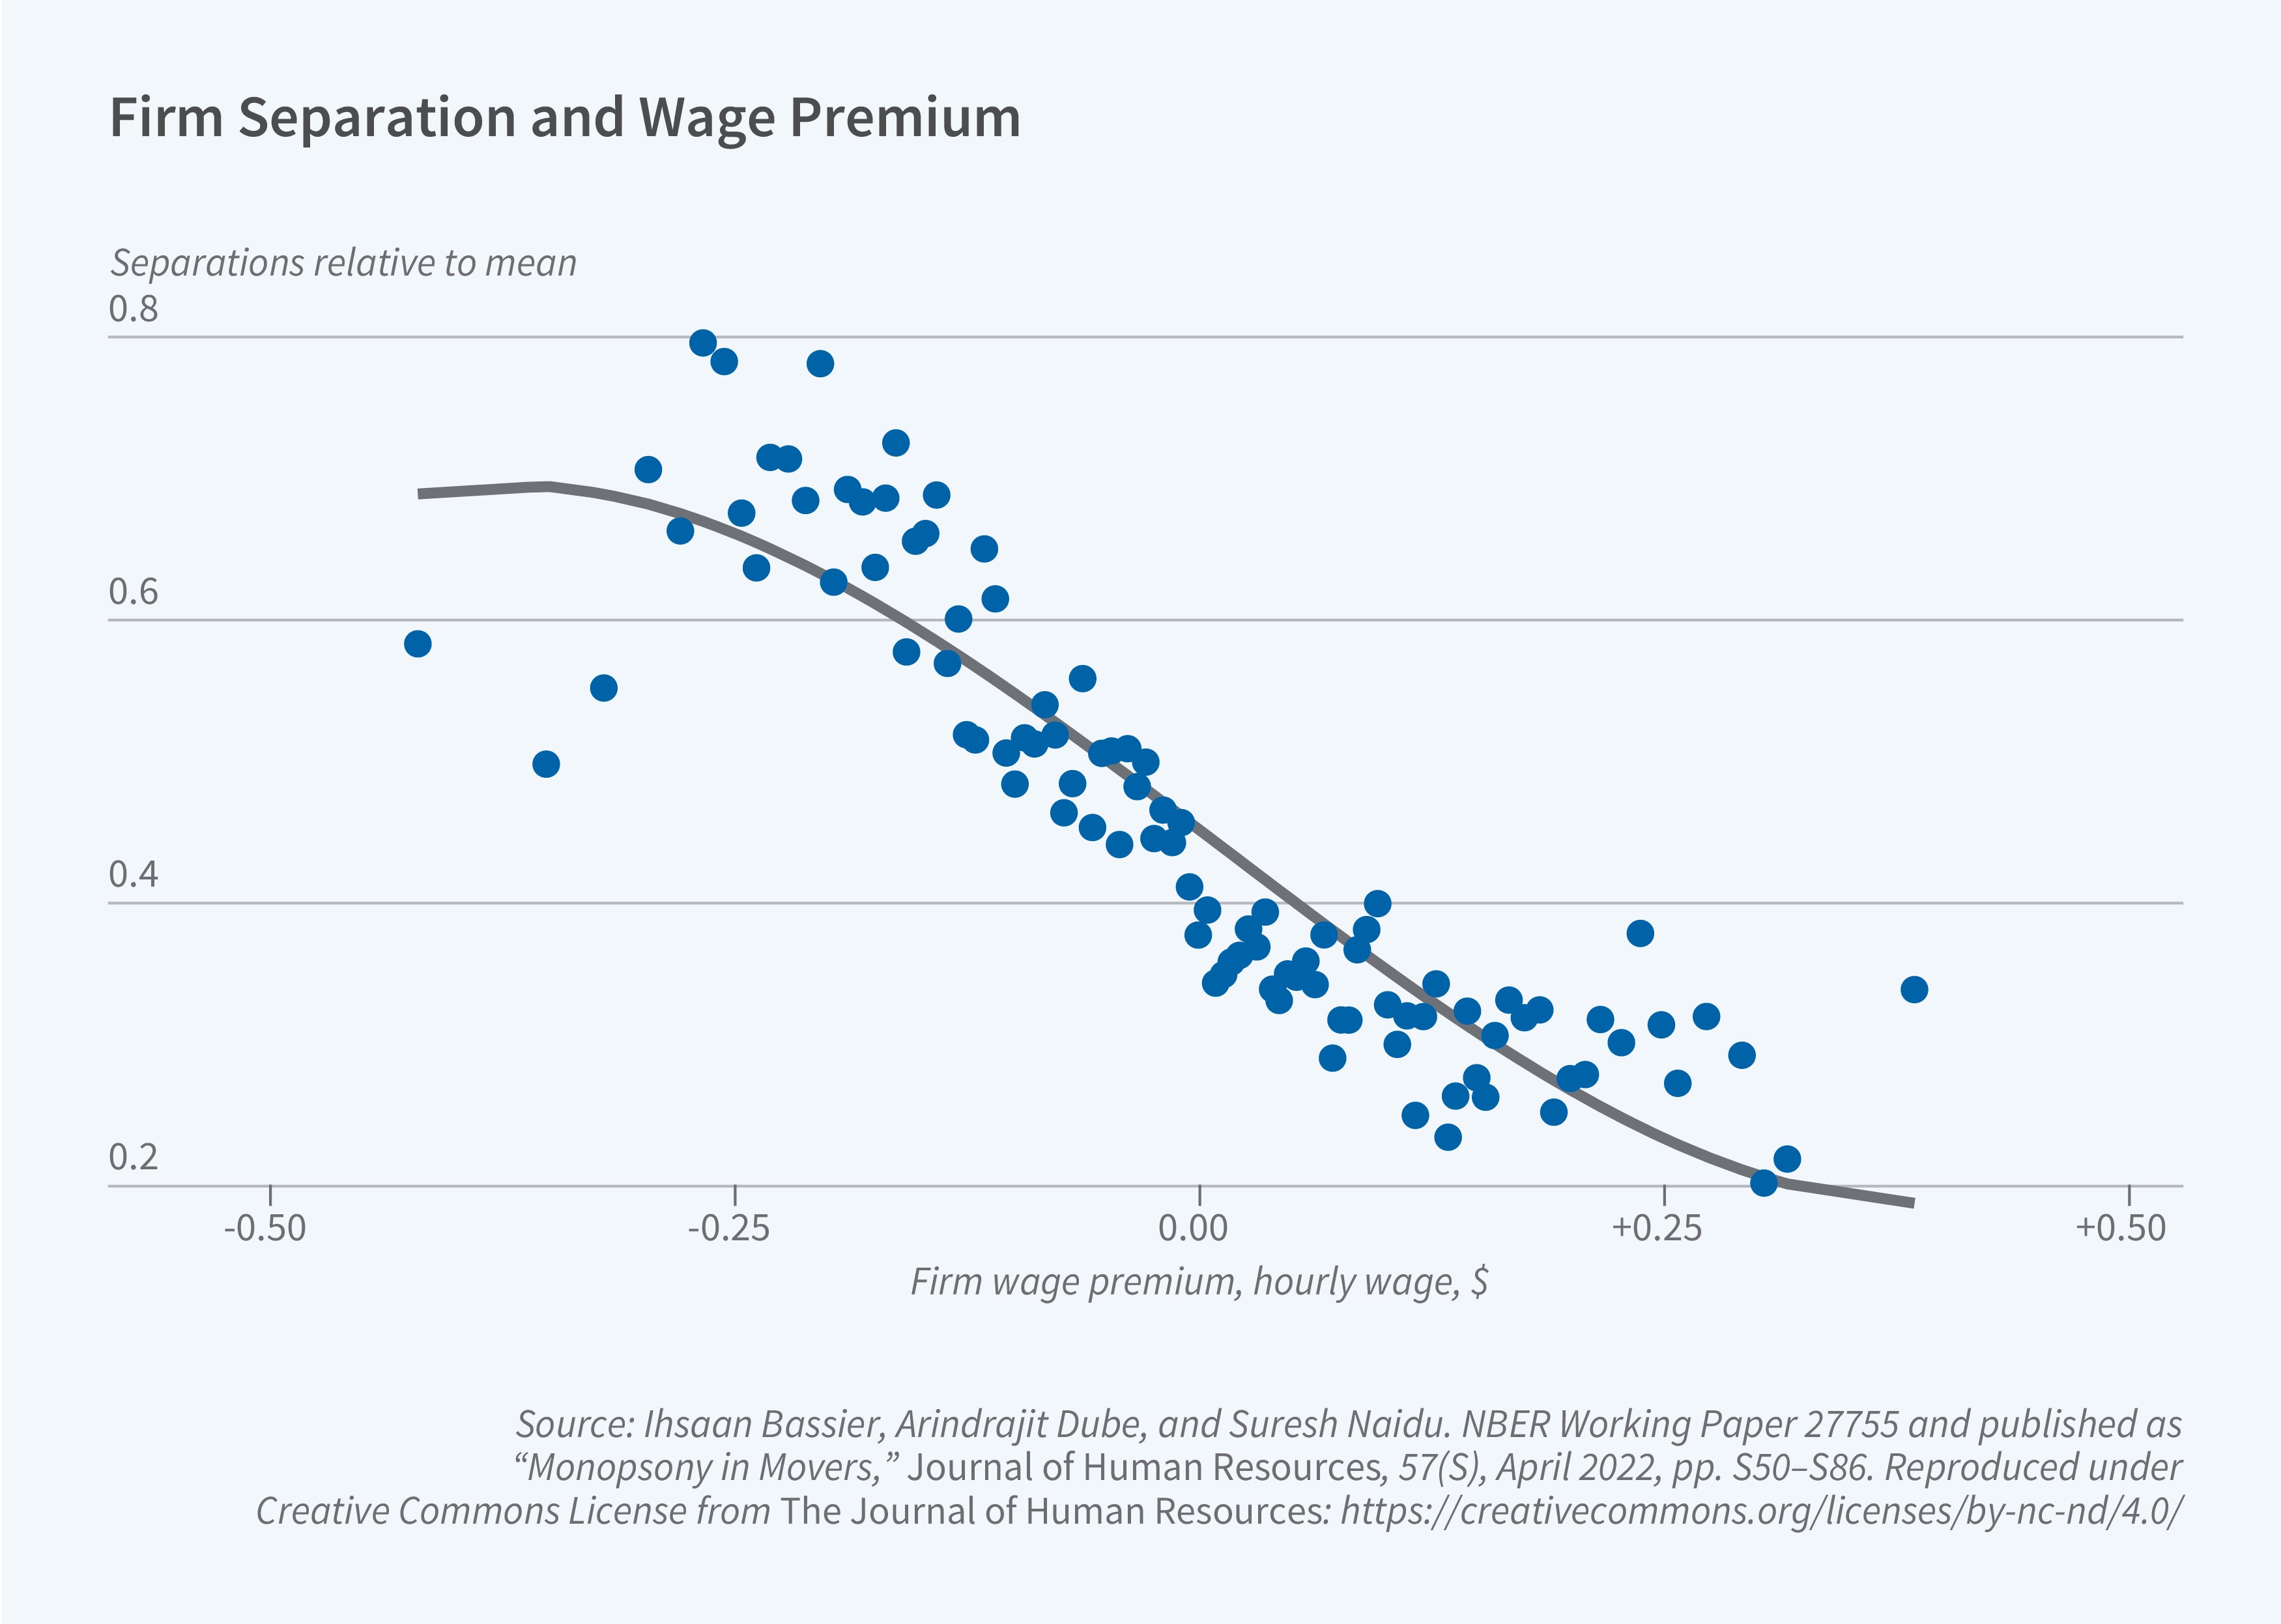
A central contribution of recent work has been innovative ways of measuring the magnitude of monopsony power. In a paper with Ihsaan Bassier, Dube, and Naidu, we focused on the responsiveness of employee quits in a firm to the wages offered by that firm.4 In a perfectly competitive labor market, a small increase in wages offered by one employer should attract workers and induce quitting at other firms. With monopsony power, however, firms have some leeway to set wages below competitive levels, as some workers might be reluctant to quit in search of other jobs due to frictions like search and moving costs. Therefore, as Alan Manning points out, the extent of monopsony can be inferred by observing whether quits fall sharply below or only slightly below what would be expected in a competitive model when a firm offers lower wages.5
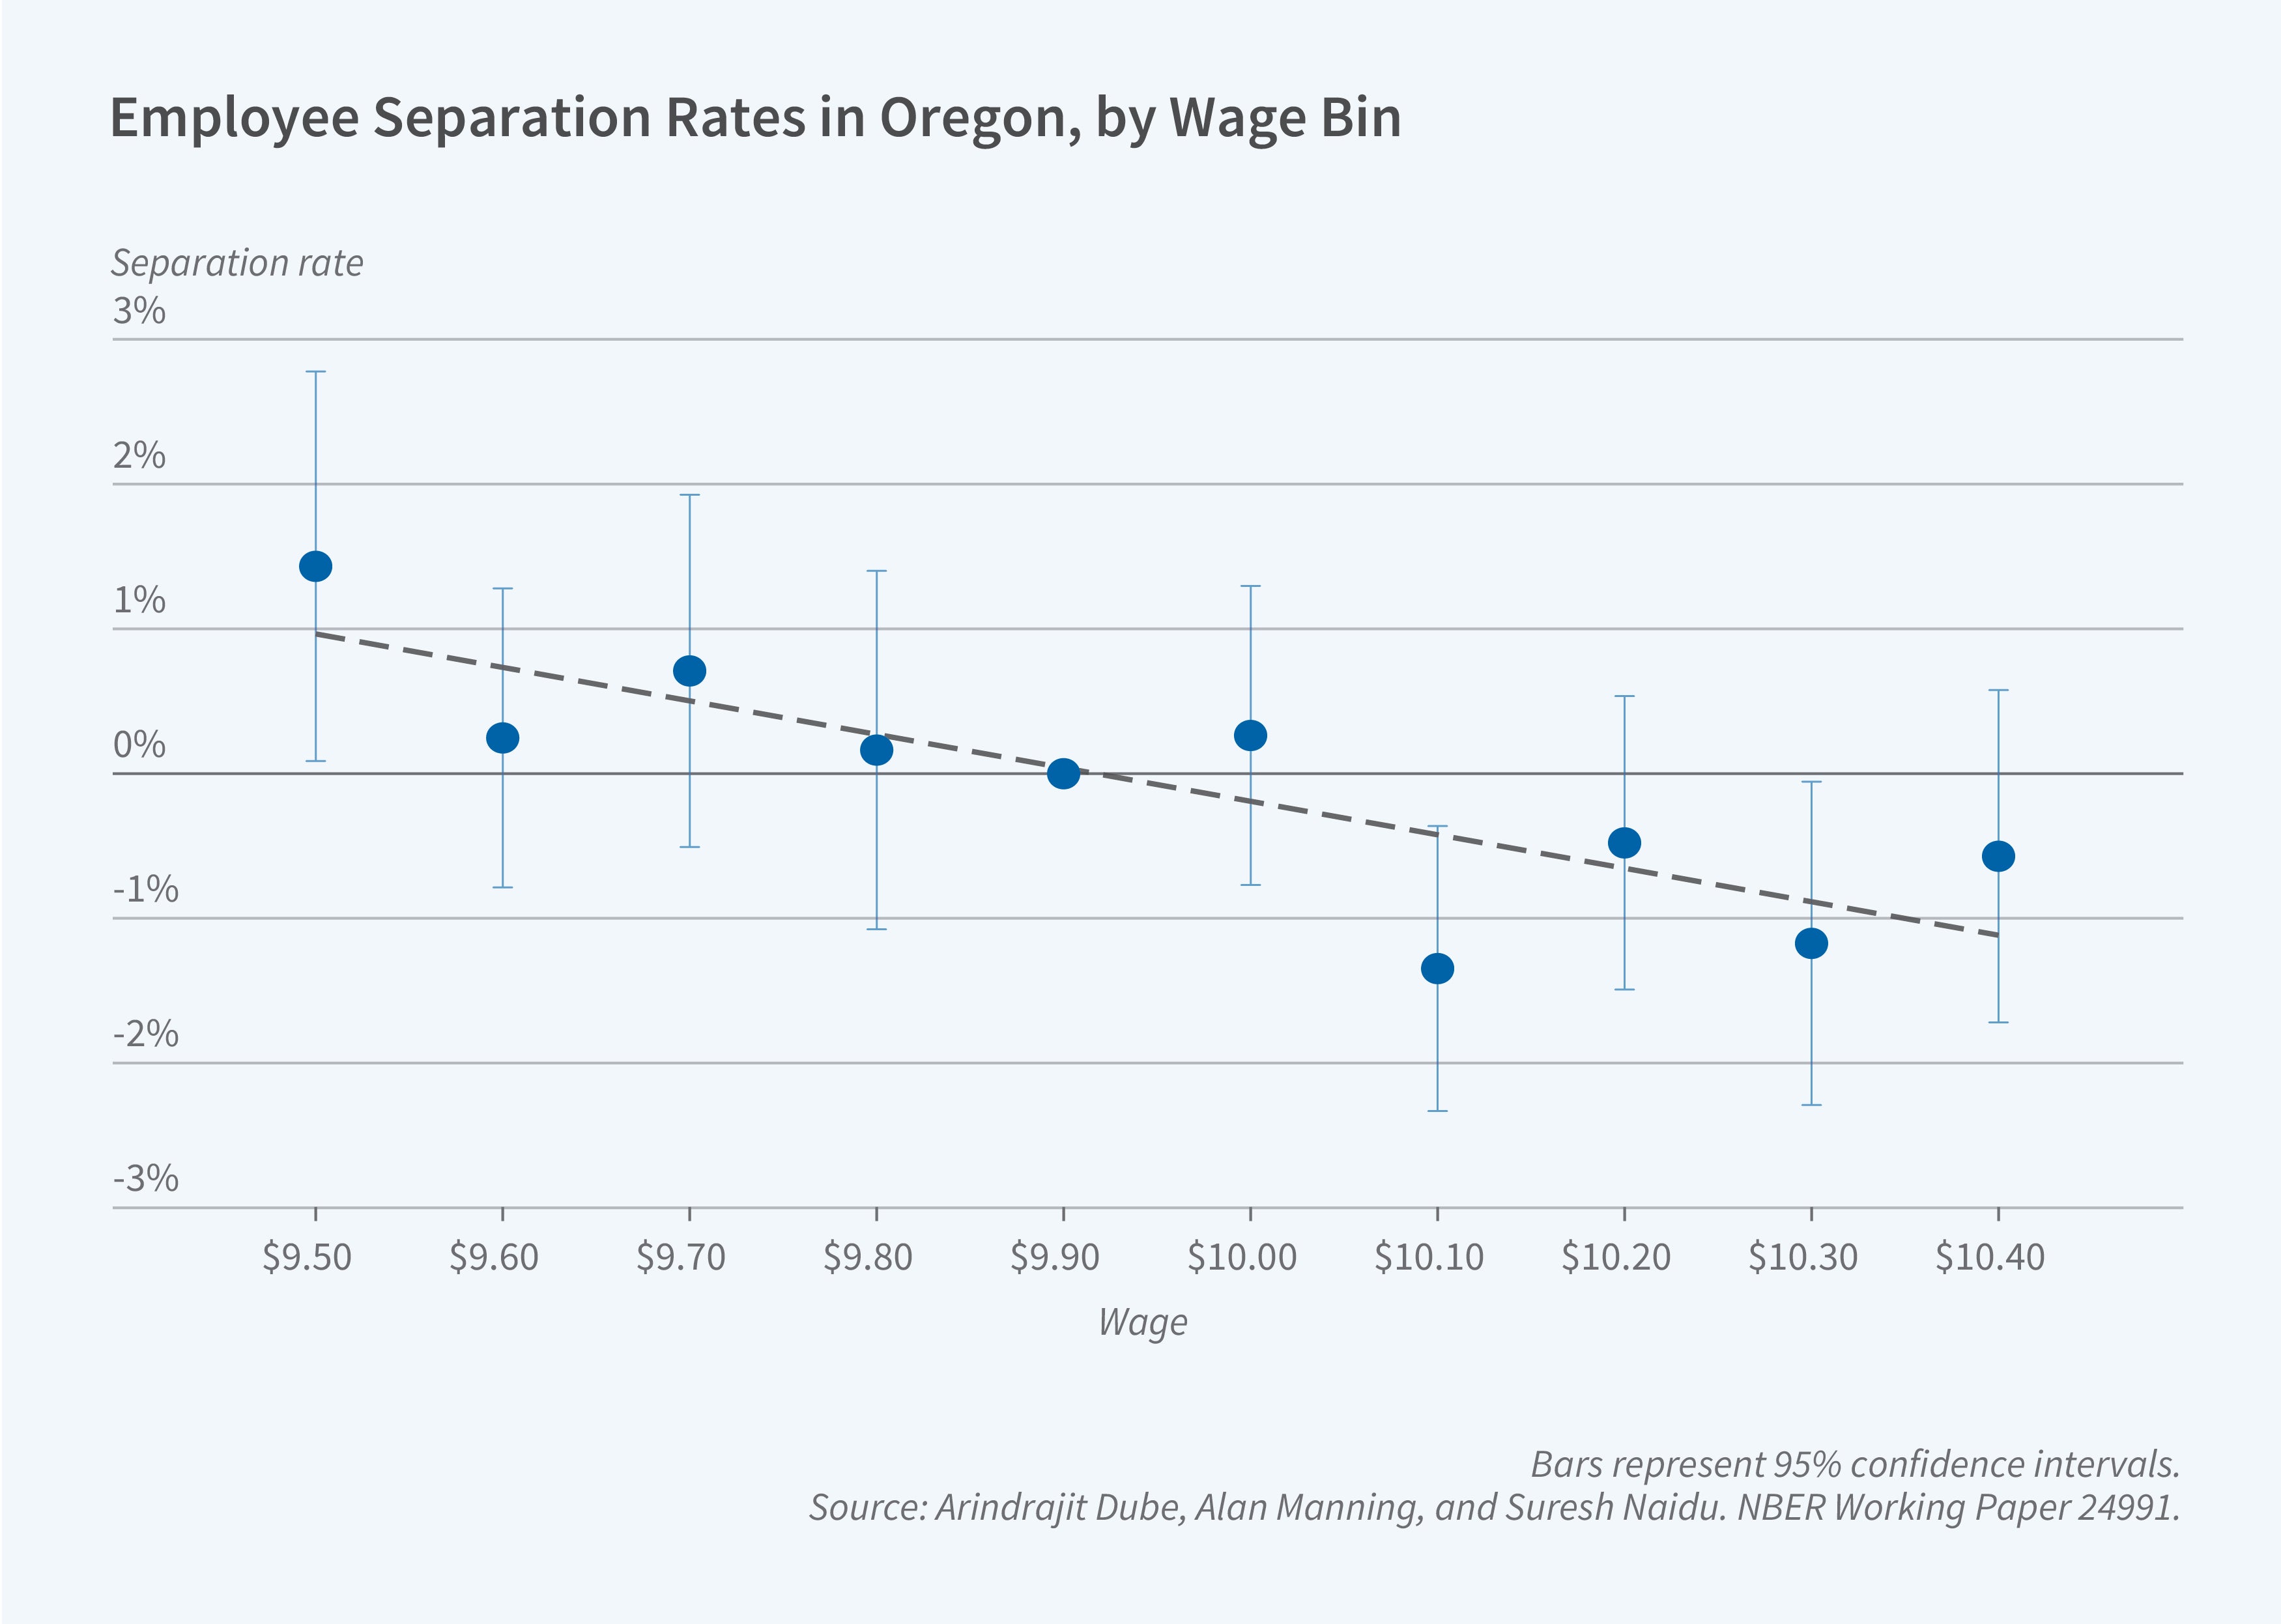
Using administrative employer-employee data from Oregon for information on hourly wages, we devised a matched event-study method in which we consider what happens when two otherwise similar workers initially working at the same firm leave and take jobs at other companies that pay somewhat different wages. Using this approach, illustrated in Figure 1, we estimate the responsiveness of future quits to the firms’ wage policies. Typically, if wages are around 10 percent higher, quits are 20–30 percent lower. Generally, this low sensitivity reveals that employers have flexibility in setting wages without fearing excessive turnover. This finding is remarkably consistent across industries, occupations, and geographical regions. Importantly, we find that the quit elasticity is smaller in magnitude for low-wage workers, a finding that has a bearing on designing policies like those for minimum wages.
The Evolution of Monopsony Power
Monopsony power is not static and is affected by macroeconomic conditions. Work by David Autor, Annie McGrew, and Dube highlights dramatic changes in labor market power during the post-pandemic period. An exceptionally tight low-wage labor market following the pandemic significantly enhanced competition.6 This is reflected in a sharp rise in the quit sensitivity to offered wages, particularly for workers without a college degree, as shown in Figure 2. As a result, workers left lower-paying employers to take better-paying positions, leading to a reinvigorated job ladder. It also likely facilitated the reallocation of workers from lower-productivity to higher-productivity firms.
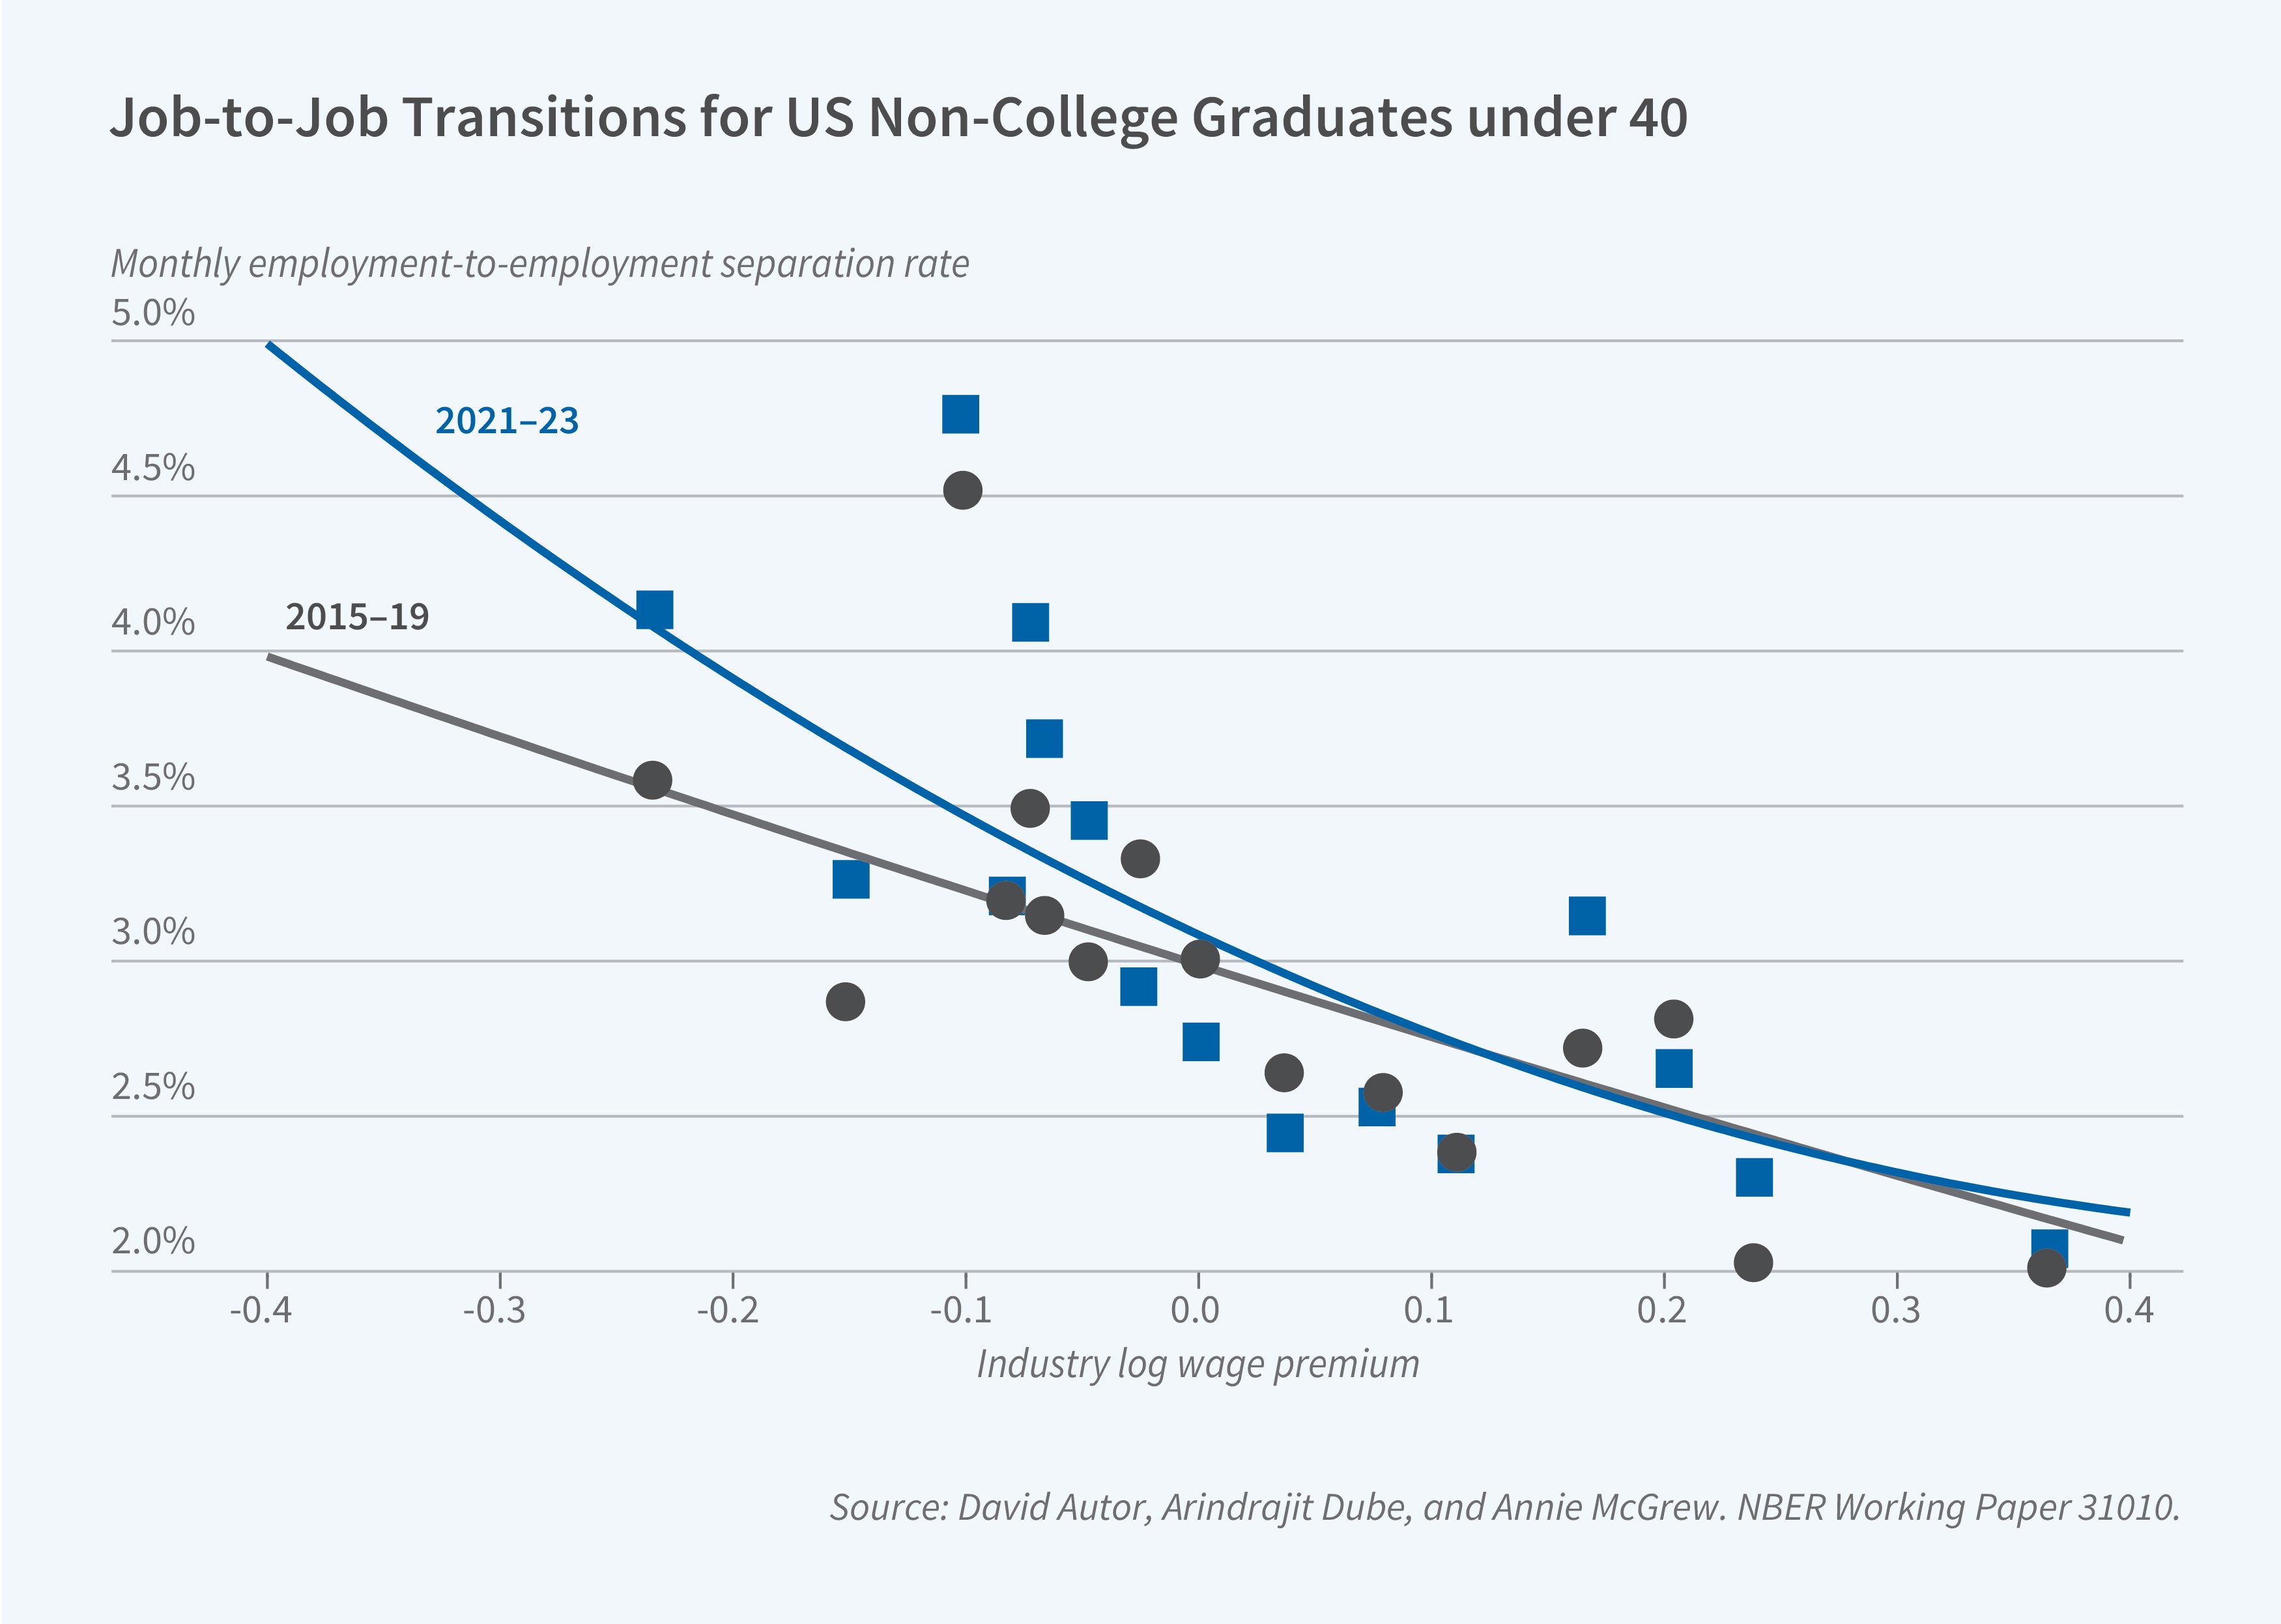
The heightened responsiveness of quits reduced wage inequality, as low-wage workers saw disproportionate gains. There has been remarkable compression in the 90-10 wage ratio since 2019. The changes of the past four years reversed roughly 40 percent of the increase in the 90-10 ratio between 1980 and 2019. Importantly, much of the compression took place via workers changing their jobs, not from changes in wages at current jobs, highlighting the role of heightened competition.
These findings underscore the importance of overall labor market tightness and macroeconomic policies in determining monopsony power and competition in the labor market, as well as workers’ leverage relative to their employers.
Monopsony and Nonwage Amenities
Beyond its immediate impact on wages, monopsony power also has important consequences for the provision of nonwage amenities by employers. Our study with Reich presents a theoretical framework for elucidating these implications.7 Under perfect competition, competitive forces in the product and labor markets shape optimal decisions for both wages and amenities. However, under monopsony, firms face a trade-off. For instance, if higher wages and the provision of a desired amenity are complements — workers value the amenity more when wages are high — then monopsonistic firms will systematically underprovide that amenity relative to the firms in a competitive market.
We test this idea empirically through stated preference experiments with employees at Walmart. We find that workers value various amenities, including some “dignity-based” amenities relating to fair treatment and predictable scheduling, and find that workers have a stronger appetite for such amenities when wages are higher, lending some support to the complementarity hypothesis.
Next, using variation within our data sample in the extent to which Walmart’s $11 per hour corporate minimum wage raised wages, we find that more binding minimum wage policies do not lead to a reduction in amenity provision, as might be expected if amenities acted as substitutes for wages. This aligns with the theoretical prediction that firms with monopsony power tend to underprovide amenities that are complementary with wages, especially softer amenities like workplace dignity.
Monopsony, Round-Number Wages, and Mispricing
Intriguingly, the presence of monopsony power can help explain unusual patterns observed in the labor market. The observation that many hourly wages cluster tightly around round numbers, like $10 or $15, has puzzled economists for years. While some explanations center around workers’ preference for whole numbers — left-digit bias — our recent research suggests a deeper connection to monopsony power and employer decision-making.
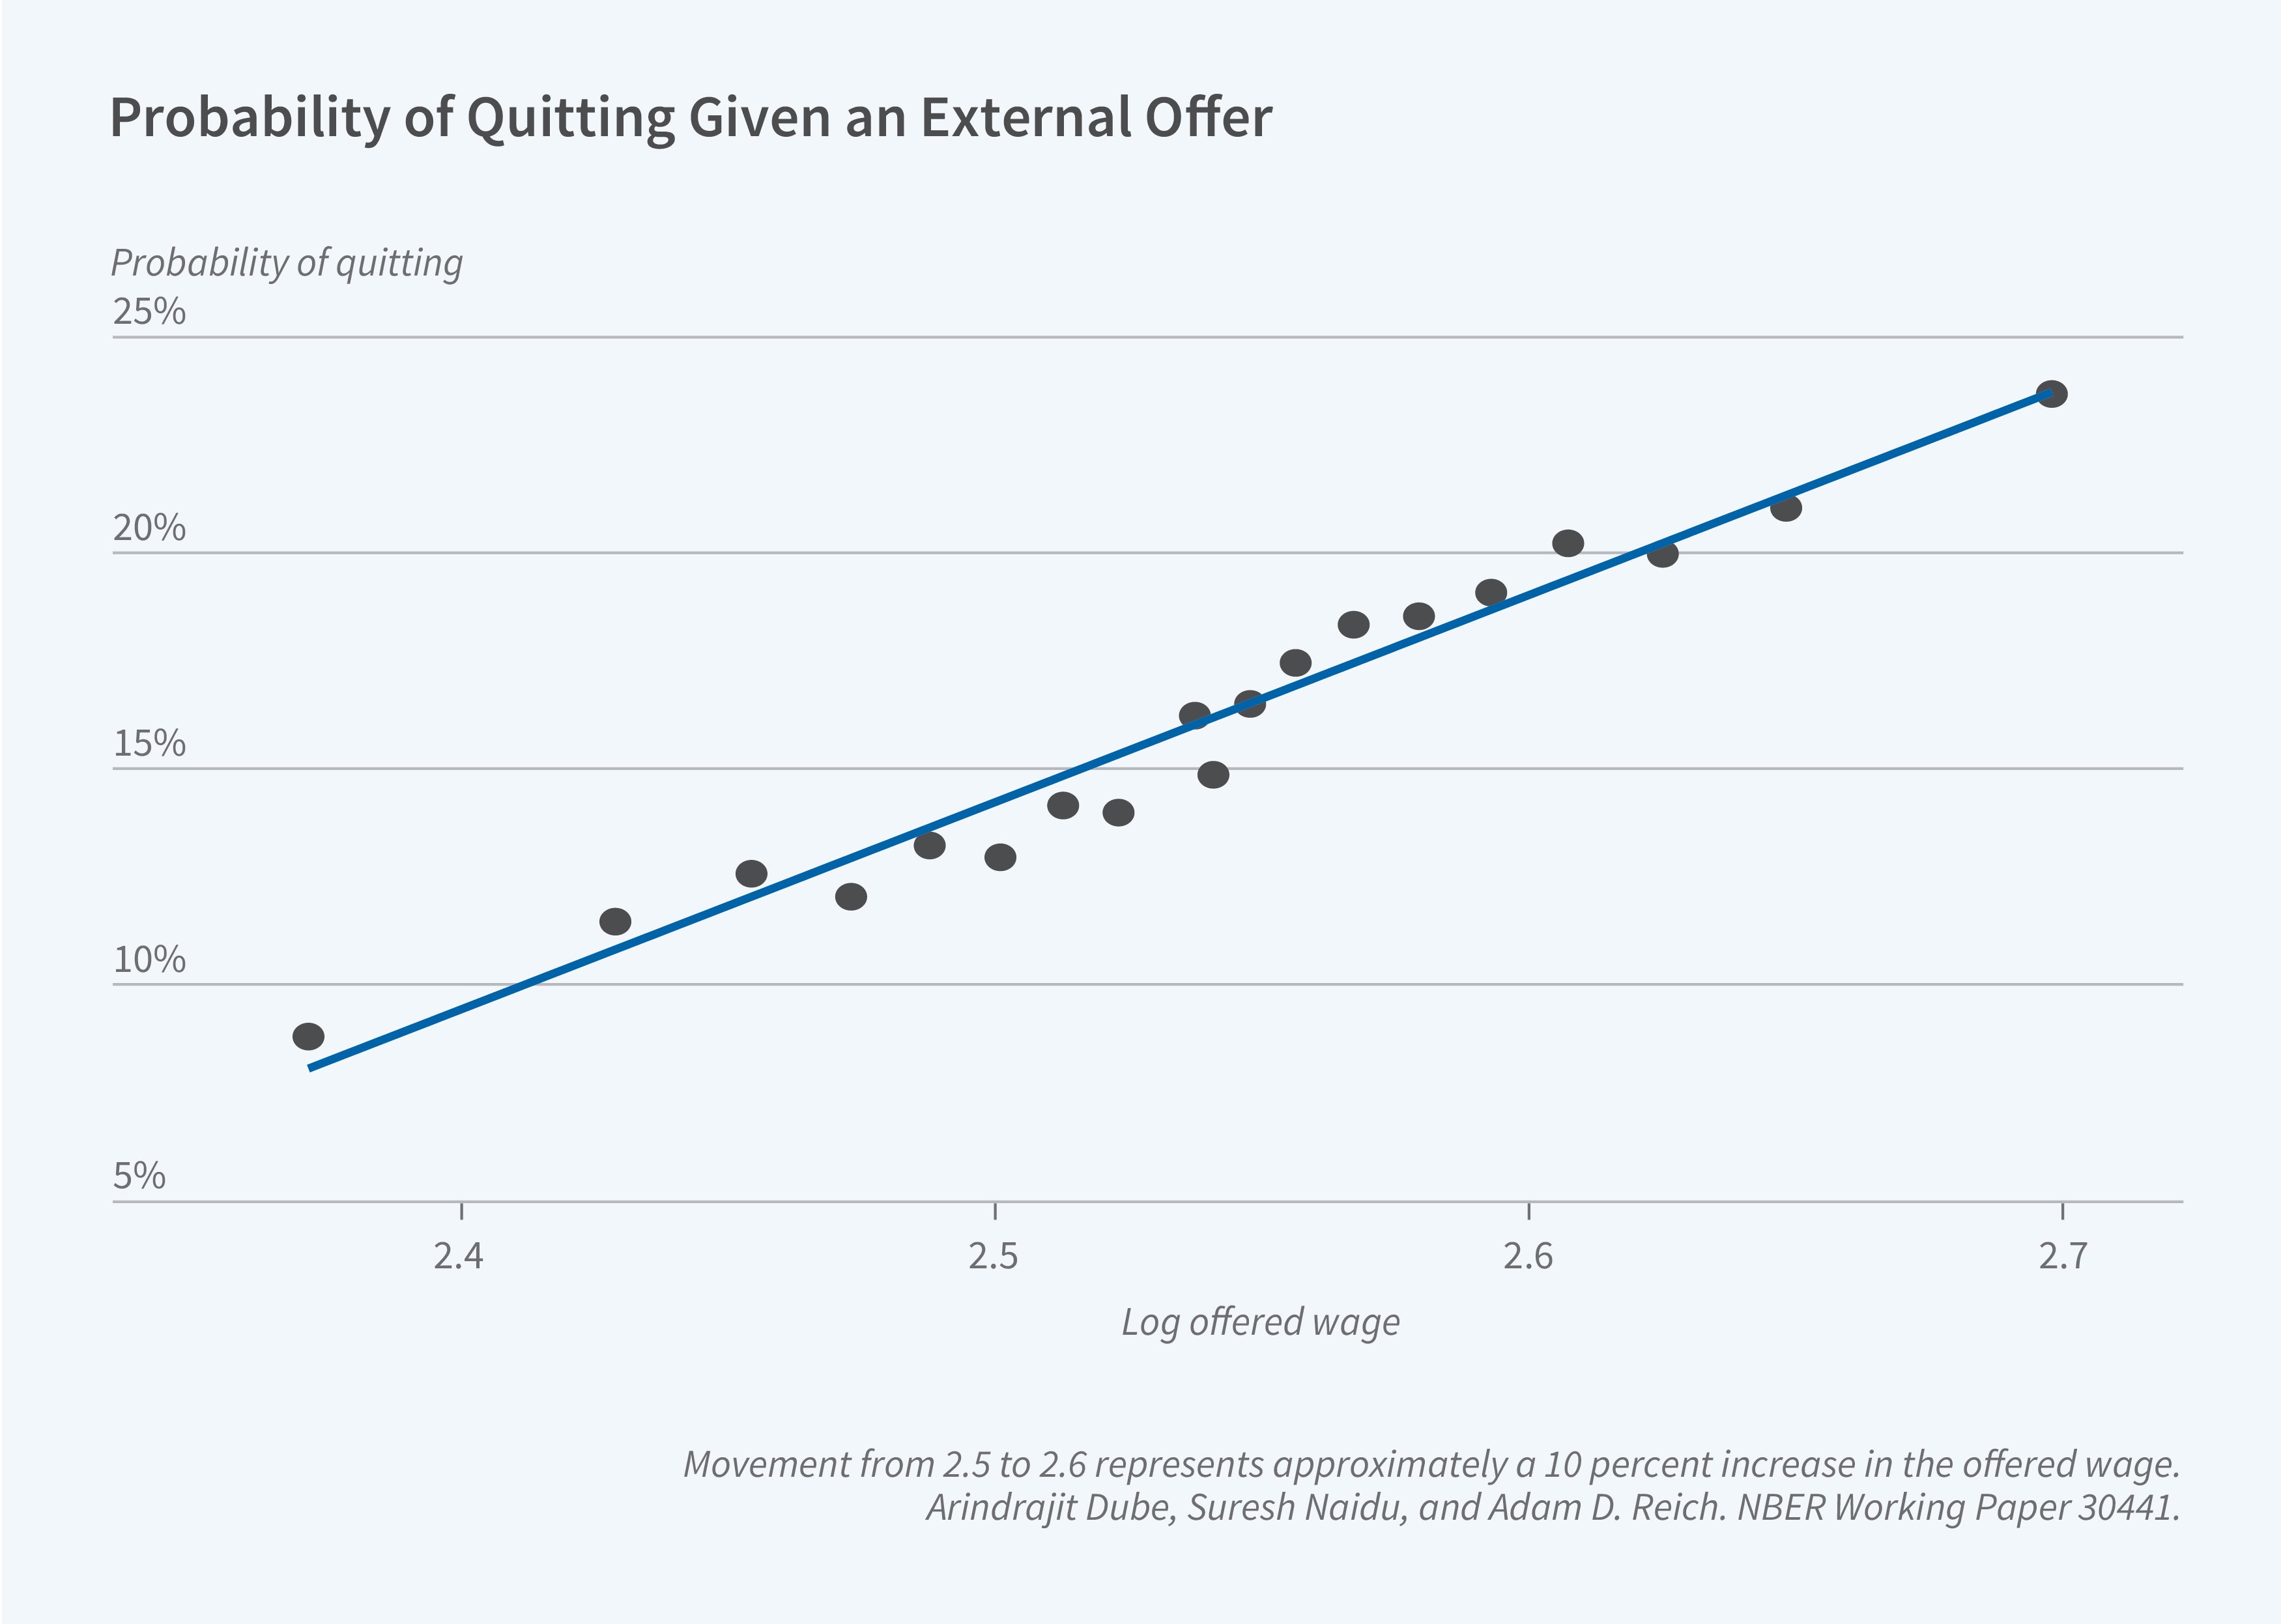
In work coauthored with Manning,8 we explored this connection, employing a three-pronged approach. The first step involved isolating the source of “round-number bunching.” In an online experiment using Amazon Mechanical Turk, we offered slightly different, nonround wages for identical tasks. If workers had a strong left-digit bias, there should have been a sharp increase in worker acceptance at the round-number wage compared to the just-below-round wage. However, we found no such discontinuity, suggesting workers did not treat round numbers differently. At the same time, we uncovered considerable monopsony power using experimental evidence in this online labor market, as acceptance rates were only modestly related to the offered wage.
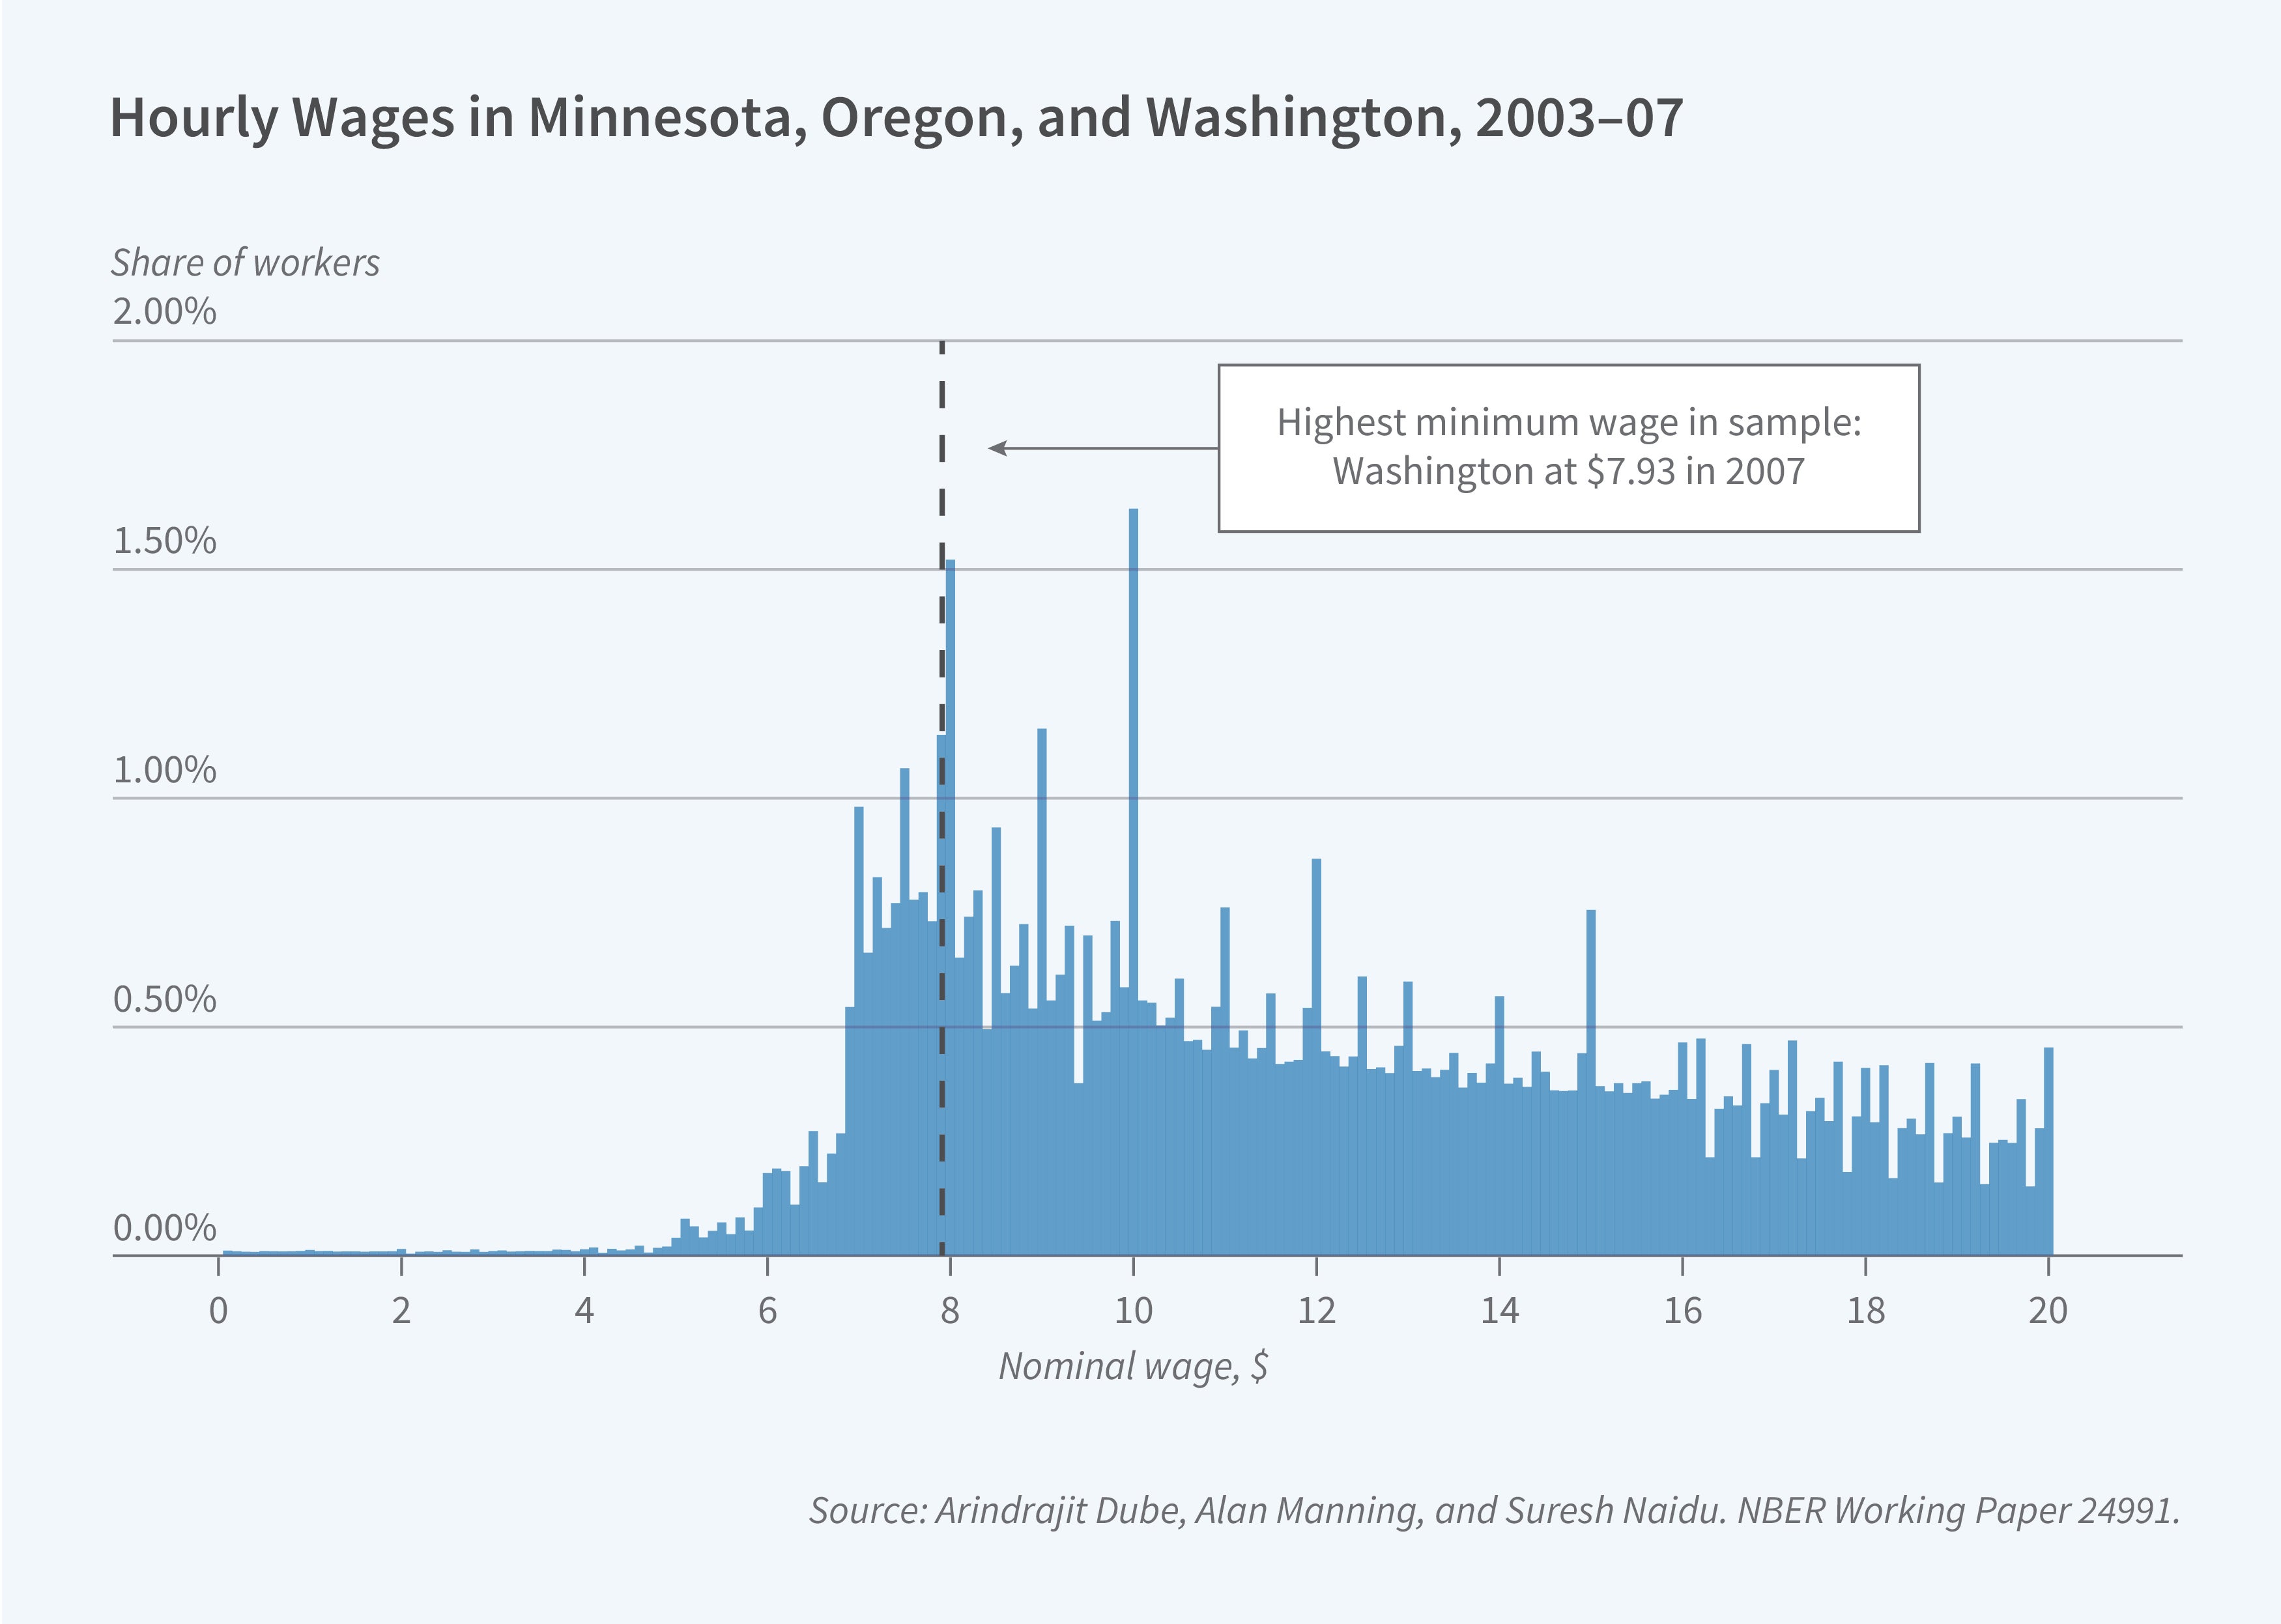
The lack of worker left-digit bias points to the possibility that the bunching may reflect employer preferences or mispricing. To assess this, we leveraged high-quality matched employer-employee data. If employers were strategically targeting round numbers due to worker preference, one would expect most of the “excess jobs” at the round-numbered wage — say, $10 — to be coming from below $10. However, empirically we found that the “missing jobs” were coming from both above and below $10, contradicting the left-digit bias explanation but consistent with employer mispricing. This showed that less-sophisticated employers were more likely to use round-numbered wages.
What is behind such mispricing? Some employers, particularly less sophisticated ones, might face optimization frictions, so round numbers might be a convenient, low-cost heuristic for setting wages. Critically, we show theoretically and empirically that such mispricing is much more likely to exist in markets with some monopsony power. In a competitive market, small deviations from the optimal wage result in significant profit losses, pushing firms towards precise wage setting. However, with monopsony power, the relationship between profits and wages becomes flatter around the optimal wage level. This flatter envelope means that even moderate deviations from the optimal wage might not significantly harm profits, allowing some firms to settle for the ease and familiarity of round numbers.
This research suggests that, beyond round numbers, clunky wage policies and quirky pay rules are easier to explain in labor markets with pervasive monopsony.
The Rebirth of Countervailing Power?
If monopsony is indeed pervasive, policies that offer countervailing power to employer-side monopsony can increase wages and improve the functioning of the economy. Policies that might provide countervailing power include antitrust policies to reduce concentration, macro policies to increase labor market tightness and quit elasticity, and minimum wages and collective bargaining to reduce employer wage-setting power. Whether these mechanisms work remains an empirical question. The good news for researchers seeking to answer this question is that policymakers are experimenting along many of these dimensions.
When minimum wages are imposed or raised, the number of low-productivity jobs may shrink, but labor market monopsony implies that high-productivity jobs will expand, and so the overall effect on employment will be small. This is consistent with recent evidence from work by Doruk Cengiz, Attila Lindner, Ben Zipperer, and Dube.9
An inherent limitation of a minimum wage policy is that it only affects the bottom of the wage distribution. Collective and sectoral wage bargaining between employers and democratic unions have the potential to improve efficiency, fairness, and the balance of power in the labor market more broadly. In the US, there is growing state-level experimentation with standards in the fast-food and healthcare sectors, for example, in California and Minnesota. These can offer important insights into the efficacy of sectoral standards in improving worker welfare in monopsonistic markets.
More directly, as discussed by Naidu, Eric Posner, and Glen Weyl, we are seeing increased use of antitrust tools to counter labor market concentration and explicitly anticompetitive practices.10 The most recent Department of Justice merger guidelines explicitly mention harms from labor market power, and the Federal Trade Commission has recently proposed a ban on noncompete clauses in employment contracts. We are also seeing private class-action lawsuits charging employers with unfair competition in the labor market, for example, the ongoing $1.6 billion suit filed by 1,200 fighters against Ultimate Fighting Championship.
Besides particular policies focused on wages and labor markets, underlying monopsony power moves with the broader macroeconomic environment. The role of tightness in reducing monopsony power raises the possibility that macro policy can move labor market power at a much broader level, and integrating this insight into the design of optimal monetary and fiscal policy may prove important.
These recent policy innovations, at scales ranging from firms to markets to whole economies, probe the feasibility of various modes of countervailing power. They complement a recent interest in the political economy of “predistribution” policies that intervene in the labor market, as contrasted with the traditional focus of economists on tax-and-transfer policies.11 These novel policies also provide economists with a host of naturally occurring experiments for learning about the forces shaping employer wage setting.
Sections of this summary draw substantially on a March 2024 article in the International Monetary Fund’s Finance & Development magazine, authored by Suresh Naidu.
Endnotes
Capitalism and Freedom, Friedman M. Chicago: University of Chicago Press, 1962.
“Monopsony in the Labor Market: New Empirical Results and New Public Policies,” Ashenfelter OC, Card D, Farber HS, Ransom M. NBER Working Paper 29522, November 2021.
Power and Dignity in the Low-Wage Labor Market: Theory and Evidence from Walmart Workers,” Dube A, Naidu S, Reich AD. NBER Working Paper 30441, September 2022.
“Monopsony in Movers: The Elasticity of Labor Supply to Firm Wage Policies,” Bassier I, Dube A, Naidu S. NBER Working Paper 27755, August 2020.
“The Real Thin Theory: Monopsony in Modern Labour Markets,” Manning A. Labour Economics 10(2), April 2003, pp. 105–131.
“The Unexpected Compression: Competition at Work in the Low Wage Labor Market,” Autor D, Dube A, McGrew A. NBER Working Paper 31010, November 2023.
“Power and Dignity in the Low-Wage Labor Market: Theory and Evidence from Walmart Workers,” Dube A, Naidu S, Reich AD. NBER Working Paper 30441, September 2022.
“Monopsony and Employer Mis-optimization Explain Why Wages Bunch at Round Numbers,” Dube A, Manning A, Naidu S. NBER Working Paper 24991, January 2020.
“The Effect of Minimum Wages on Low-Wage Jobs: Evidence from the United States Using a Bunching Estimator,” Cengiz D, Dube A, Lindner A, Zipperer B. NBER Working Paper 25434, January 2019.
“Antitrust Remedies for Labor Market Power,” Posner EA, Naidu S, Weyl G. Harvard Law Review 132(2), December 2018, pp. 536–601.
“‘Compensate the Losers?’ Economic Policy and Partisan Realignment in the US,” Kuziemko I, Longuet-Marx N, Naidu S. NBER Working Paper 31794, October 2023.


