The NBER Retirement and Disability Research Center
The NBER Retirement and Disability Research Center (RDRC) conducts research on issues relevant to Social Security policy. It is part of a national consortium of competitively selected research centers supported by the Social Security Administration (SSA) under five-year cooperative agreements. In addition to the NBER center, the consortium includes research centers at the University of Michigan, Boston College, and the University of Wisconsin. The consortium helps inform the national debate on retirement and disability policy by providing rigorous evidence relevant to Social Security programs and their effects in the population. Consortium research is regularly used by the SSA and Congress to inform policy decisions.
The current RDRC was created in 2018 from the merger of NBER’s Retirement Research Center (2003–18) and Disability Research Center (2012–18). It receives funding for between 15 and 20 new research projects each year. Projects last one year, with multiyear agendas proceeding as a sequence of one-year projects. More than 80 researchers are currently involved in RDRC projects. In addition, the RDRC has a training program that supports two graduate student fellows and two postdoctoral fellows each year, organizes workshops and conferences, and disseminates research findings through the NBER Bulletin on Retirement and Disability.
The center’s research agenda addresses five broad research themes as well as special topics that reflect current SSA priorities. They are 1) enrollment trends and determinants, 2) measuring sources of income and adequacy, 3) labor force participation, 4) program operations, and 5) related programs and program interactions. Special topics include the opioid epidemic and, most recently, the COVID-19 pandemic. This report highlights some recent research projects that have been carried out under the auspices of the RDRC. They represent only a small fraction of the large body of work by RDRC researchers.
Enrollment Trends and Determinants
One of the most hotly debated issues in disability policy has been the sources of Social Security Disability Insurance (SSDI) caseload growth over the last several decades. Has growth been a consequence of population health, economic factors, or demographics? Jeffrey Liebman sheds light on this debate by showing that the sources of program growth differed over time. From 1985 to 1993, the period immediately following the 1984 Social Security amendments, nonhealth factors such as economic incentives were the primary drivers of growth, with demographic factors playing little role. But from 1993 to 2007, demographic factors, such as population aging and women attaining insured status, accounted for two-thirds of the growth, while nonhealth factors such as economic incentives accounted for just one-third.1
Education is an important mediating factor for SSDI enrollment. James Poterba, Steven Venti, and David Wise estimate a disability insurance (DI) participation rate of 12.3 percent for women aged 50–61 with less than a high school diploma, but only 2.4 percent for women with a college degree for the period 1992–2012.2 The gap is even larger among men, with a DI participation rate of 16.9 percent among those without a high school diploma compared to just 2.6 percent among college graduates. About three-quarters of the education-participation gap among women is explained by differences in health, while health differences explain only 38 percent of the gap among men.
One highly relevant measure of population health for Social Security’s programs is life expectancy. Raj Chetty, Michael Stepner, Sarah Abraham, Shelby Lin, Benjamin Scuderi, Nicolas Turner, Augustin Bergeron, and David Cutler analyze 1.4 billion de-identified tax records for the US population to investigate the association between income and life expectancy.3 The researchers document wide variation in life expectancy by income and geography, finding that the gap in life expectancy between the richest and poorest 1 percent is 14.6 years for men and 10.1 years for women. Moreover, between 2001 and 2014, life expectancy among those in the top 5 percent of the income distribution grew by approximately 2.5 years, while life expectancy at the bottom of the income distribution grew very little.
Many RDRC studies have sought to understand enrollment trends by investigating geographic variations in DI application and participation. Research by John Friedman, Ithai Lurie, and Magne Mogstad finds that adult children from lower-income families have widely varying probabilities of DI enrollment depending on where they grew up.4 For example, the largest concentration of highest-DI enrollment areas is in New England, while the lowest-DI areas are in California, in or bordering Texas, and in New York City. In striking contrast, adult children from higher-income families show little geographic variation in their DI enrollment rate. Studying the effect of moving across places as a way of learning how place affects DI application, the researchers find that about 30 percent of the place-based differences are causal.
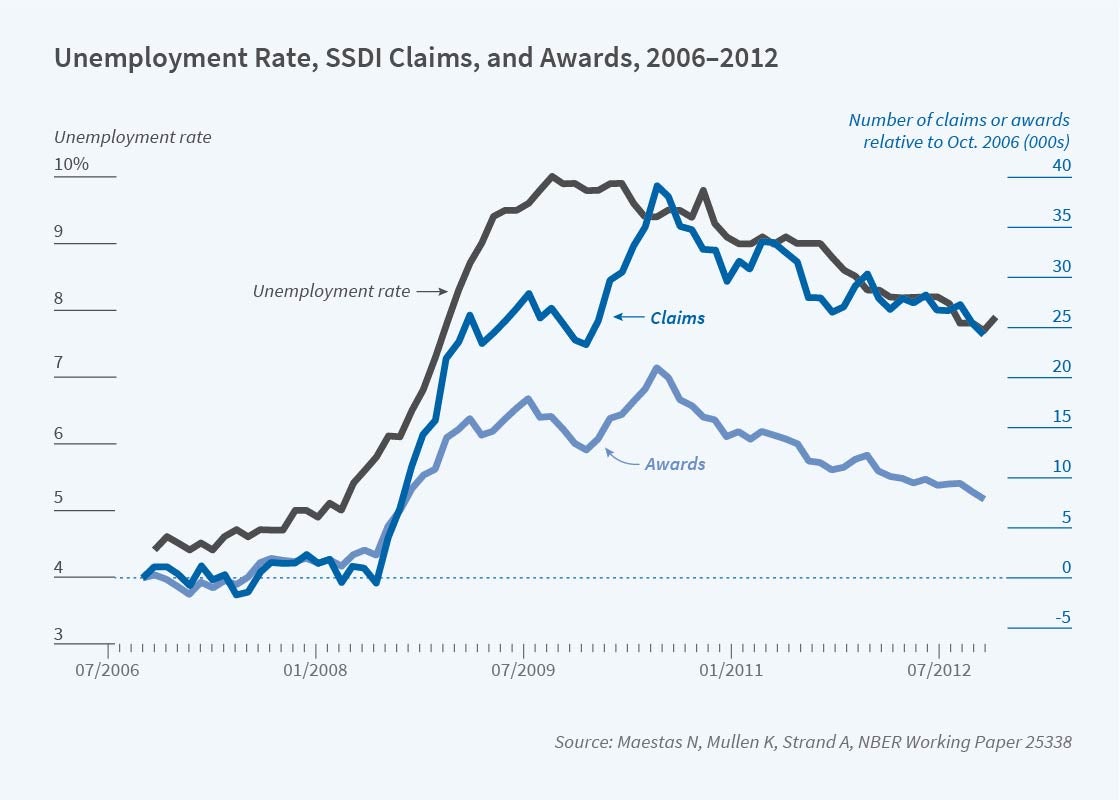
A substantial fraction of the geographic variation in DI rates can be explained by local labor market conditions. For example, Kathleen Mullen, Alexander Strand, and I find that the Great Recession led 1.4 million former workers to apply for DI benefits during 2008–2012; nearly 1 million (72 percent) were induced in the sense that they otherwise would not have applied, while the rest (28 percent) would have applied anyway, and the timing of their application was accelerated.5 These induced enrollments amount to more than 400,000 incremental beneficiaries with estimated DI benefit obligations of $55 billion in present value. Including the value of Medicare benefits for which these DI beneficiaries are eligible, the cost is nearly $100 billion.
Measuring Sources of Income and Adequacy
RDRC research projects have examined income adequacy for beneficiaries of Social Security programs. As just one recent example, John Beshears, James Choi, Christopher Clayton, Christopher Harris, David Laibson, and Brigitte Madrian calculate the socially optimal level of illiquidity in a retirement savings system in which households have heterogeneous present bias.6 Remarkably, they find that the social optimum is well approximated by a system like that in the US, where there are three accounts: a completely liquid savings account, a completely illiquid account like Social Security, and a partially liquid account, such as a 401(k) account with an early withdrawal penalty.
Chetty, Friedman, Søren Leth-Petersen, Torben Heien Nielsen, and Tore Olsen investigate active versus passive savings behavior using features of the retirement savings system in Denmark and detailed administrative data.7 They find that 85 percent of individuals are passive savers who do not respond to savings incentives. As a result, policies such as automatic contributions to retirement accounts, which require no action on the part of individuals, result in greater wealth accumulation than do policies such as tax subsidies, which require individuals to take action to take advantage of the subsidy.
Income adequacy for disability beneficiaries has also been a focus of attention, in particular families who receive SSI payments for children with disabilities. Manasi Deshpande finds evidence that SSI payments have a stabilizing effect on household incomes, among other benefits; when children are removed from the program, parents fully replace lost benefits with earnings.8
Labor Force Participation
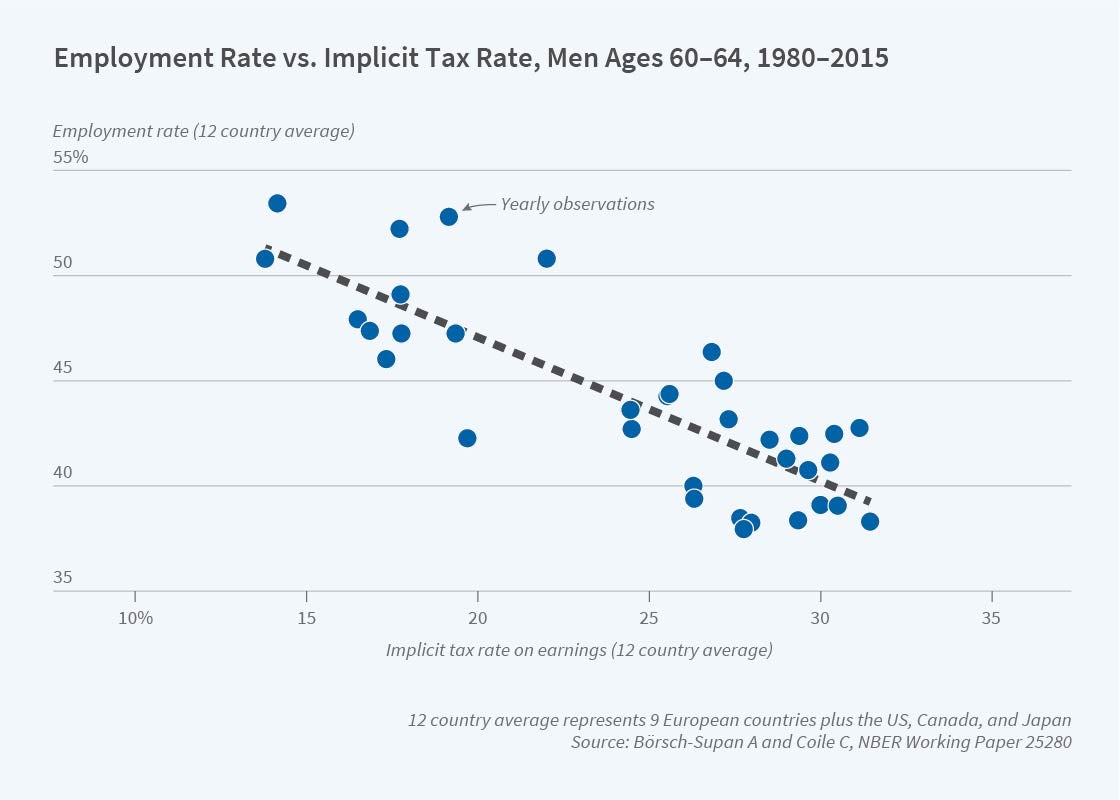
Labor force participation is another major area of RDRC research. Researchers have investigated population trends in labor force participation, which affect the financing of SSA programs, as well as the disincentive effects of Social Security policies on labor supply. Axel Börsch-Supan and Courtney Coile are leading a long-running cross-national project investigating the relationship between social security policies and labor force participation at older ages. They find that Social Security reforms in the US and 11 other high-income countries during the last three decades reduced the effective tax on work at older ages, which provides a partial explanation for the rise in labor force participation at older ages that has occurred in these countries since 1990.9
Contract work is increasingly common at older ages, and is often undercounted in traditional surveys. Katharine Abraham, Brad Hershbein, and Susan Houseman find that self-employment is more prevalent at older ages than suggested by traditional surveys when contract work is accounted for. The share of employed workers whose main job is self-employment rises monotonically with age, from 20 percent at ages 18–49 to 68 percent for those ages 75–79.10 The self-employed are most commonly independent contractors, with one-quarter of independent contractors age 50 and older working for a former employer.
Richard Frank, Sherry Glied, Keith Marple, and Morgan Shields examine how changes in the nature of work have impacted the employment rate of people with mental illnesses. They find that over the past 20 years, people with serious mental health conditions have been less likely to work in part because the jobs they have traditionally held have been most at risk of being eliminated by mechanization and artificial intelligence.11
Rates of workplace accommodation for US workers with disabilities are understood to be quite low, despite the legal requirement of the Americans with Disabilities Act. Mullen, Stephanie Rennane, and I find that measurement issues in survey data are partly to blame. We estimate that the rate of accommodation availability among individuals who are employed and for whom accommodation does or would increase the ability to work is 56 percent to 65 percent — two to three times higher than rates estimated in the existing literature.12 Although this estimated unmet need for accommodation is lower than previous estimates, it is still economically large.
David Autor, Mogstad, Andreas Ravndal Kostøl, and Bradley Setzler estimate the causal effects of DI receipt in Norway on earnings, household income, consumption, and fiscal costs. Among other findings, DI benefits raise average household income and consumption expenditures by 16 and 18 percent, respectively, providing new evidence of the consumption smoothing benefits of disability payments.13 Most interesting, however, are sharp variations by marital status: income and consumption rise by 40 percent among unmarried applicants, but not at all among married applicants because of offsetting spousal labor supply adjustments.
Program Operations
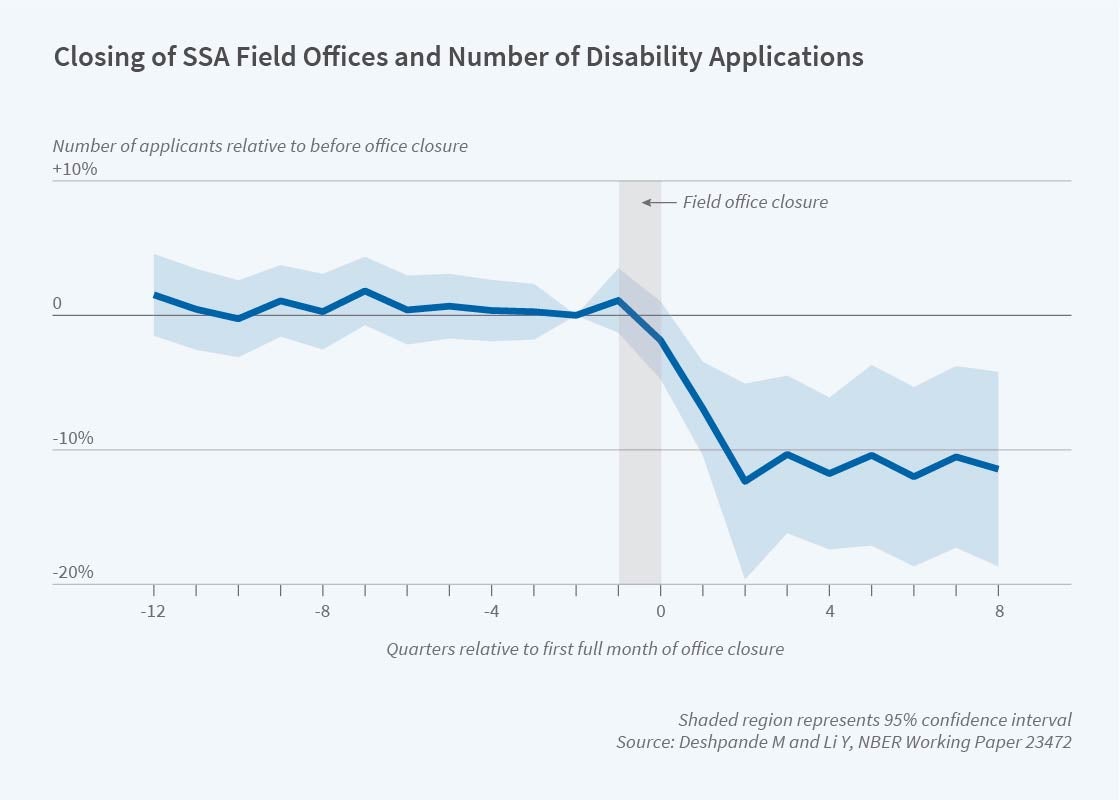
Deshpande and Yue Li investigate application costs and target efficiency in the context of the SSDI program. They find that closing a Social Security field office leads to a persistent 16 percent decline in the number of SSDI beneficiaries in the surrounding communities. However, disability applications fall by only 10 percent, and congestion increases at neighboring offices.14
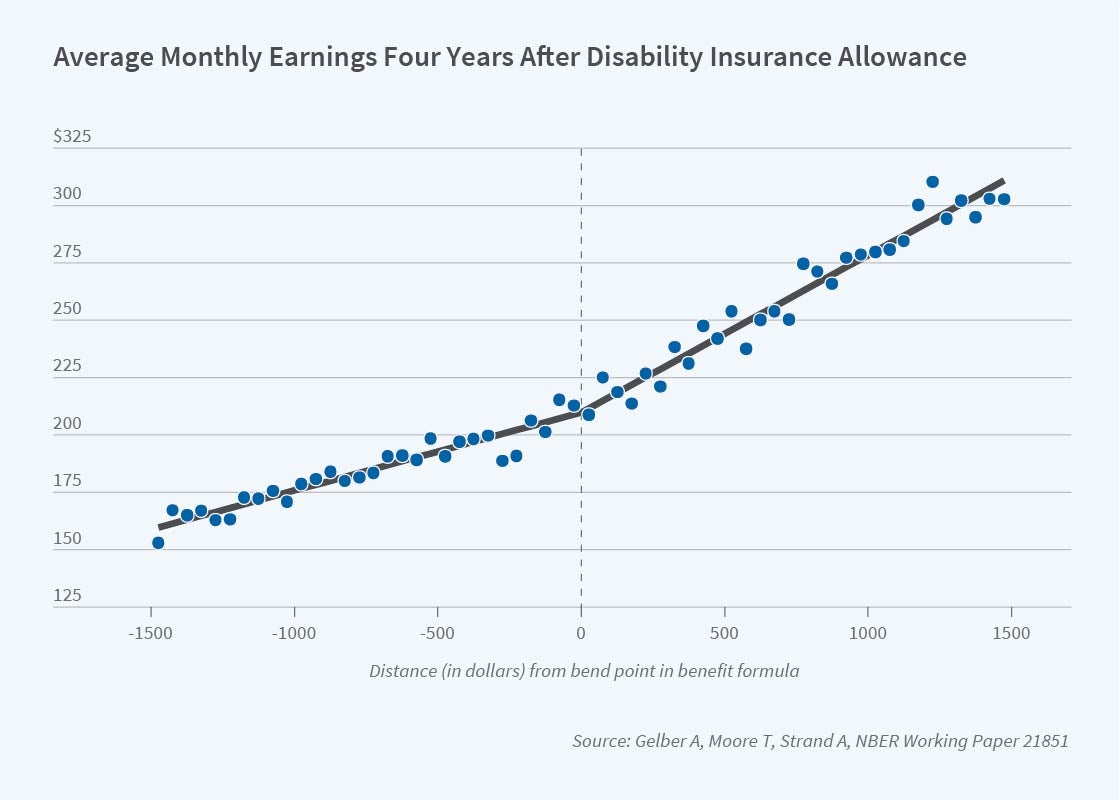
Several RDRC projects have examined the labor supply effects of Social Security program parameters and rules, such as the SSDI benefit amount or rules that impose an implicit tax on earnings in disability and retirement programs. For instance, Alex Gelber, Timothy Moore, and Alexander Strand find that as SSDI benefits rise by one dollar, earnings fall by only three cents.15 Gelber, Damon Jones, Daniel Sacks, and Jae Song use administrative data to revisit the effect of the Social Security annual earnings test on labor supply. They find that the earnings test reduces the employment rate of workers ages 63–64 by at least 1.2 percentage points.16 Kostøl and Mogstad analyze a benefit offset program introduced in Norway in 2005 that allowed beneficiaries to keep more of their earnings by reducing their benefits by approximately $0.60 for every $1 earned above an exempt threshold. They find the benefit offset increased the labor force participation of beneficiaries by 8.5 percentage points and reduced program costs.17
Related Programs and Program Interactions
Potential interactions between the SSDI program and other programs, such as unemployment insurance, have been of considerable interest. Focusing on the Great Recession, Andreas Mueller, Jesse Rothstein, and Till von Wachter explore whether individuals are more likely to apply for SSDI benefits once their eligibility for unemployment benefits is exhausted. They find no indication that the expiration of unemployment benefits causes SSDI applications to rise.18
RDRC projects have also investigated retirement and disability programs that have different program rules than Social Security programs. One such program is Disability Compensation (DC) from the Department of Veterans Affairs, where, in sharp contrast to the SSDI program, DC benefits are paid regardless of other earnings. Focusing on a reform that raised DC benefits for some veterans and not others, Coile, Mark Duggan, and Audrey Guo find that veterans who were eligible for higher DC benefits reduced their labor force participation, hours of work, and earned income relative to those who were not.19 But self‐employment among those with a benefit increase rose by 4.1 percentage points relative to those without an increase, offsetting a decline of 6.5 percentage points in wage and salary work.
Special Topics
Public health crises have wide ramifications for Social Security programs. The coming year will see new RDRC research on the impacts of the COVID-19 pandemic. In recent years, however, researchers have focused on the opioid epidemic. Cutler, Ellen Meara, and Susan Stewart investigate whether expanded use of opioid therapy to treat pain led to reduced participation in the SSDI program. They find little variation over time in the proportion of those diagnosed with back pain who enroll in DI, despite the dramatic rise in use of opioids.20 In other words, if opioids made back pain less debilitating, their increasing use did not translate into reductions in DI participation. Rather, a closely related paper by these researchers finds that a 30 percent rise in opioid shipments to a state is associated with a 5 percent increase in DI applications.21 The percentage of DI beneficiaries receiving high-dosage opioid drugs varies dramatically across states, from 1.6 percent to 11.5 percent. Amy Finkelstein, Matthew Gentzkow, and Heidi Williams estimate that a quarter of the variation in opioid abuse among SSDI beneficiaries is explained by place-specific factors such as local supply and behavior of physicians.22
Endnotes
“Understanding the Increase in Disability Insurance Benefit Receipt in the United States,” Liebman J. Journal of Economic Perspectives 29(2), Spring 2015, pp. 123–150.
“The Long Reach of Education: Health, Wealth, and Disability Insurance Participation,” Poterba J, Venti S, Wise D. NBER DRC Working Paper NB15-01, June 2016.
“The Association between Income and Life Expectancy in the United States, 2001-2014,” Chetty R, Stepner M, Abraham S, Lin S, Scuderi B, Turner N, Bergeron A, Cutler D. Journal of the American Medical Association 315(16), April 2016, pp. 1750–1766.
“Geographic Differences in Disability Insurance Rates,” Friedman J, Lurie I, Mogstad M. NBER DRC Working Paper NB17-01, September 2017.
“The Effect of Economic Conditions on the Disability Insurance Program: Evidence from the Great Recession,” Maestas N, Mullen K, Strand A. NBER Working Paper 25338, December 2018.
“Optimal Illiquidity,” Beshears J, Choi J, Clayton C, Harris C, Laibson D, Madrian B. NBER Working Paper 27459, July 2020.
“Active vs. Passive Decisions and Crowd-Out in Retirement Savings Accounts: Evidence from Denmark,” Chetty R, Friedman J, Leth-Petersen S, Nielsen TH, Olsen T. The Quarterly Journal of Economics 129(3), August 2014, pp. 1141–1219.
“The Effect of Disability Payments on Household Earnings and Income: Evidence from the SSI Children’s Program,” Deshpande M. Review of Economics and Statistics 98(4), October 2016, pp. 638–654.
“Reforms and Retirement Incentives: Introduction and Summary,” Börsch-Supan A, Coile C. In Social Security Programs and Retirement around the World: Reforms and Retirement Incentives, Börsch-Supan A, Coile C, editors, pp. 1–42. Chicago: University of Chicago Press, 2021.
“Contract Work at Older Ages,” Abraham K, Hershbein B, Houseman S. NBER Working Paper 26612, January 2020.
“Changing Labor Markets and Mental Illness: Impacts on Work and Disability,” Frank R, Glied S, Marple K, Shields M. NBER RDRC Working Paper NB19-05, November 2019.
“Unmet Need for Workplace Accommodation,” Maestas N, Mullen K, Rennane S. Journal of Policy Analysis and Management 38(4), May 2019, pp. 1004–1027.
“Disability Benefits, Consumption Insurance, and Household Labor Supply,” Autor D, Kostøl A, Mogstad M, Setzler B. American Economic Review 109(7), July 2019, pp. 2613–2654.
“Who Is Screened Out? Application Costs and the Targeting of Disability Programs,” Deshpande M, Li Y. American Economic Journal: Economic Policy 11(4), November 2019, pp. 213–248.
“The Effect of Disability Insurance Payments on Beneficiaries’ Earnings,” Gelber A, Moore T, Strand A. American Economic Journal: Economic Policy 9(3), August 2017, pp. 229–261.
“The Employment Effects of the Social Security Earnings Test,” Gelber A, Jones D, Sacks DW, Song J. Journal of Human Resources, March 9, 2020.
“How Financial Incentives Induce Disability Insurance Recipients to Return to Work,” Kostøl A, Mogstad M. American Economic Review 104(2), February 2014, pp. 624–655.
“Unemployment Insurance and Disability Insurance in the Great Recession,” Mueller A, Rothstein J, von Wachter T. Journal of Labor Economics 34(S1 Part 2), January 2016, pp. S445–S475.
“To Work for Yourself, for Others, or Not At All? How Disability Benefits Affect the Employment Decisions of Older Veterans,” Coile C, Duggan M, Guo A. NBER Working Paper 23006, December 2016.
“The Rise of Prescription Opioids and Enrollment in Disability Insurance,” Cutler D, Meara E, Stewart S. NBER DRC Working Paper NB16-03, September 2016.
“Has Wider Availability of Prescription Drugs for Pain Relief Affected SSDI and SSI Enrollment?” Cutler D, Meara E, Stewart S. Presented at Disability Research Consortium Annual Meeting, July 2017, Washington, DC.
“Place-Based Drivers of Mortality: Evidence from Migration,” Finkelstein A, Gentzkow M, Williams H. NBER Working Paper 25975, June 2019.


