Consumption Growth among Low- and Middle-Income Households
Alternatives to conventional measures of real wages, as well as direct indicators of consumption spending, suggest that below-median income families have seen gains in material well-being since 1960.
Though wage growth has slowed and income inequality has increased since 1960, consumption by lower- and middle-class U.S. families has also increased over this period, Bruce Sacerdote reports in Fifty Years of Growth in American Consumption, Income, and Wages (NBER Working Paper 23292). He suggests that the widespread use of the Consumer Price Index for Urban Consumers (CPI-U) as the price deflator in calculating real wages has understated the growth of inflation-adjusted earnings for these families. In addition, he provides direct evidence, based on consumption data, that living standards of median and below-median income house-holds have increased.
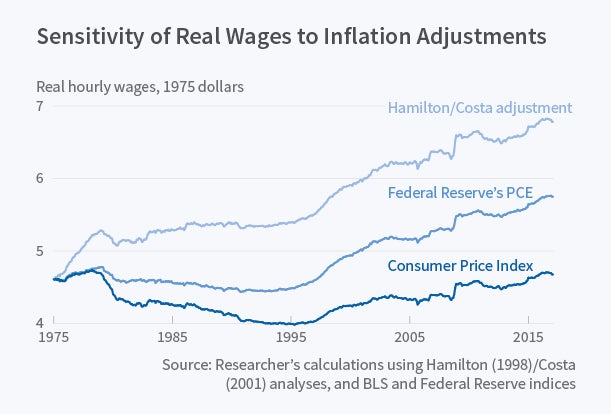
Sacerdote notes that although the CPI-U is widely used, it suffers from a number of well-known shortcomings as a price index. These include difficulties in the treatment of new goods and the handling of quality changes for goods that evolve over time. He points out that inflation measured by the CPI-U is greater than inflation computed using the Personal Consumption Expenditures (PCE) price deflator, which in turn is greater than that from another alternative measure suggested by the Advisory Commission to Study the Consumer Price Index in 1996 and investigated by James Hamilton and Dora Costa. When either of these alternative measures of inflation is used to construct the time series of real wages for low- and middle-income households, these wages display a more positive trend than when they are deflated using the CPI-U. The PCE adjustment implies that real wages grew by about 0.5 percent per year between 1975 and 2015, markedly weaker than the 1.2 percent average annual growth between 1964 and 1975, but greater than the nearly constant real wage trajectory that results from using the CPI-U to deflate nominal wages.
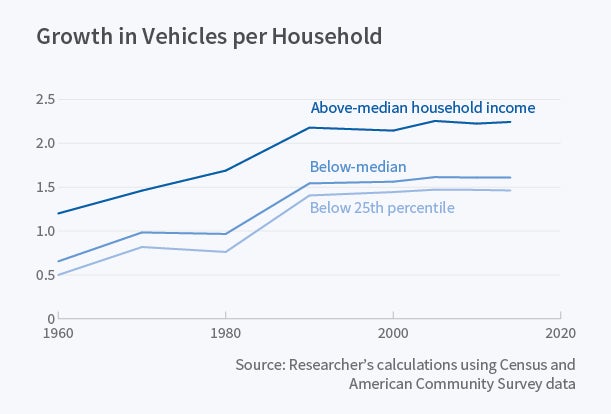
Sacerdote also points out that standards of living have increased across the board in the United States since 1964. In 1980, there were 0.76 vehicles per household in families below the 25th income percentile. That nearly doubled to 1.4 vehicles per household in the same group in 2015. Bedrooms per household also rose slightly between 1993 and 2009 for this group. Over a longer period, five decades, there are more dramatic increases in living standards. In 1960, for example, fully 35 percent of lower-income households had no indoor plumbing. By 1970, the figure had declined to 12 percent, and by 2015 virtually all households had indoor plumbing.
The increase in consumption over the last five decades has coincided with a decline in survey-based measures of U.S. optimism about living standards. Sacerdote notes that the unresolved challenge is how to reconcile these two developments. There may be some groups for which overall consumption is falling, such as men who have not com-pleted high school and single-parent households. The increased flow of information over personal digital devices may also contribute to the sense of deprivation, as people see the conspicuous consumption of others on a more frequent basis.
— Jen Deaderick


