Revisiting the Relationship Between Interest Rates and Government Borrowing
The relationship between interest rates and federal borrowing is central to assessing the economic consequences of fiscal policy. It determines the impact of budget deficits on investment and is critical for projecting future debt service costs. In Revisiting the Interest Rate Effects of Federal Debt (NBER Working Paper 34018), researchers Michael Plante, Alexander W. Richter, and Sarah Zubairy present new estimates of this relationship.
A 1 percentage point increase in the US debt-to-GDP ratio raises the five-year-ahead five-year Treasury rate by about 3 basis points.
The researchers examine data for the period 1976:Q1 through 2025:Q1. They relate the five-year-ahead five-year Treasury rate, a measure of an expected long-term nominal interest rate, to the Congressional Budget Office’s (CBO’s) forecast of the US debt-to-GDP ratio in five years. The rationale for using the five-year-ahead Treasury rate is that it is less sensitive to business cycle fluctuations than the current debt-to-GDP value.
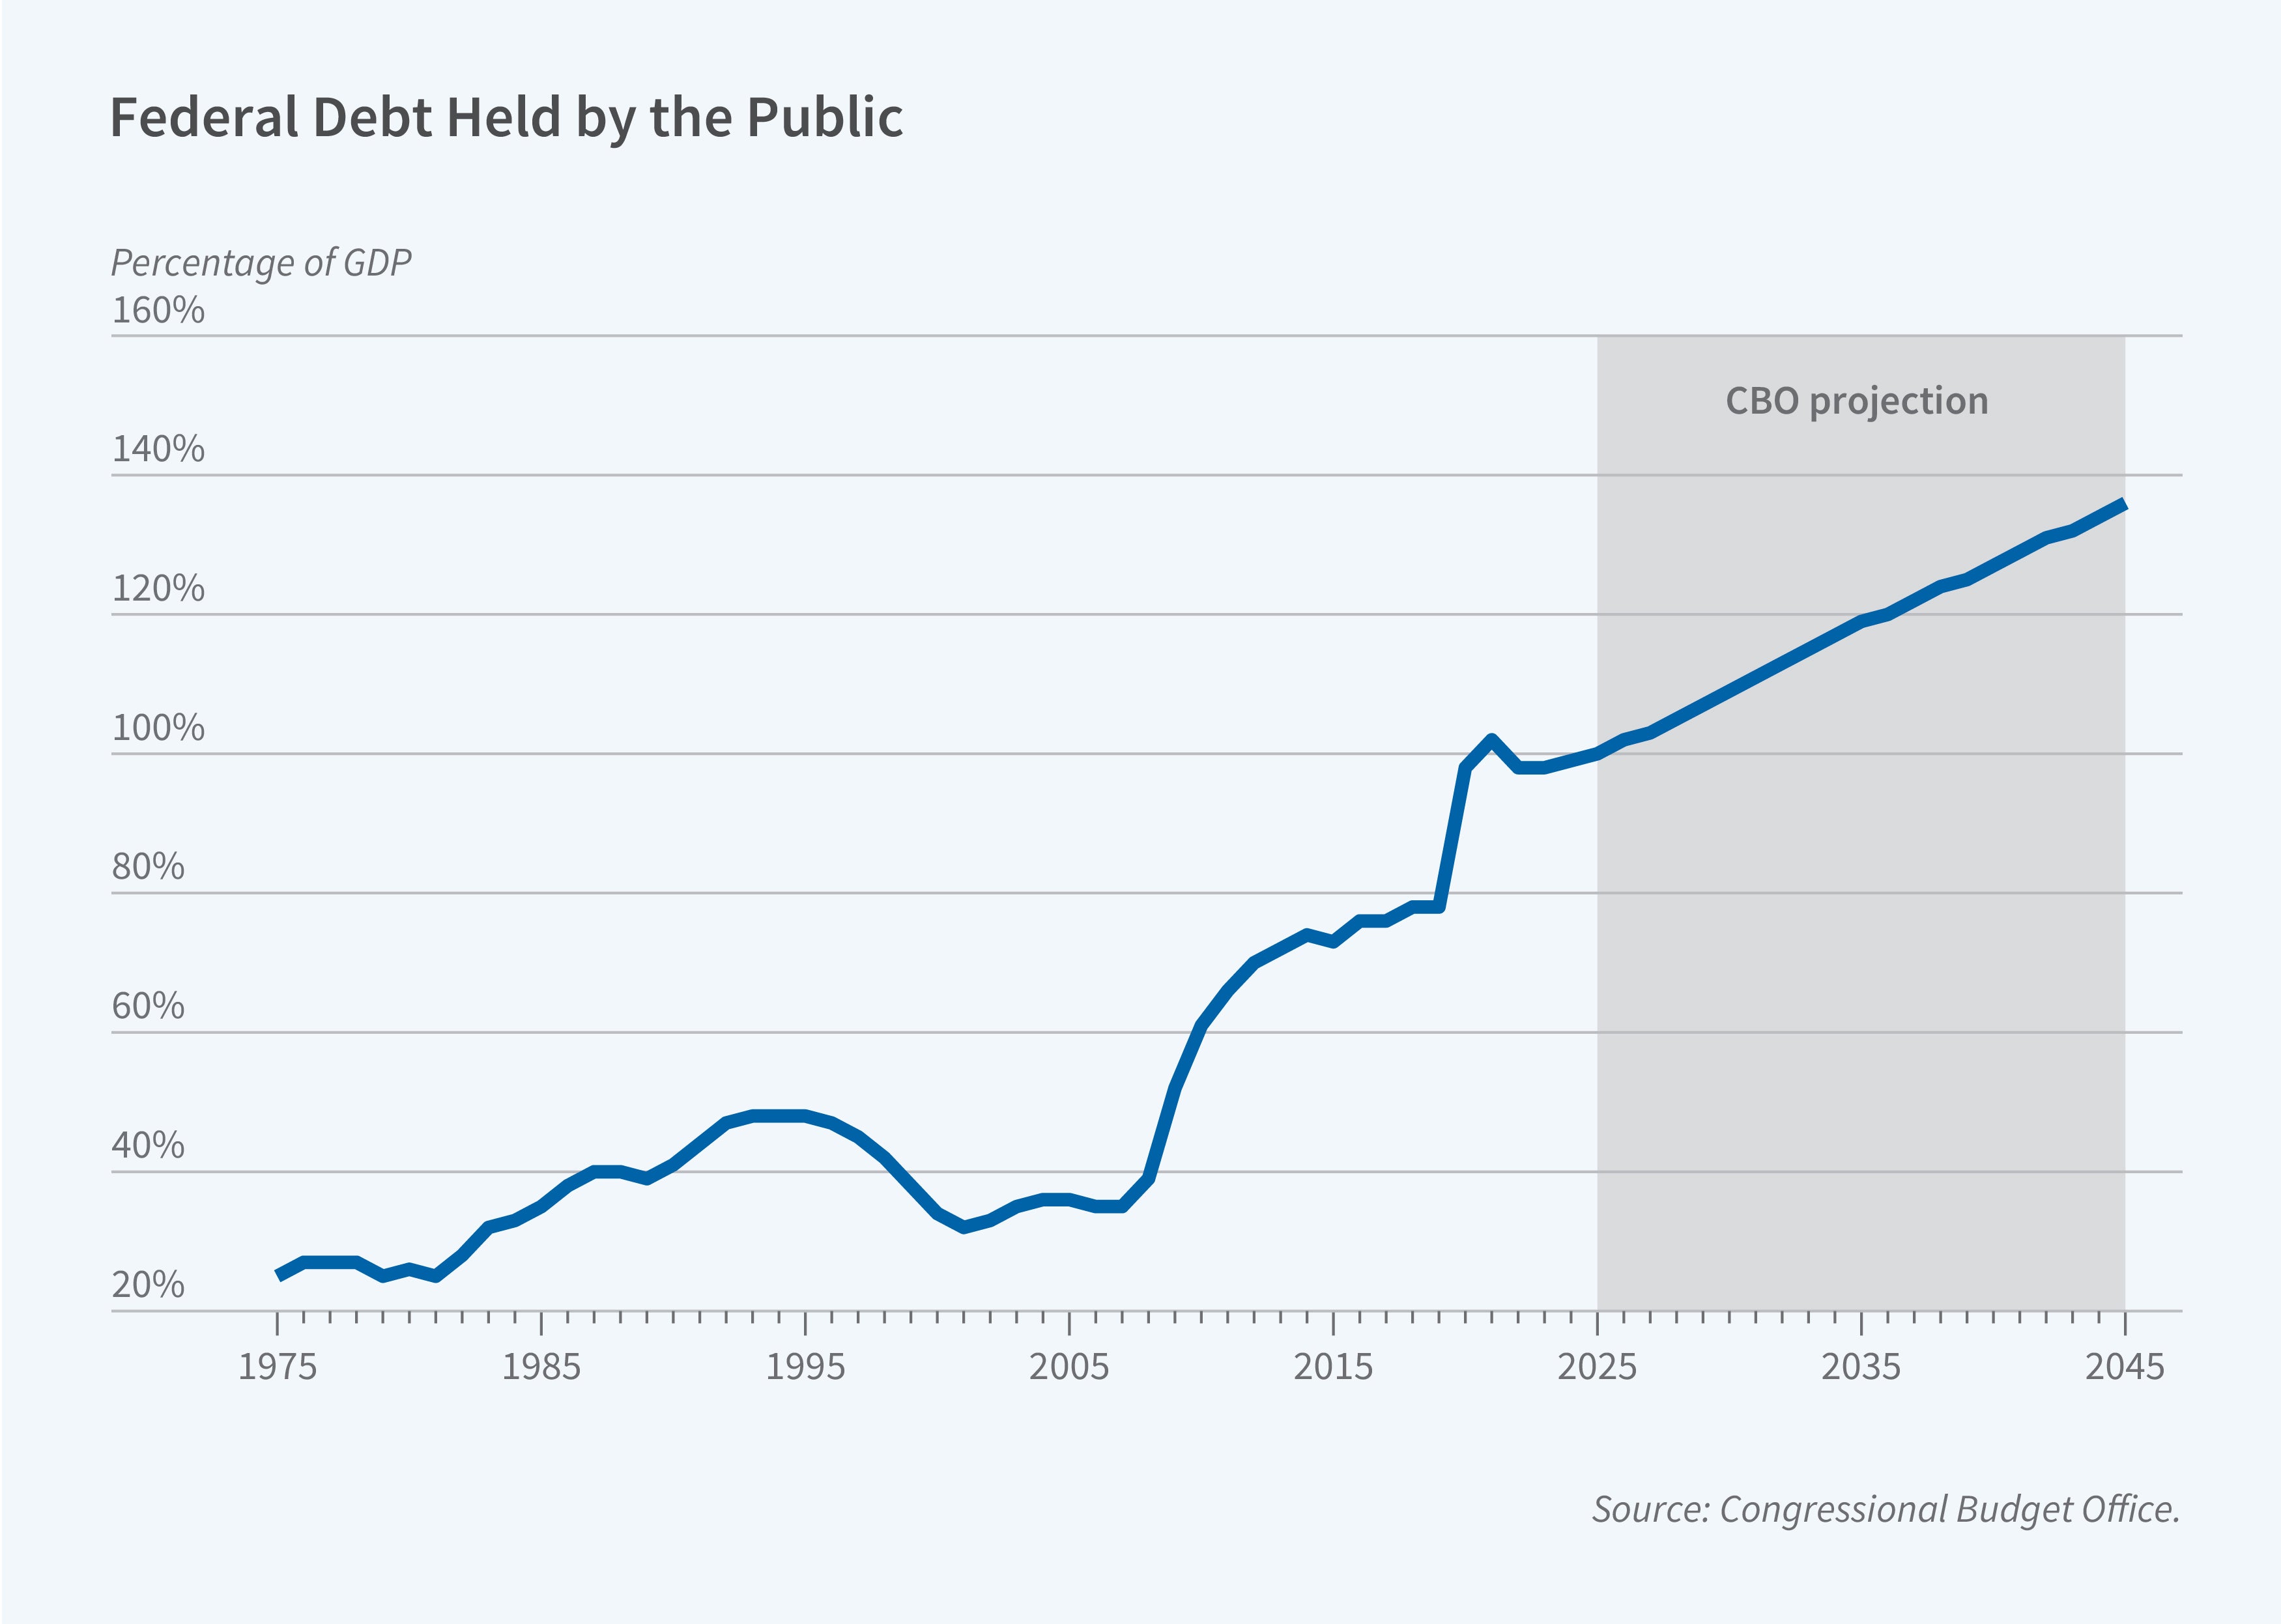
One of the key observations of the authors is that the close relationship between expected interest rates and expected inflation broke down in the early 2000s. They also observe that while the debt-to-GDP ratio moved within a relatively narrow band and satisfied a statistical property known as stationarity in the early part of the data sample, this was not the case for the more recent period. The breakdown of stationarity coincides with a period of generally rising debt-to-GDP ratios, reaching close to 100 percent today. In response to these findings, the researchers diverge from past practice, which typically estimated how the level of the nominal interest rate moved with the level of the debt-to-GDP ratio. Instead, they relate changes in expected nominal interest rates to changes in the CBO’s debt-to-GDP projections.
The new estimates suggest that a 1 percentage point rise in the debt-to-GDP ratio raises the five-year-ahead, five-year Treasury rate by about 3 basis points. The effect is similar when the interest rate measure is the five-year-ahead 10-year Treasury rate. Long-term interest rates capture both expectations of future short-term real rates and a term premium, the extra compensation investors demand for holding longer-maturity debt. The estimates indicate that roughly three-quarters of the increase is due to a rise in the term premium, while the remainder is due to a rise in expected future short-term real interest rates.
The researchers note that the CBO currently projects that the US debt-to-GDP ratio will increase by 56 percentage points over the next 30 years. Their estimates imply that, if other factors remain constant, the projected debt increase could raise long-term interest rates by about 170 basis points.
— Laurent Belsie


