The Role of China’s State-Owned Enterprises in the US-China Trade War
The United States and China have been embroiled in a trade war of varying intensity for the past seven years. Most attention has focused on tariffs, beginning with those imposed by the Trump administration in January 2018 and the retaliatory tariffs imposed by China shortly thereafter. However, tariffs are not the only tool that governments can use to influence trade flows. In particular, the Chinese government, with its array of large state-owned enterprises (SOEs), can directly reduce imports of American products. Such a move can have substantial impact: in 2015, purchases by SOEs made up 22 percent of Chinese imports from the US.
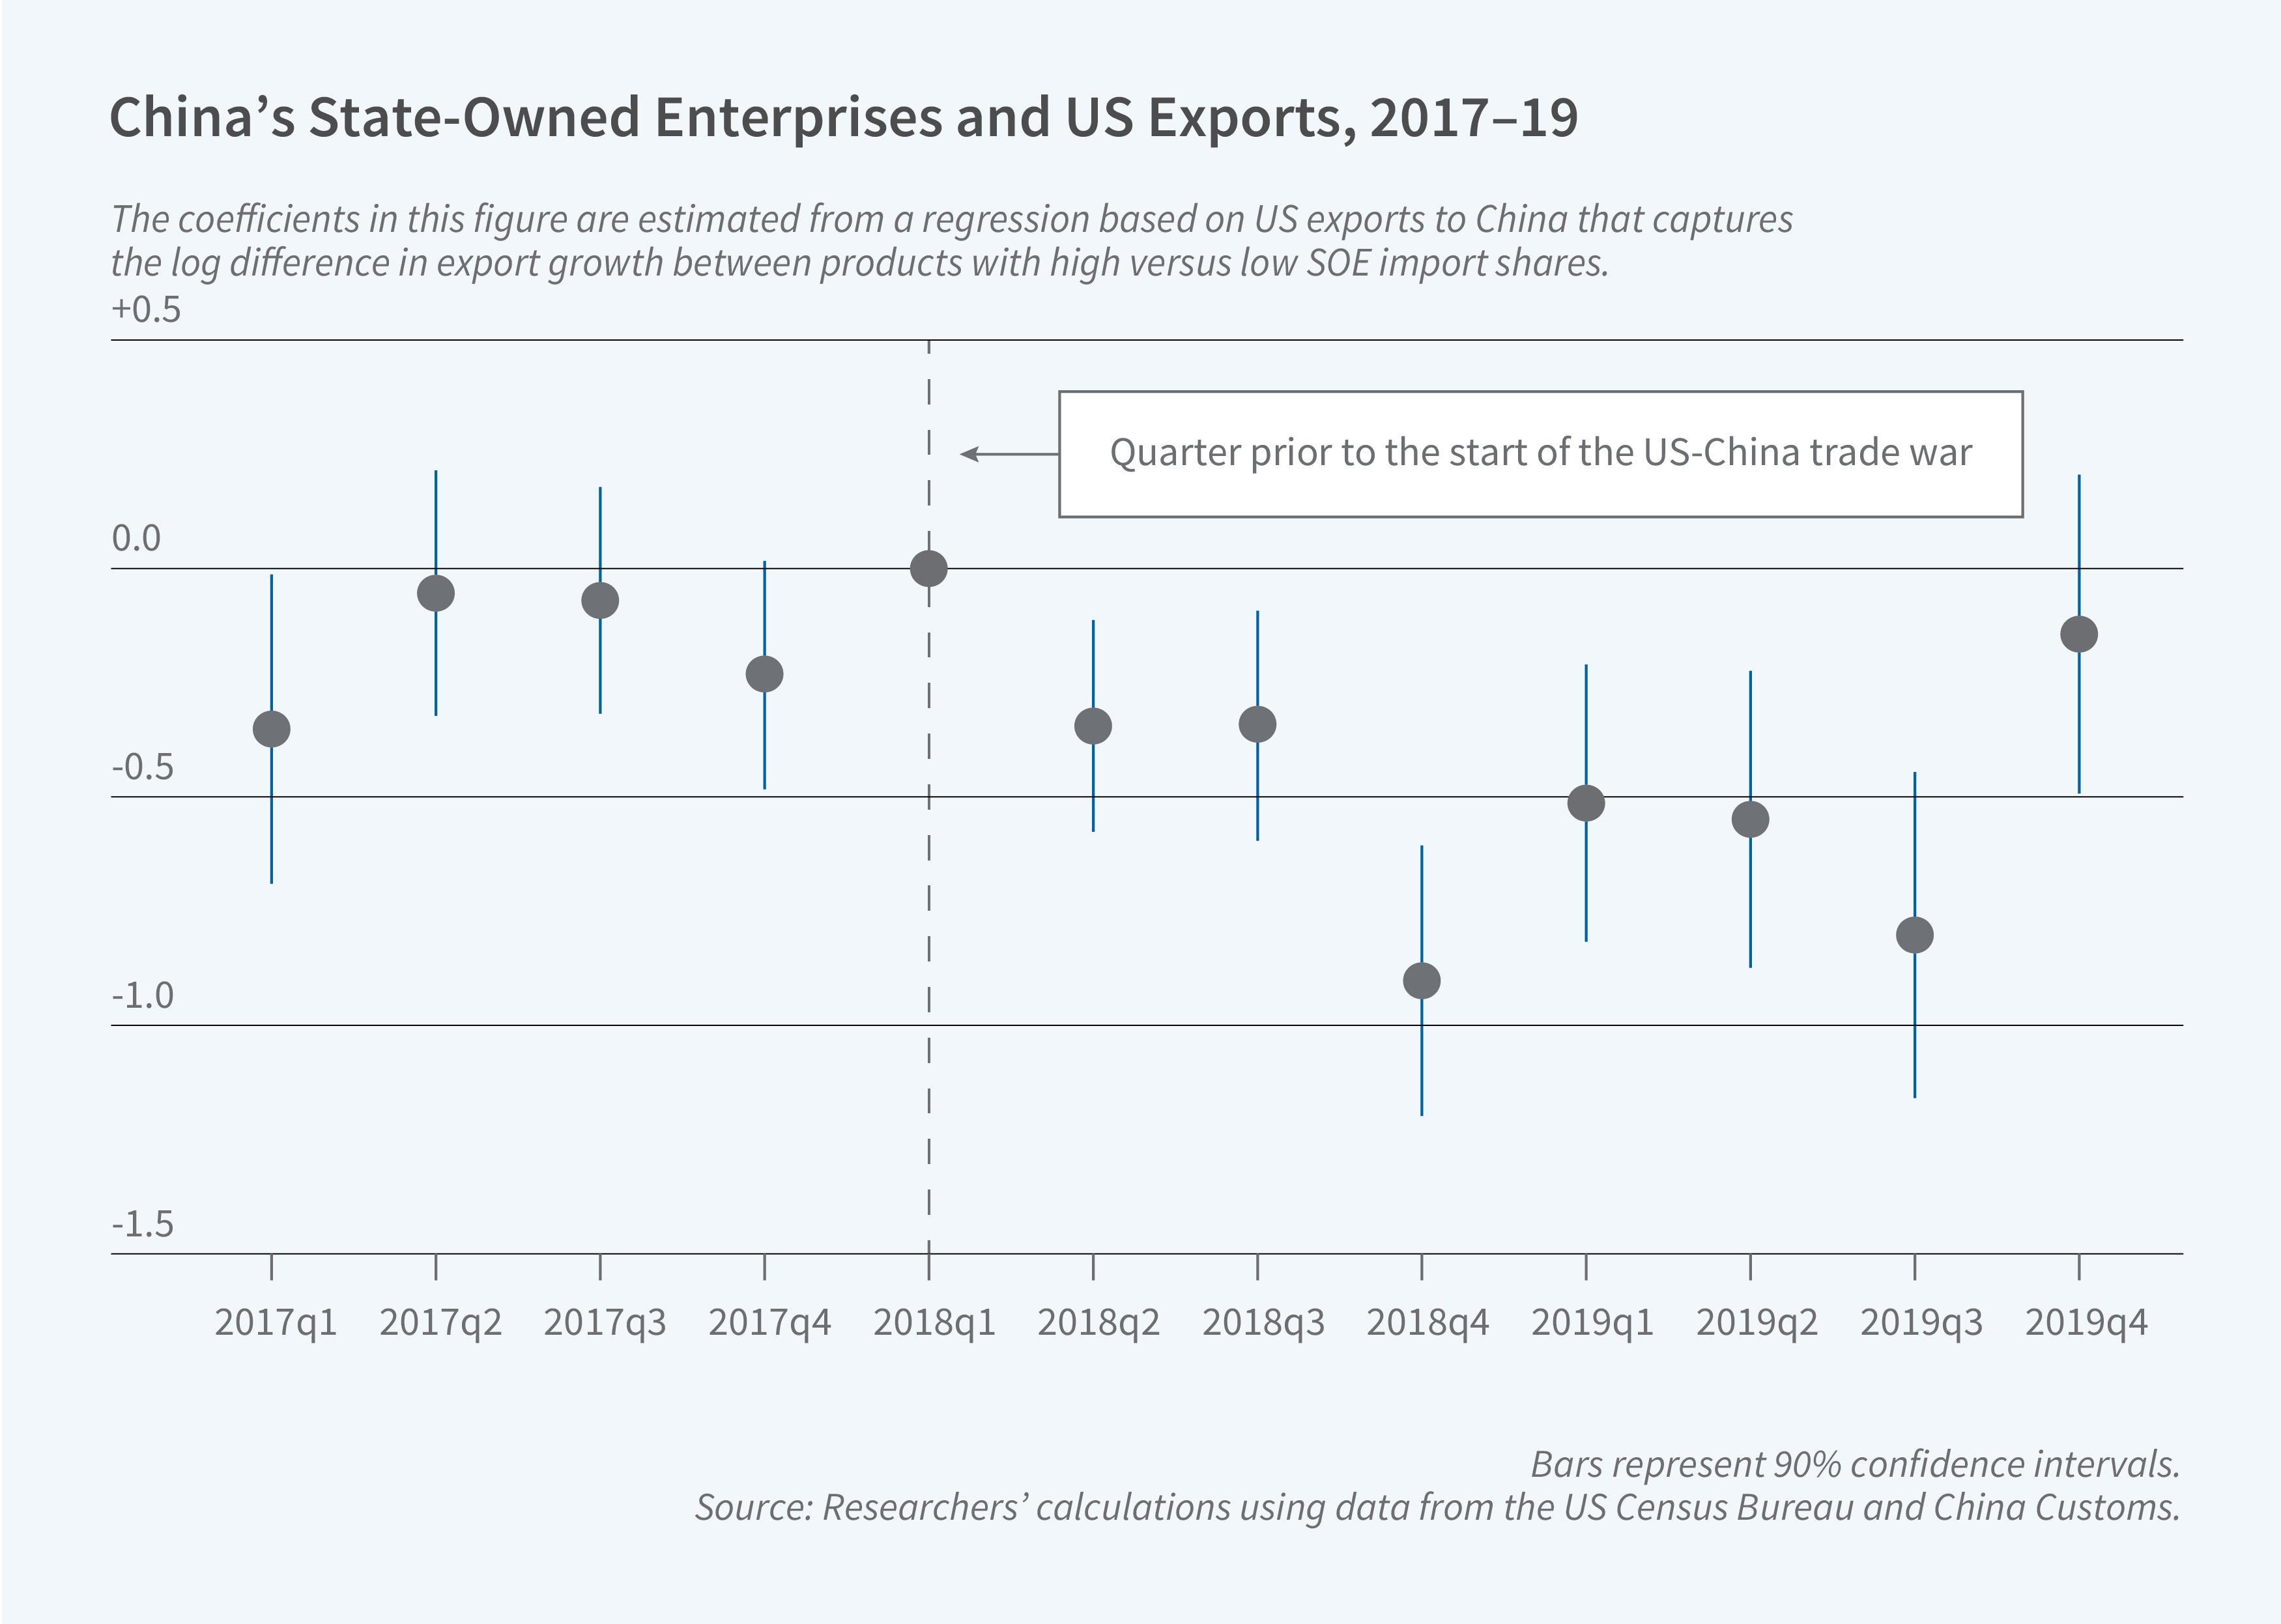
In Beyond Tariffs: How Did China’s State-Owned Enterprises Shape the US-China Trade War? (NBER Working Paper 33599), Felipe Benguria and Felipe Saffie investigate whether China’s SOEs reduced imports from the US. There is little public evidence of possible instructions from the central government to SOEs. The researchers use confidential Chinese customs data that allow them to measure the SOE share of imports in each industry. They exploit cross-industry variation in the share of Chinese imports from the US accounted for by SOEs and test whether there were larger declines in Chinese imports from the US in industries where SOEs accounted for a larger share of imports prior to the trade war.
China’s state-owned enterprises reduced imports from the US during the trade war, effectively complementing tariff-based trade restrictions.
Industries with larger SOE import shares experienced larger declines in imports from the US. The researchers estimate that actions by SOEs caused a 4 percent decline in Chinese imports from the US. To place this in context, they also estimate that Chinese imports declined 8 percent as a result of retaliatory tariffs imposed on US goods. The effect of SOEs is largest in food and agricultural industries, where SOEs caused a 19.4 percent decline. Import-reducing actions by SOEs appear to have been targeted at industries located in Republican areas.
Actions by SOEs did not just reduce the quantities of different US goods imported by China. They also resulted in the cessation of imports of some goods, such as US crude petroleum, which were only imported by SOEs. The researchers find that SOE-driven reductions in imports peaked during the intermediate period after China had imposed a sequence of retaliatory tariffs. This suggests that reductions in SOE imports represented a second phase of retaliatory policy, after the imposition of tariffs.
— Shakked Noy


