Estimating the Long-Term Fiscal Capacity of the US
Responsible long-term fiscal planning requires an understanding of national fiscal capacity and the extent to which it is affected by economic circumstances, including the term structure of real interest rates and the projected future path of budget deficits or surpluses.
In Measuring US Fiscal Capacity Using Discounted Cash Flow Analysis (NBER Working Paper 29902), Zhengyang Jiang, Hanno Lustig, Stijn Van Nieuwerburgh, and Mindy Z. Xiaolan estimate an upper bound on US fiscal capacity. Fiscal capacity must equal the present discounted value (PDV) of projected future budget surpluses. It depends both on the forecast stream of future cash flows as well as the discount rates that are used to aggregate them across time. Discount rates, in turn, reflect both the time value of money and the short- and long-term risk attributes of the cash flows.
Discounted cash flow analysis suggests that the US government’s fiscal capacity may be lower than the current market value of outstanding US Treasury debt.
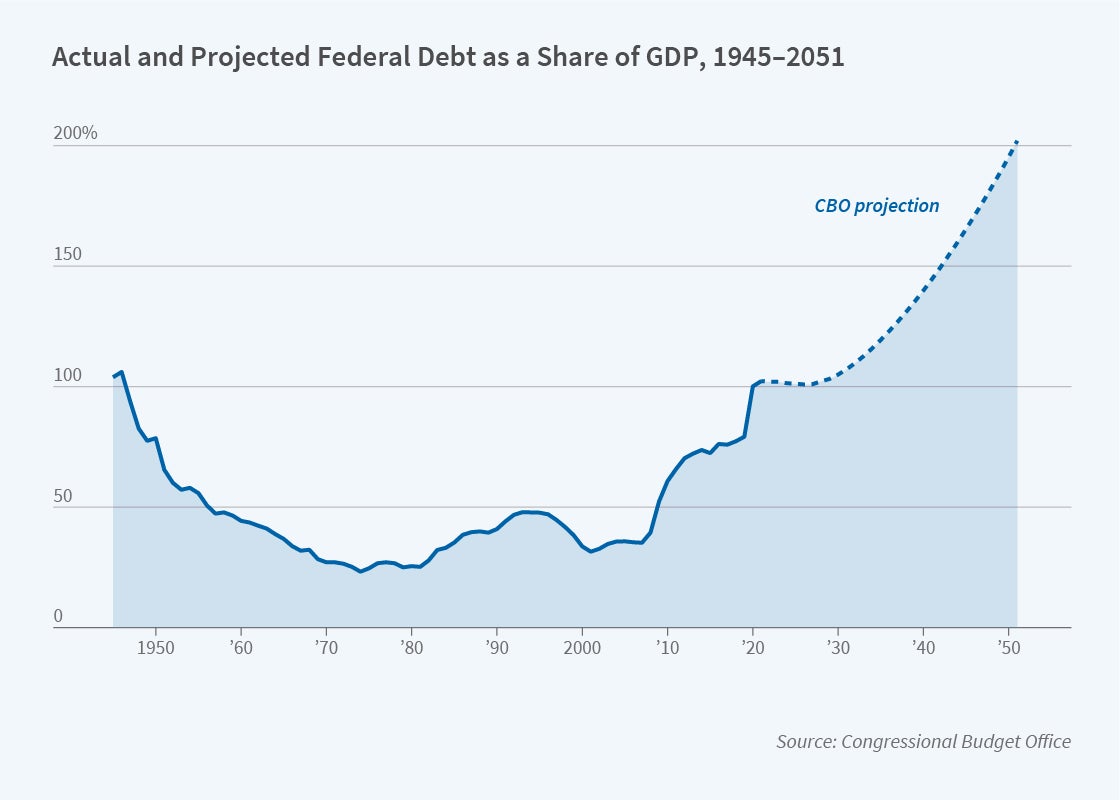
At the currently low level of real returns, PDV calculations can be very sensitive to small changes in discount rates. While the interest rate on government bonds is often used to discount future government cash flows, the researchers argue that this discount rate does not account for the short-run and long-run fluctuations in deficits and surpluses. In the short run, both federal tax revenue and federal spending are strongly affected by the business cycle. US budget surpluses are procyclical, with larger surpluses when economic activity is strong, revenues are robust, and the demand for government spending programs, particularly transfer programs, is below average. In the long run, debt is cointegrated with GDP and inherits its long-run risk. This pattern leads the researchers to argue that the appropriate risk premium to use when discounting future surpluses must incorporate a “GDP risk premium.” They measure this premium as the average return on unleveraged equities relative to government bonds, which they estimate to be 2.6 percent per year at the end of 2021. They add this premium to the yield on long-term government bonds and use this as the discount rate in their calculations. They draw projections of budget surpluses and deficits from long-term analysis by the Congressional Budget Office (CBO).
The researchers begin by calculating the PDV of projected federal budget deficits between 2022 and 2051; this yields a value of $21.6 trillion. They then calculate the PDV of the CBO’s projection of US government debt in 2051, whose value is $31.6 trillion. This $31.6 trillion reflects surpluses after 2051. Subtracting the PDV of deficits from the PDV of debt results in a fiscal capacity estimate of about $10 trillion, which could support other liabilities.
The researchers note that US Treasury yields are below yields on risk-free assets because of their status as safe-haven assets. The resulting seigniorage revenue adds another $3.7 trillion in PDV to the fiscal capacity, bringing it to around $13.7 trillion. This value is well below the roughly $23.5 trillion of current US Treasury debt outstanding. To equate current outstanding debt with fiscal capacity would require the US to run surpluses of 3.3 percent of GDP in every year from 2022 until 2051, rather than deficits averaging 3.7 percent of GDP, as the CBO currently projects. They point out that while it is possible that participants in the market for US Treasuries anticipate significant future fiscal changes that are not embodied in the CBO projection, the changes that would be required to close the capacity shortfall are very large.
They also observe that because prospective government surpluses accrue in the distant future, the duration of the financial claim associated with these surpluses, greater than 50 years, is much longer than the duration of outstanding government debt — about 5 years. A 1 percent increase in the interest rate, holding projected nominal GDP and primary surpluses constant, therefore results in a large increase in the projected debt-to-GDP ratio in 2051. This increase is the equivalent of a 2.9 percent increase in the primary surplus as a share of GDP in every year after 2051.
— Kevin Tasley


