Pain Management and the Opioid Epidemic
Death rates due to drug poisonings began to surge in the US in the mid-1990s, marking the emergence of an epidemic that has persisted for three decades. The health consequences have been stark, with annual deaths exceeding 100,000 since 2021.
In Prescription for Disaster: The SSDI Rate, Pain, and Prescribing Practices (NBER Working Paper 34265), William N. Evans and Ethan M. J. Lieber examine characteristics of counties in 1990—prior to the surge—that predict the county-level severity of opioid deaths after 2000. After considering a wide range of potential determinants, they focus on one factor: the percentage of the working-age population receiving Social Security Disability Insurance (SSDI) benefits in 1990.
If prescribing practices for treatment of chronic pain had not changed in the mid-1990s, drug death rates would have been 43 percent lower in 2015.
This SSDI recipiency rate is a measure of disability prevalence, reflecting the share of adults with a medical condition that limits their capacity for work. But the researchers emphasize that the SSDI rate is also a good proxy for the baseline level of pain, for both SSDI recipients and non-recipients in the county.
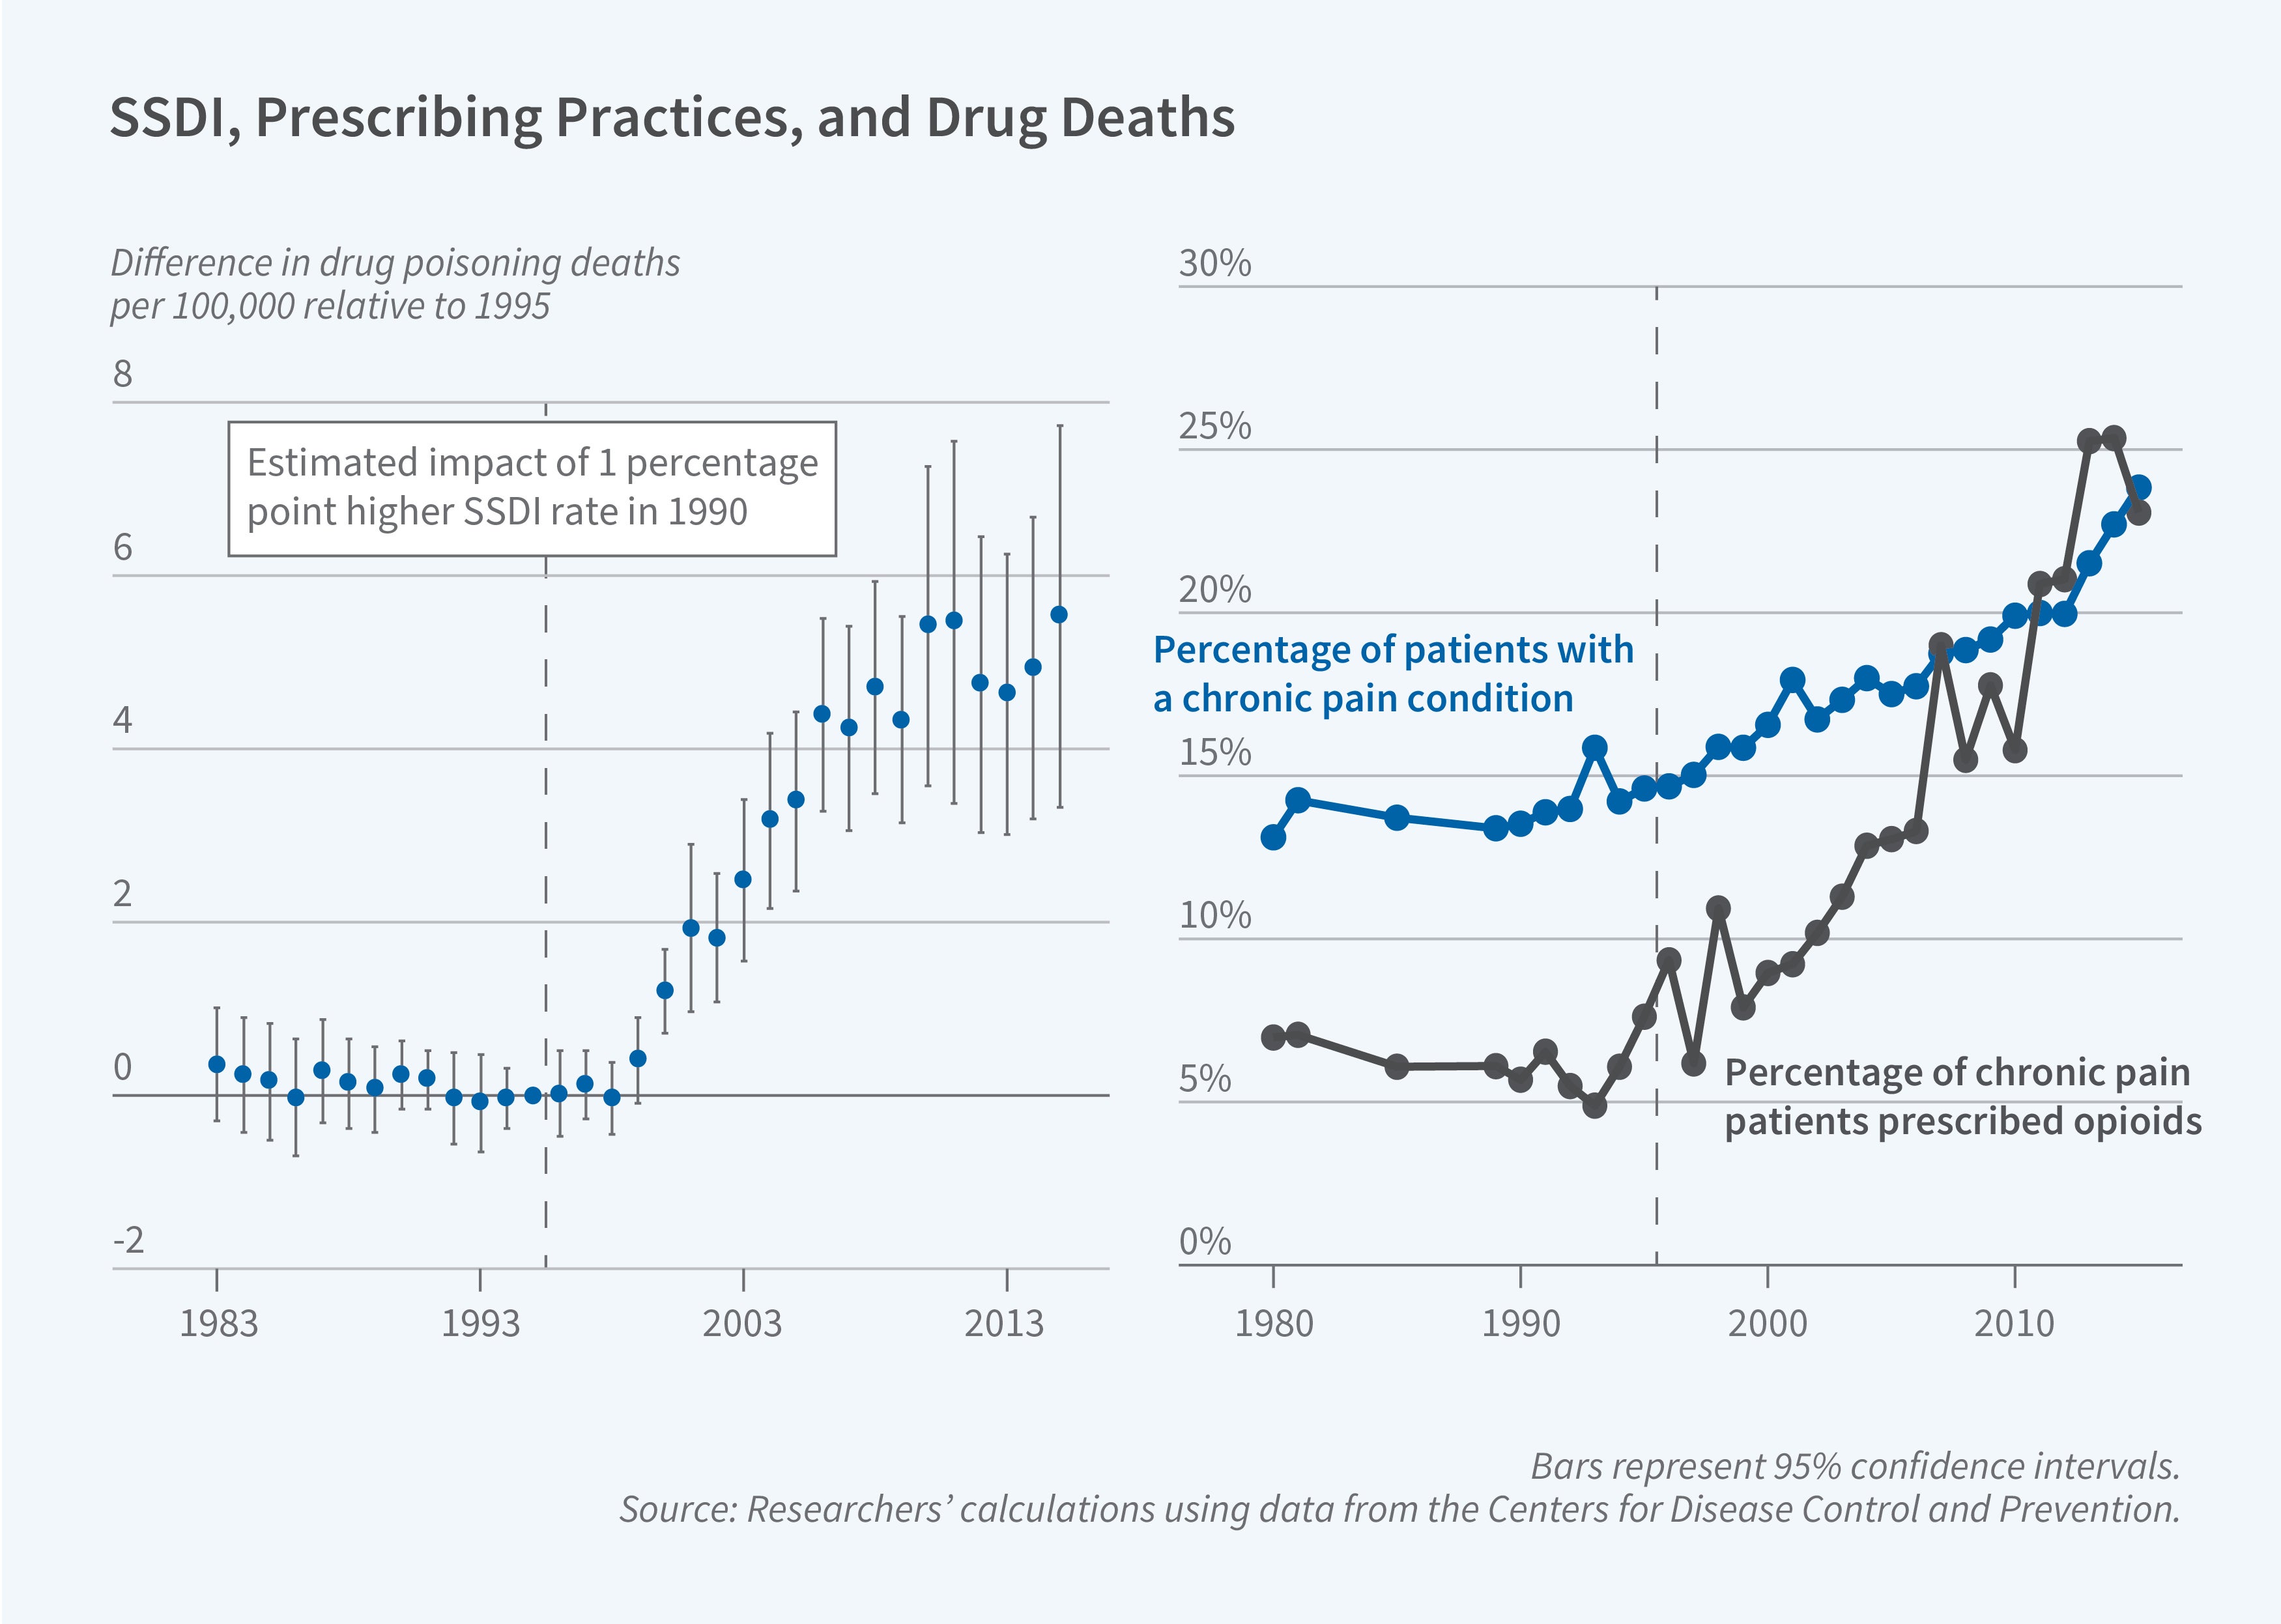
A higher county-level SSDI rate was not always associated with greater mortality from drug poisonings. In fact, it was negatively related to drug-related mortality in the 1980s and early 1990s. But this correlation became positive starting in 1999 and continued to grow stronger in subsequent years.
What explains this shift in the relationship between the SSDI recipiency and drug mortality rates? The shift coincides with increased attention to the issue of untreated chronic pain and a resulting liberalization in the prescription of painkillers. The likelihood that a patient with chronic pain received an opioid prescription was stable at around 7 percent in the 1980s and early 1990s but began to rise in the mid-1990s and reached 25 percent by 2015. At the same time, patients were increasingly likely to be diagnosed with conditions associated with chronic pain.
After ruling out many other potential mechanisms, the researchers interpret the change in the correlation between the SSDI and drug mortality rates as capturing the impact of changed prescribing practices for treatment of pain, which disproportionately affected communities with higher levels of chronic pain. Areas with higher SSDI rates received more opioid prescriptions beginning in the mid-1990s, spurring opioid abuse and drug mortality in the years that followed.
The shift in prescribing practices had an impact that was independent of other drivers of the opioid epidemic. For example, the marketing of OxyContin played a well-known role in rising drug-related deaths, but even in counties that received little marketing of OxyContin, the relationship between the SSDI rate and subsequent drug mortality is evident. This relationship is also robust to controlling for factors that influence SSDI receipt, such as local economic conditions and non-pain measures of health status. The researchers estimate that, if prescribing practices had not changed in the mid-1990s, drug death rates would have been 43 percent lower in 2015.


