Disease and Economic Surveillance during the COVID-19 Pandemic
Policymaking during a novel pandemic requires information about the spread and impact of infection or about the impact of nonpharmaceutical and pharmaceutical interventions. This is also critical for scientific understanding, whether one is developing models of the disease, the economy, or both. However, because the contagion is novel, we may not know what to measure before the event, and our existing data-gathering infrastructure may be lacking. We have to quickly adapt our surveillance, analysis, and models as we learn more about the threat.
This adaptation was on display during the COVID-19 pandemic. I illustrate this with a series of papers that responded to questions from policymakers and were written with coauthors who sacrificed their regular research to assist with the pandemic response. These papers estimated several critical disease and economic parameters that could inform policymakers in India, a lower-income country. The initial papers focused on measuring the prevalence of infection by and immunity to the SARS-CoV-2 virus, the mortality burden of the pandemic, and the economic impact of the disease. Later papers used those estimates to tailor local nonpharmaceutical interventions and estimate the optimal amount of vaccines for governments to purchase. The research focused on India because it had far fewer researchers per capita than the US, Europe, and China. Many of these papers were prompted by requests from state governments in India or from the Asian Development Bank.
Disease Surveillance
The purpose of surveillance in a pandemic is to assess current exposure and future risk — the current prevalence of infection and immunity against future infection. These parameters change over time, so they must be measured continuously.
When the pandemic struck, around January 2020, public health authorities estimated the prevalence of SARS-CoV-2 using tests that searched for fragments of virus in biospecimens. They mainly tested people with respiratory symptoms visiting hospitals because tests were initially scarce. Authorities had planned for a flu pandemic and flu is spread by symptomatic persons, so testing patients might have guided quarantine or treatment decisions.1 But SARS-CoV-2 was a coronavirus, and we did not know whether asymptomatic persons in the general population could spread a coronavirus.
To address this blind spot, my first paper took advantage of a massive flight of Indians out of cities when India lifted the lockdown that it, like many nations, initially imposed in an attempt to prevent the disease’s spread. The lockdown interrupted a regular migration of workers from cities to villages to help with India’s summer harvest, and when it was lifted workers rushed to rural areas. Working with the state of Bihar, my coauthors and I randomly tested migrant workers arriving on trains from other states and found that symptomatic testing revealed underestimation of the population-level prevalence of the virus, which was 21 percent higher among asymptomatic migrants than among symptomatic patients in the states from which migrants came.2 It was unlikely the migrants got infected on the one-day train ride because antigen tests can only detect infection several days after onset.
India’s lockdown provided a second example of mistaken beliefs. The logic for lockdown was that individuals were less likely to spread infection if confined to their homes. This logic assumes people live in separate dwellings with private bathrooms. But roughly 20 percent of urban Indians live in slums with communal toilets.3 Confinement in slums might increase the number of contacts. I explored this in a paper estimating the prevalence of antibodies to SARS-CoV-2 in a random sample of Mumbai residents. By July 2020, while 16.1 percent of residents outside slums had been infected, 54.1 percent in slums had been.4
Several papers suggested that the prevalence was higher among the urban poor because they were essential workers who worked through the lockdown. We used location data from about 500,000 cell phones in Mumbai and found that slum residents traveled no more than other residents.5 It is likely that residential density explained higher infection rates in the slums.
The Mumbai seroprevalence study highlighted the value of testing for antibodies rather than for viral fragments. After an infection, a person’s immune system generates antibodies to block viral reproduction and to help white blood cells locate and destroy copies of the virus. Once a virus is defeated, viral fragments are filtered from the bloodstream, while unique antibodies generated to neutralize the antigen at hand may remain longer. Testing for these antibodies helps in estimating cumulative infection rates, the success of past policies to prevent infection, and the level of protection against re-infection.
We followed up on the Mumbai city study with population-level seroprevalence studies of whole states. We estimated that 46 percent of Karnataka state had been infected by August 2020, with urban areas having about 10 percentage point higher rates of immunity.6 In Tamil Nadu, we conducted a repeated cross-section, surveying about 25,000 persons four times over two COVID waves.7 We found that 90.6 percent of the population had humoral immunity by December 2021.
The Tamil Nadu study highlighted two limitations of antibody surveillance. First, unlike viral fragments, antibodies can be triggered either by infection or by vaccination, so one cannot identify the cause of humoral immunity without more information. In Tamil Nadu, we used self-reported vaccination to estimate that, while infection was responsible for 74 percent of the approximately 50 percentage point rise in seroprevalence after India’s Delta wave in May 2021, vaccination was responsible for 78 percent of the approximately 20 percentage point increase in seroprevalence by December 2021. Second, although antibodies last longer than viral fragments, they too fade over time. Antibodies are costly for the body to produce and they are less useful after an infection is defeated, so they too are cleared from the bloodstream in time. In Tamil Nadu, seroprevalence declined more than 31.6 percent in roughly six months.
After humoral immunity fades, the immune system retains a memory of the virus, and the specific antibodies suited to fight it, in T and B cells. Testing for such “cellular immunity” requires more blood and lab work than testing for antibodies, however. To demonstrate the feasibility of estimating population-level cellular immunity, we tested random samples of residents in Bangalore.8 This is one of only two population-level cellular immunity surveys ever conducted, the other covering a population of young adults aged 24–27 in Sweden. By January 2021, we found that levels of humoral immunity substantially underestimated the levels of overall (humoral or cellular) immunity in the population: while 29.7 percent of our sample had antibodies, more than 55.7 percent had cellular immunity.
Although we made substantial progress in developing methods and infrastructure to conduct population-level disease surveillance, much work remains. SARS-CoV-2 is not a single virus. Variants evolve to escape immunity, which can be triggered by infection or vaccination. Immunity to one variant may provide imperfect protection against another variant. Forecasting future immunity requires population-level surveillance for infection by variant. Currently, this is done with nonrepresentative convenience samples rather than random samples.
We also need to track how vaccines affect viral evolution relative to infection. Before the pandemic, we conducted a simulation study to show that vaccines can slow the evolution of seasonal influenza if the scope of immunity from vaccines is not too small relative to that of infection.9 Similar work is required to understand how vaccines affect changes in SARS-CoV-2, which has a different pattern of evolution than flu.
Mortality Burden
The mortality rate from SARS-CoV-2 is an important measure of the health burden of the pandemic. Initial estimates generated a case fatality rate (CFR) — the probability of death conditional on symptomatic infection. This was because viral testing focused on symptomatic cases and deaths in hospitals were relatively well tracked, even in lower-income countries. But a large percentage of SARS-CoV-2 infections are asymptomatic, so the infection fatality rate (IFR) — the probability of death conditional on infection — is lower than the CFR.10 Moreover, the IFR is more relevant for calculating the value of preventative measures as opposed to the value of treatment.
Because our population-level serological studies captured asymptomatic infection, they can be used to calculate the denominator of the IFR. Our initial estimates of the IFR, however, were very low, roughly 10 percent of the death rate in higher-income countries, due to underreporting of SARS-CoV-2 deaths.11 This reflects problems with mortality data in lower-income countries like India. Death registries are incomplete. Of India’s 28 states, only 14 have shared registry data with the public, and these registries capture perhaps three-quarters of deaths.12 Registries also do not report the cause of death, and during the pandemic only a fraction of decedents in hospitals were tested for SARS-CoV-2 due to the scarcity of tests.
To address these limitations, we conducted three studies. The first used 174,003 household rosters from the Consumer Pyramids Household Survey (CPHS), a population-representative panel survey of Indian household income and consumption, to estimate the number of people who died from 2018 to 2021.13 We estimated about 4.2 million all-cause excess deaths across India during the pandemic. These estimates are very sensitive to the calculation of how many would have died but for the pandemic and to the baseline period for the counterfactual.
The second study tackled cause of death. We visited all households that reported a decedent in the first study and conducted WHO-compliant verbal autopsies — interviews of the next of kin to determine symptoms of the decedent and map symptoms to the cause of death. Using data from 22,178 completed verbal autopsies, we estimated that 33 percent of excess deaths were attributable to the SARS-CoV-2 virus. The remaining excess deaths were indirectly attributable to the pandemic.
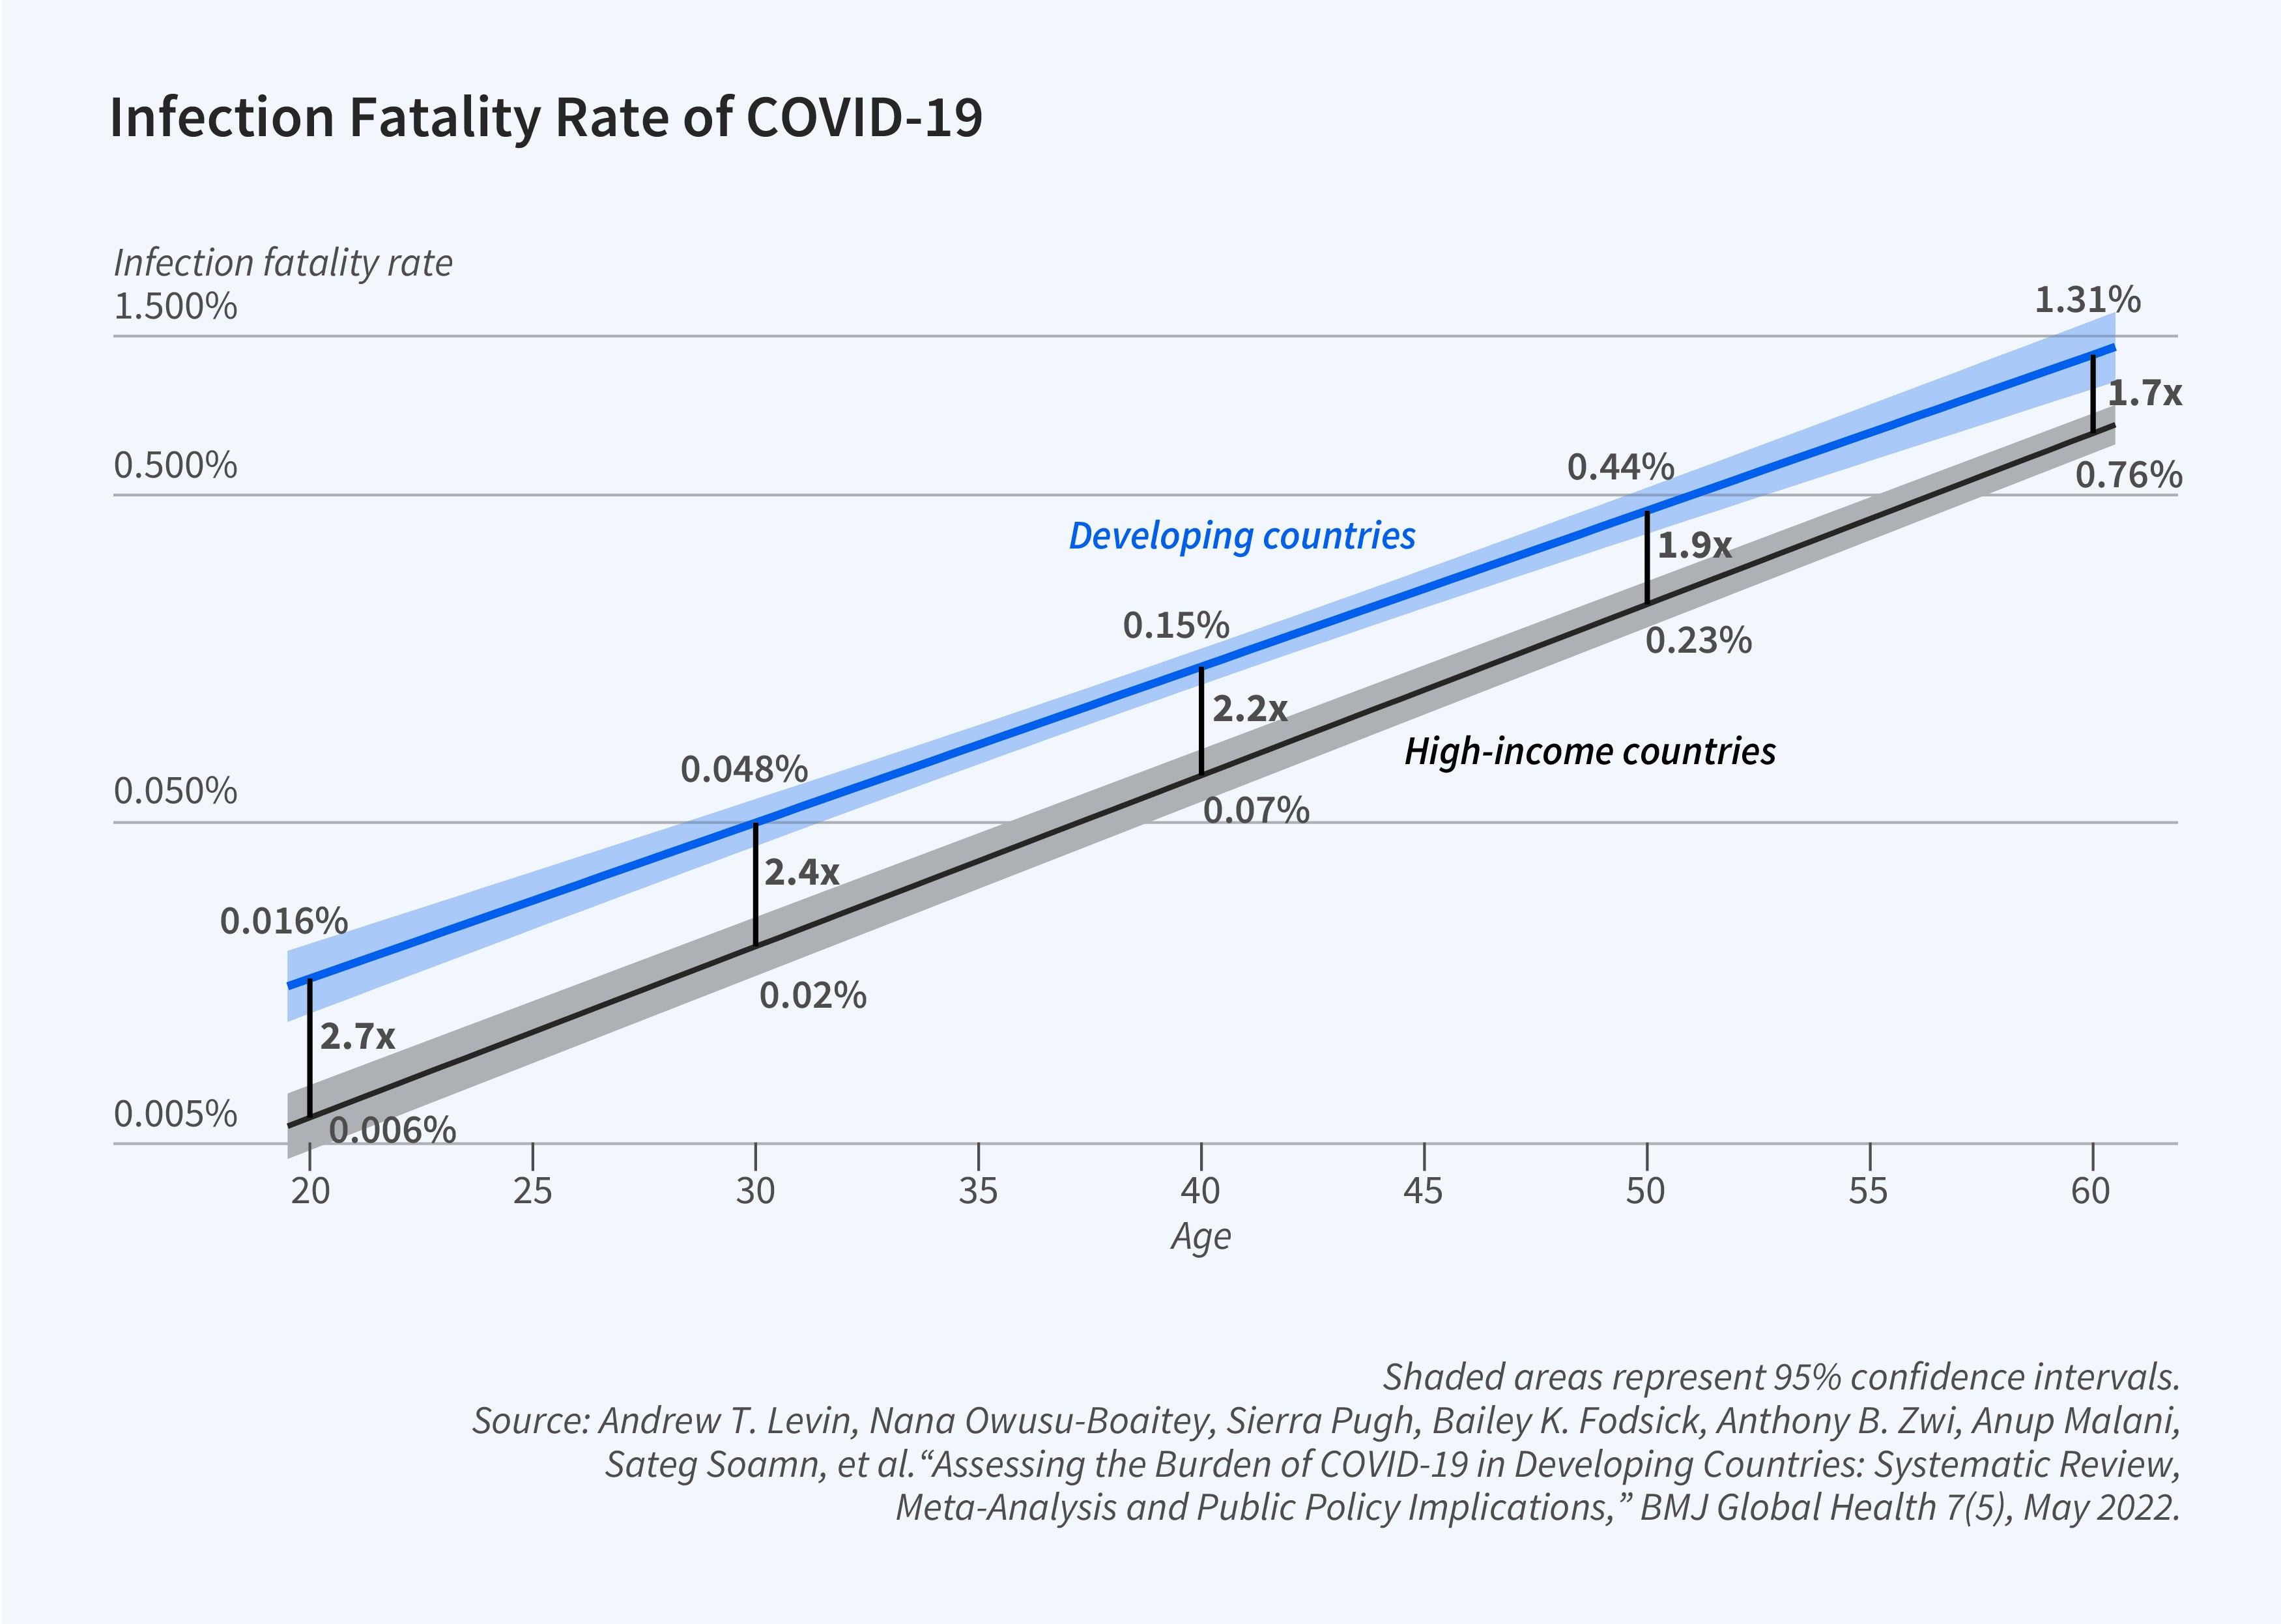
In the final paper, we conducted a meta-analysis of IFR estimates across a range of lower-income countries, giving greater weight to countries with higher-quality data on mortality.14 We estimated that age-specific IFRs were roughly double those in higher-income countries (Figure 1). However, the median IFR was roughly the same — 0.5 percent — because the IFR rises with age and lower-income countries have younger populations.
Economic Impact
The pandemic did not merely affect health but also impacted income and consumption. Most countries experienced a sharp decline in economic activity in early 2020, typically followed by a V-shaped recovery. Two important questions were how households protected themselves against these economic consequences and the incidence of the consequences across the income distribution. We addressed these queries in India using the CPHS data. While some have criticized this survey as not entirely representative of poverty in rural India, those criticisms apply more to estimates of levels of poverty than changes in poverty conditional on levels.15 More importantly, there are few if any other high-frequency economic surveys, let alone panel surveys, conducted in low-income countries, including India.
We found that households took action to protect both income and vital consumption during the pandemic.16 Workers switched occupations to buffer a decline in jobs, with net flows into agriculture, which was exempt from India’s lockdown. We estimated a Roy model and found that reservation wages fell, suggesting the fall in jobs was driven by the demand for workers rather than the supply of labor. Households also sacrificed consumption of durables like clothing to protect consumption of food and fuel. A combination of social insurance and informal credit markets continued to insulate consumption through the crisis: the marginal propensity to consume did not increase during the pandemic.
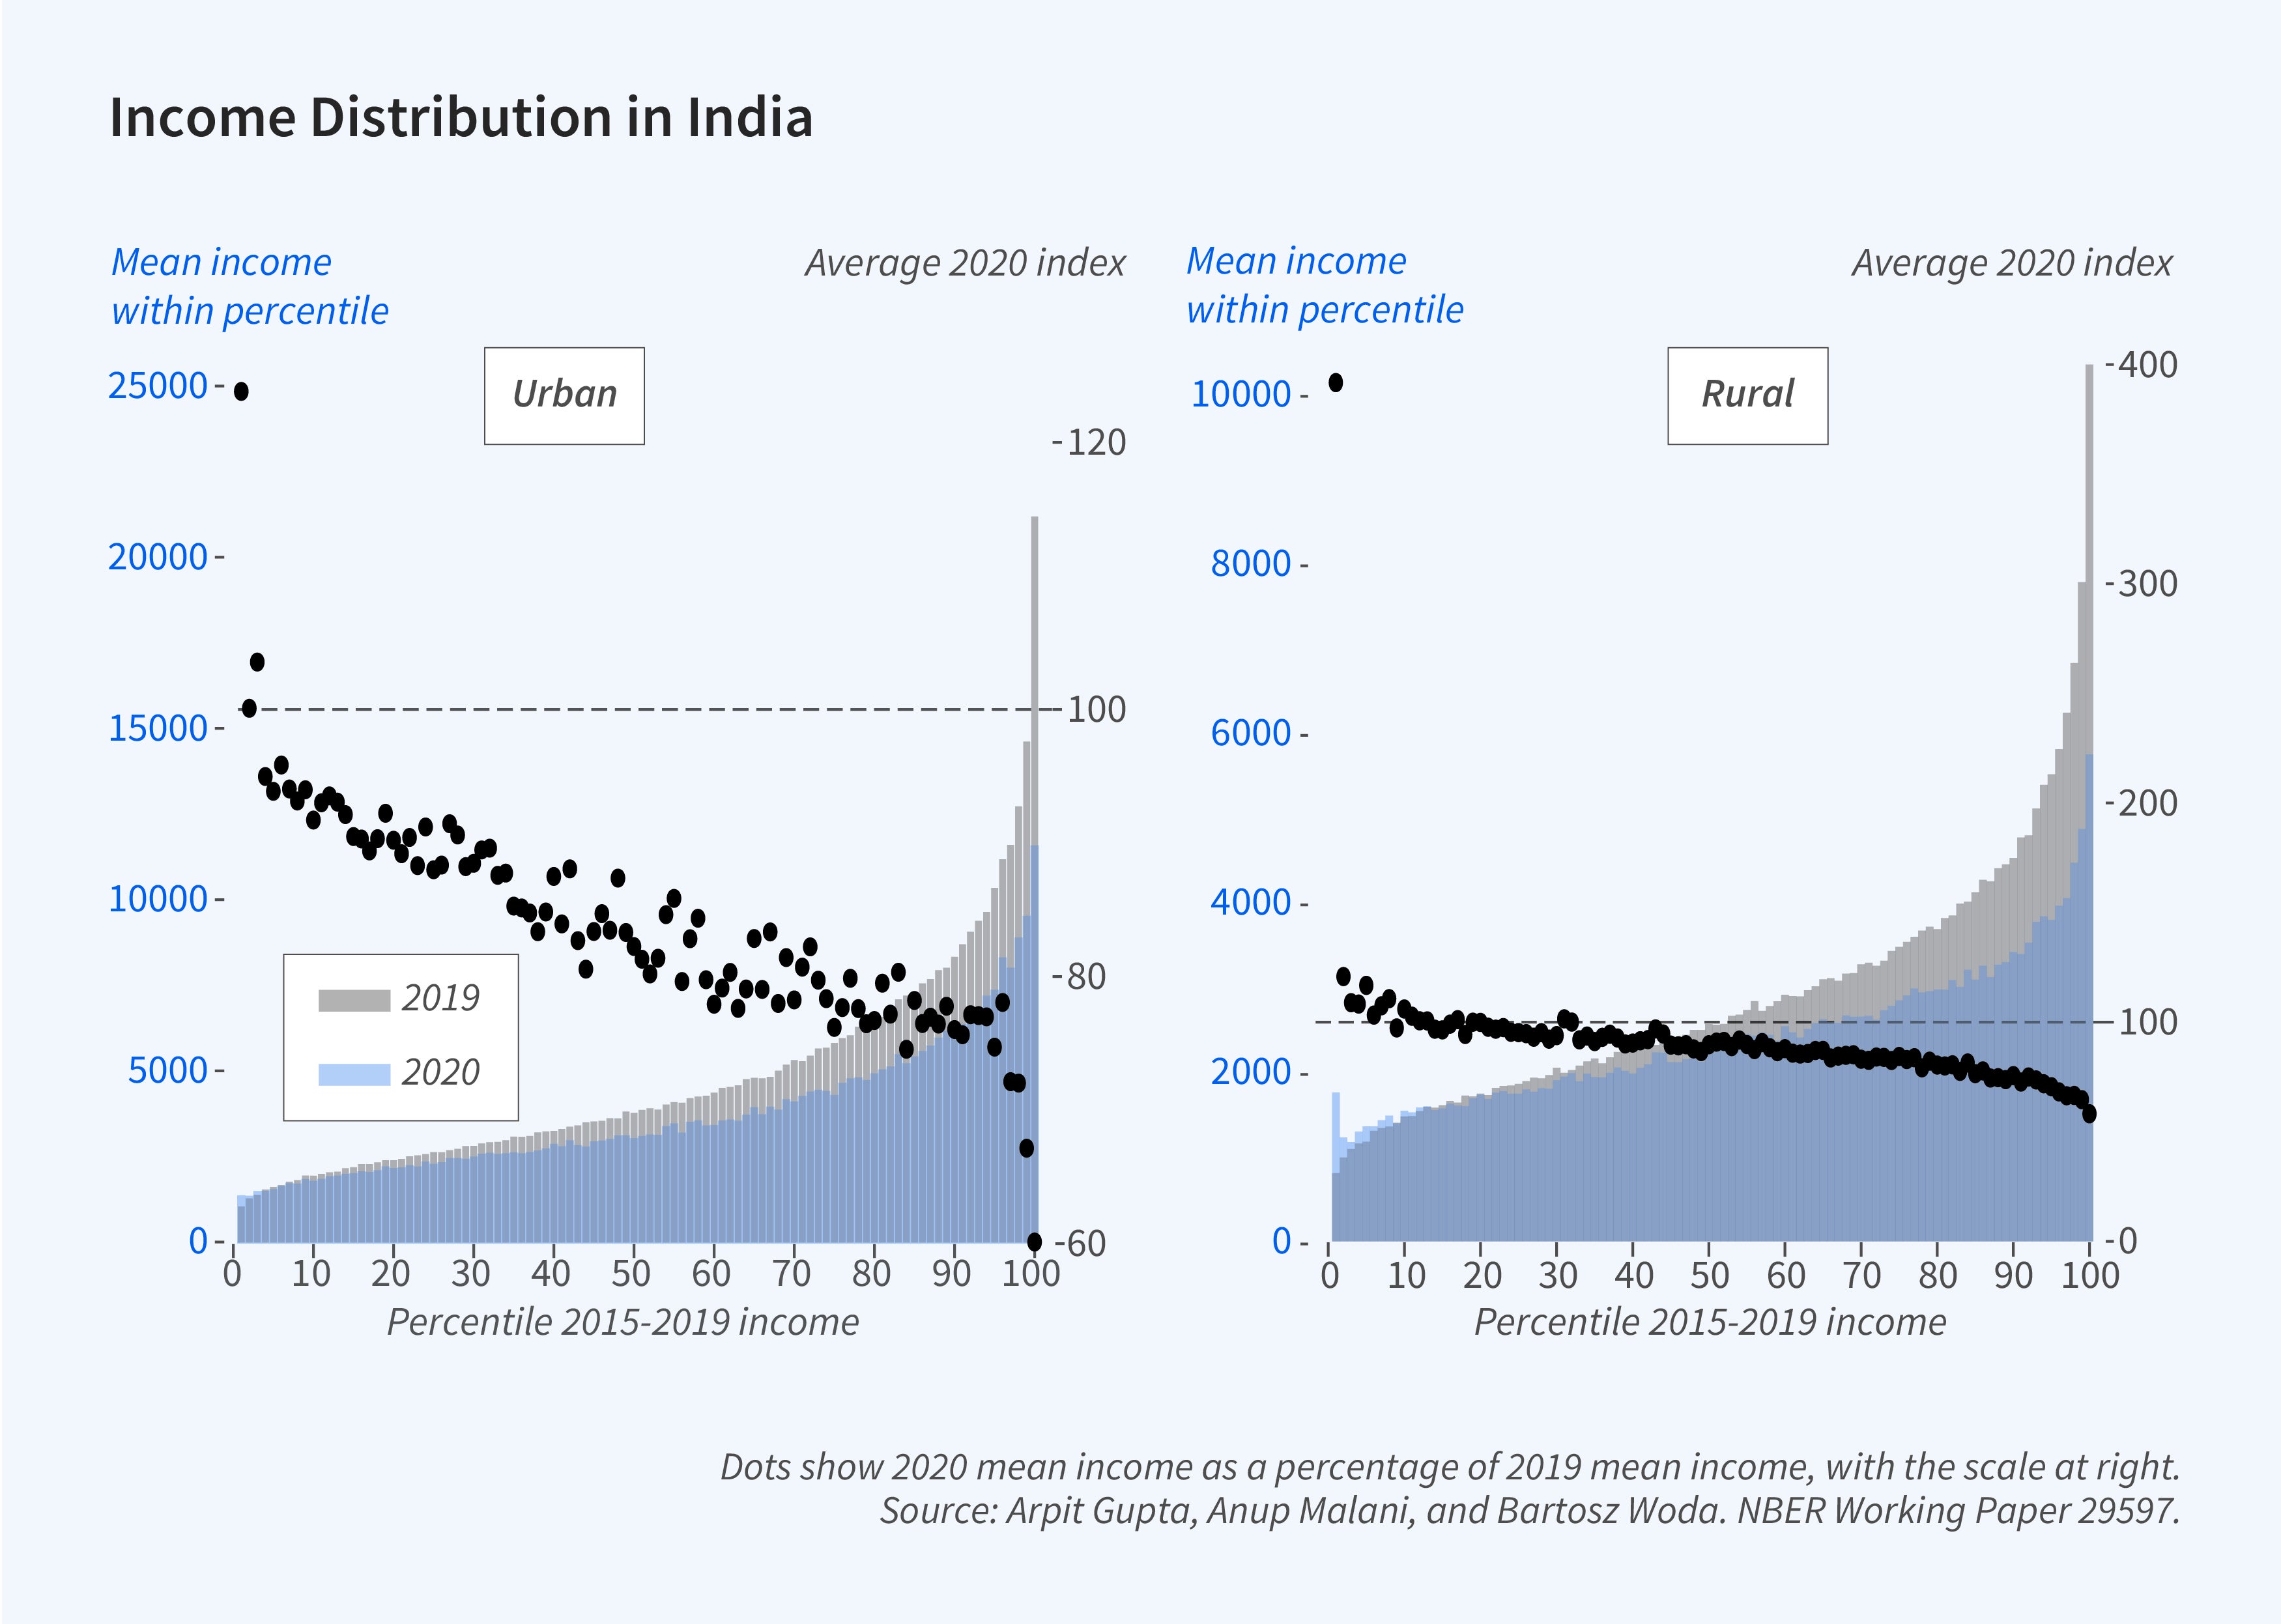
Many scholars expected and found that the pandemic increased poverty and inequality.17 Using CPHS panel data, we estimated that poverty spiked, especially during the lockdown, but income inequality fell, for two reasons. First, the capital income of top-quartile earners covaried more with aggregate income, consistent with data from the US.18 Second, demand for labor fell more for workers in higher quartiles of the income distribution. Indeed, we estimate that income losses during the pandemic increased almost monotonically with a household’s income percentile before the pandemic. Moreover, the bottom 20 percent of rural households prior to the pandemic saw no losses or gains during the pandemic (Figure 2).
Application to Policy Questions
Two policy issues headlined the government response to the pandemic: lockdowns and vaccines. Initial lockdowns were swift and covered wide areas because there was little information or time to tailor the lockdowns. But after the broad lockdowns were lifted, officials used local information to guide orders restricting local activity. By contrast, vaccination did not begin until a year into the pandemic. This permitted data analysis that could guide purchase and allocation decisions from the start of the campaigns.
Our first paper addressed questions from Indian state governments about where to focus localized, short-term lockdowns and other nonpharmaceutical interventions, such as limits on public gatherings. Our paper provided short-term forecasts of local infection reproductive rates.19 The literature had two methods for calculating these rates. One was nonparametric and frequentist, but did not account for disease dynamics.20 The other used Bayesian methods and a compartmental model of the disease.21 My collaborators and I added migration to the latter to improve the realism of standard modeling approaches, and simulated counterfactual reproductive rates under different policy responses.
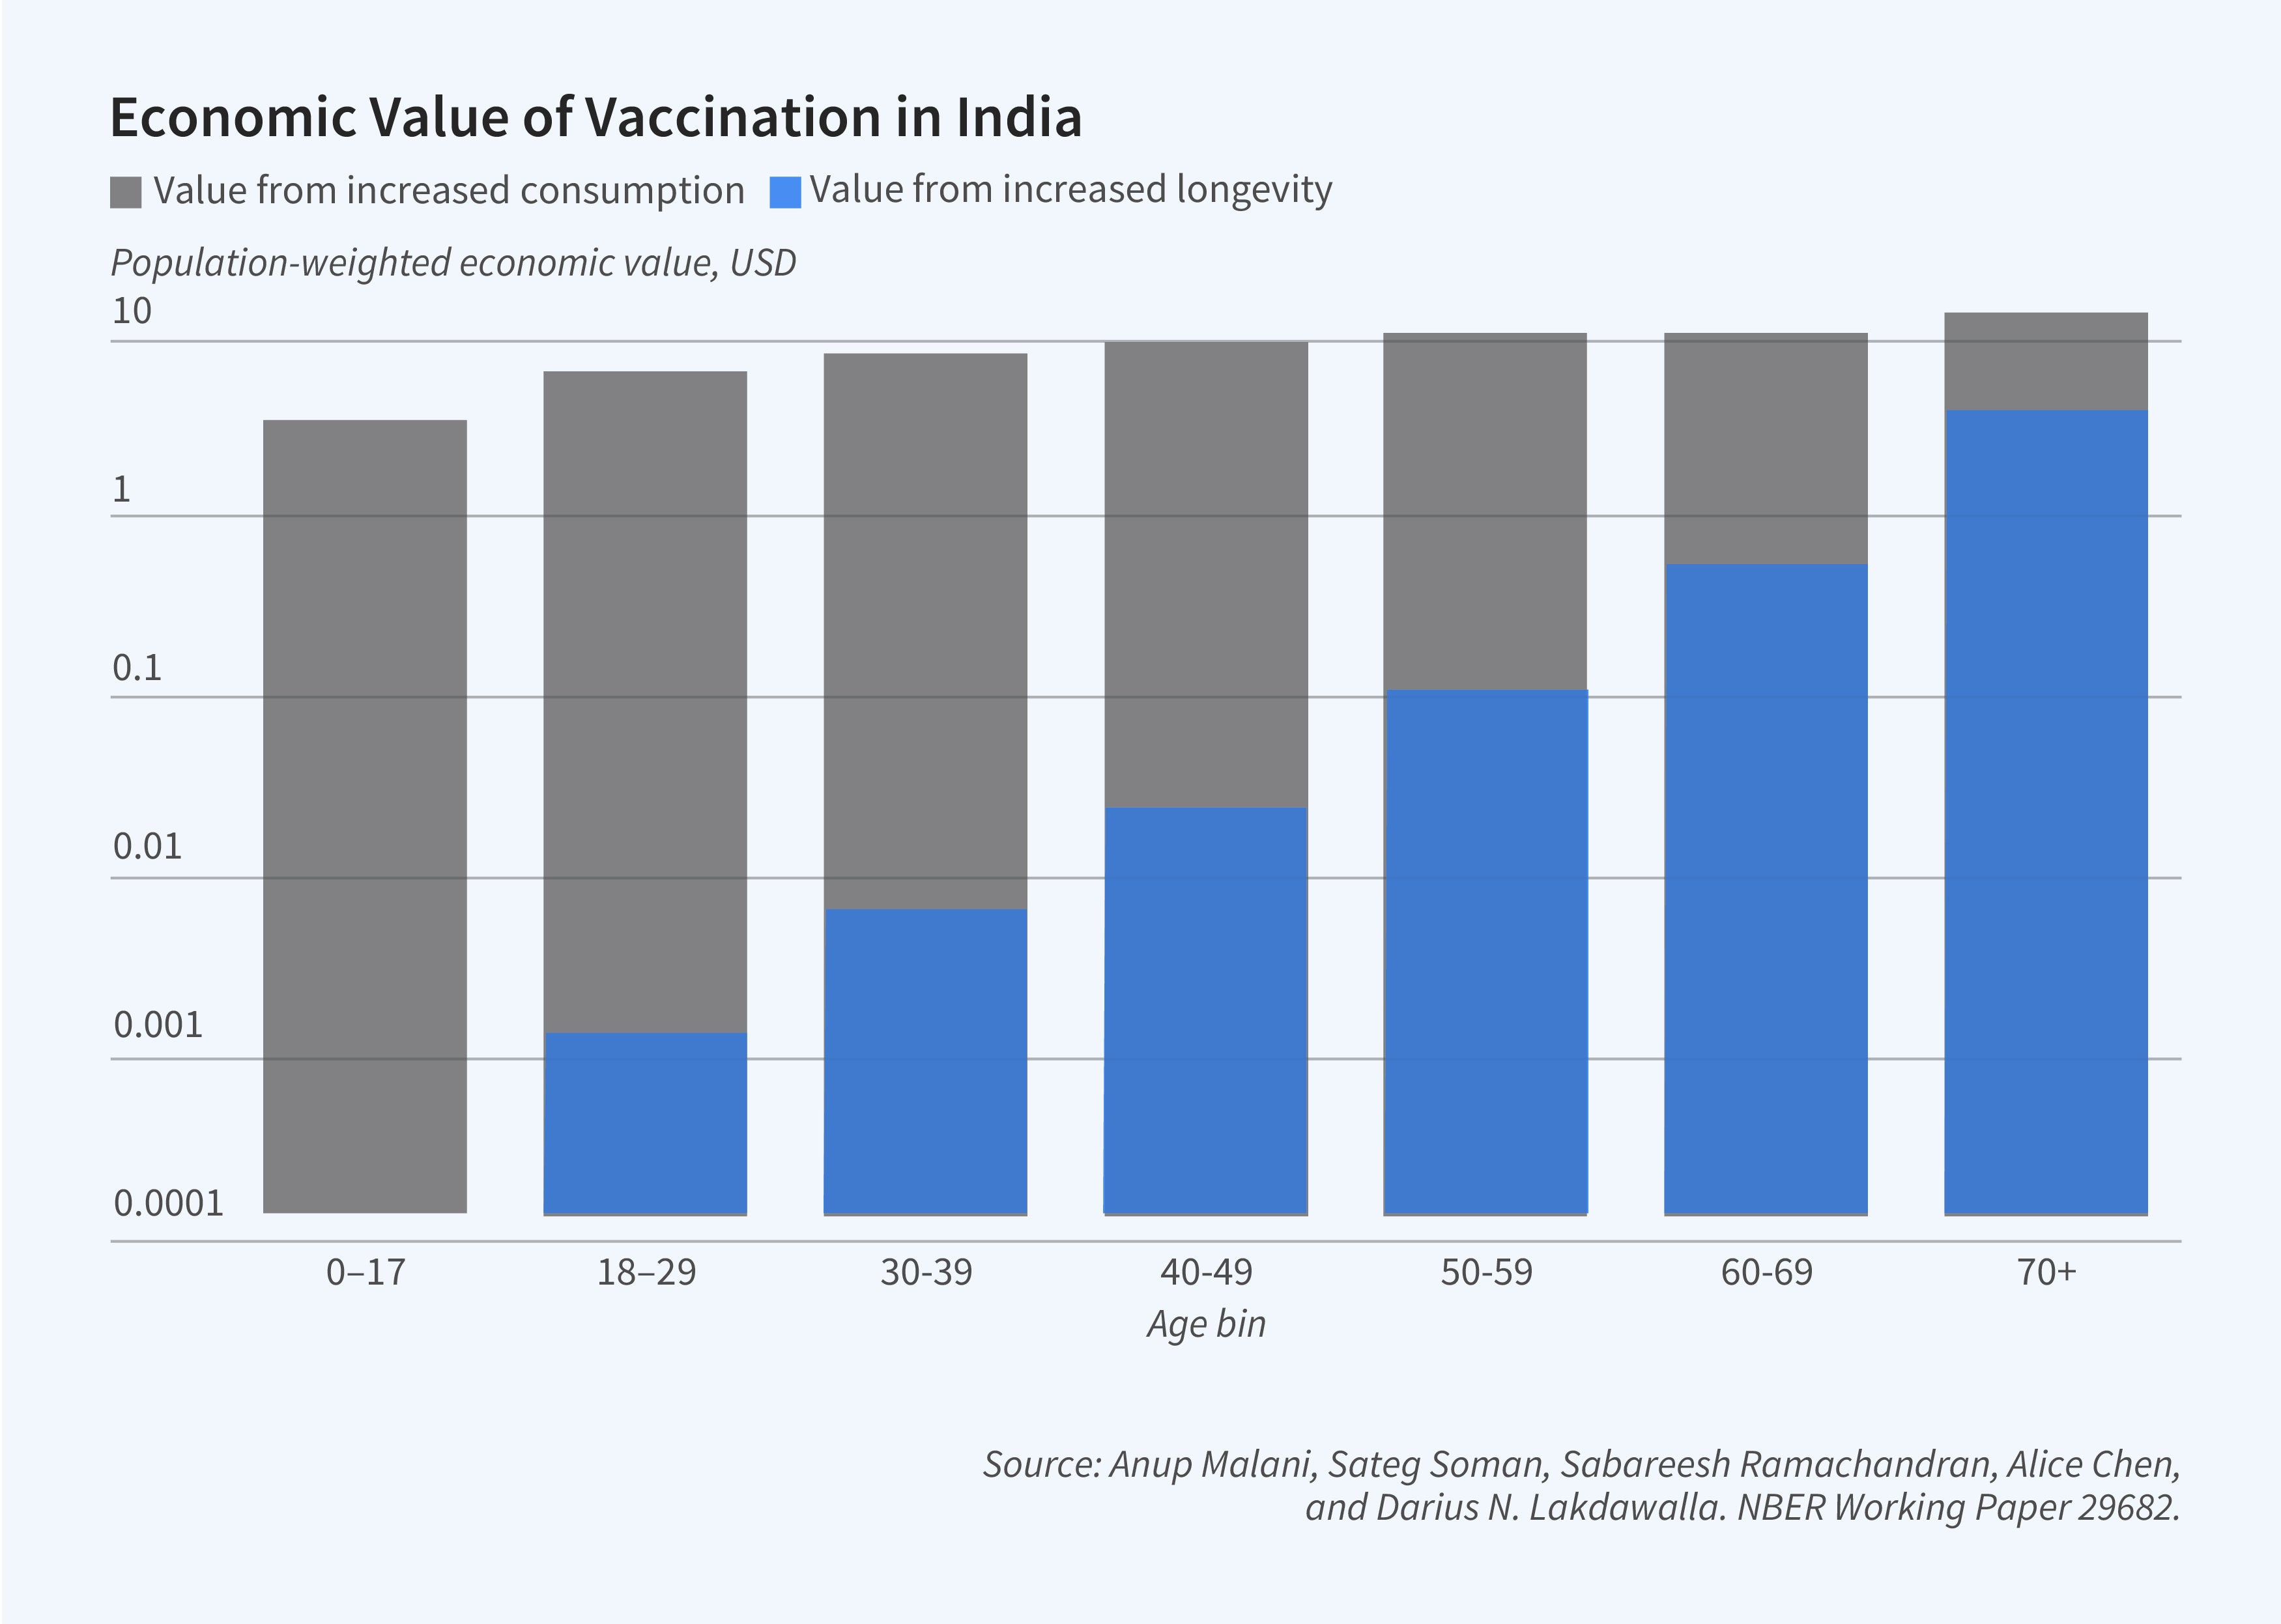
In another paper, following requests from officials in Indonesia, we addressed the welfare effects of a government purchasing different numbers of vaccines, and allocating them in different ways.22 We did not have data from Indonesia, so we used India as a case study. Our analysis combined epidemiological and economic models. We simulated how different vaccine allocations and rates would affect district-level prevalence and mortality, and then converted these simulations into social demand functions by aggregating two valuations. The first was (1) the private willingness to pay (WTP) for vaccination. We estimated the WTP to personally get vaccinated conditional on population-level vaccination rates crudely with the conditional probability of infection times the mortality rate times foregone consumption when dead. The second valuation was the private value obtained when others were vaccinated. This external effect has two parts. One is (2a) the value of lowering the risk of death conditional on not vaccinating, estimated via simulation of our epidemiological model. The other is (2b) increasing economic activity (income) for those who are not infected or killed, forecast using a regression of consumption on local infection levels using CPHS data during the pandemic.
We also use this accounting to determine how much social value from vaccination is due to increased longevity (1 plus 2a) and due to increased economic activity (2b). While mortality effects increase exponentially with age, economic value of vaccination increases more gradually with age. The reason is that younger populations disproportionately benefit from greater economic activity as vaccination slows the epidemic (Figure 3).
Our analysis yields social demand curves that change with policy choices and over time. For any given history of infections, vaccine policy, and price, our model can be used to estimate how many vaccine doses to purchase. In the model, the optimal number of doses increases with the number of people the government can vaccinate each day. The value of vaccines falls when vaccination rates slow because the virus continues to spread, and natural immunity is a substitute for vaccine-acquired immunity. The model also shows that although the social value of vaccination is greater when campaigns prioritize the elderly, if the valuation of vaccinations is based on WTP, it may be optimal to prioritize vaccinating working-age populations in higher-income regions before the elderly in lower-income regions.
Endnotes
“Does Influenza Transmission Occur from Asymptomatic Infection or Prior to Symptom Onset?” Patrozou E, Mermel LA. Public Health Reports 124(2), March–April 2009, pp. 193–196.
“Prevalence of SARS-CoV-2 among workers returning to Bihar gives snapshot of COVID across India,” Malani A, Mohanan M, Kumar C, Kramer J, Tandel V. medRxiv, June 2020.
Ministry of Statistics and Program Implementation, 2020–2021.
“Seroprevalence of SARS-CoV-2 in slums versus non-slums in Mumbai, India,” Malani A, Shah D, Kang G, Lobo GN, Shastri J, Mohanan M. The Lancet Global Health 9(2), February 2011.
“Does Mobility Explain Why Slums Were Hit Harder by COVID-19 in Mumbai, India?” Sheng J, Malani A, Goel A, Botla P. NBER Working Paper 28541, March 2021, and Journal of Urban Economics 127(103357), January 2022.
“Prevalence of SARS-CoV-2 in Karnataka, India,” Mohanan M, Malani A, Krishnan K. JAMA 325(10), February 2021, pp. 1001–1003.
“Seroprevalence in Tamil Nadu through India’s two COVID waves: Evidence on antibody decline following infection and vaccination,” Selvavinayagam TS, Somasundaram A, Selvam JM, Ramachandran S, Sampath P, Vijayalakshmi V, Kumar CAB, Subramaniam S, et al. Scientific Reports, 2024 (forthcoming).
Comparing Population-Level Humoral and Cellular Immunity to SARS-CoV-2 in Bangalore, India,” Malani A, Aiyar J, Sant A, Kamran N, Mohanan M, Taneja S, Woda B, Zhao W, et al. Research Square, November 2023.
“The Potential Beneficial Effects of Vaccination on Antigenically Evolving Pathogens,” Wen FT, Malani A, Cobey S. The American Naturalist 199(2), February 2022, pp. 223–237.
“Global Percentage of Asymptomatic SARS-CoV-2 Infections Among the Tested Population and Individuals With Confirmed COVID-19 Diagnosis: A Systematic Review and Meta-analysis,” Ma Q, Liu J, Liu Q, Kang L, Liu R, Jing W, Wu Y, Liu M. JAMA Network Open 4(12), December 2021.
“Representative Estimates of COVID-19 Infection Fatality Rates from Four Locations in India: Cross-Sectional Study,” Cai R, Novosad P, Tandel V, Asher S, Malani A. BMJ Open 11(10), October 2021.
“The civil registration system is a potentially viable data source for reliable subnational mortality measurement in India,” Rao C, Gupta M. BMJ Global Health 5(8), August 2020.
“Using Household Rosters from Survey Data to Estimate All-cause Mortality during COVID in India,” Malani A, Ramachandran S. NBER Working Paper 29192, January 2022, published as “Using household rosters from survey data to estimate all-cause excess death rates during the COVID pandemic in India,” Journal of Development Economics 159, November 2022.
“Assessing the Burden of COVID-19 in Developing Countries: Systematic Review, Meta-Analysis and Public Policy Implications,” Levin AT, Owusu-Boaitey N, Pugh S, Fosdick BK, Zwi AB, Malani A, Soman S, Besançon L, et al. BMJ Global Health 7(5), May 2022.
“Missing the Poor, Big Time: A Critical Assessment of the Consumer Pyramids Household Survey,” Somanchi A. Center for Open Science, August 2021.
“Explaining the Income and Consumption Effects of COVID in India,” Gupta A, Malani A, Woda B. NBER Working Paper 28935, June 2021.
“Falling Living Standards During the COVID-19 Crisis: Quantitative Evidence From Nine Developing Countries,” Egger D, Miguel E, Warren SS, Shenoy A, Collins E, Karlan D, Parkerson D, Mobarak AM, et al. Science Advances 7(6), February 2021. “The Economics of the COVID-19 Pandemic in Poor Countries,” Miguel E, Mobarak AM. NBER Working Paper 29339, October 2021, and Annual Review of Economics 14, April 2022, pp. 253–285.
“Worker Betas: Five Facts about Systematic Earnings Risk,” Guvenen F, Schulhofer-Wohl S, Song J, Yogo M. NBER Working Paper 23163, April 2017, and American Economic Review 107(5), May 2017, pp. 398–403.
“Adaptive Control of COVID-19 Outbreaks in India: Local, Gradual, and Trigger-based Exit Paths from Lockdown,” Malani A, Soman S, Asher S, Novosad P, Imbert C, Tandel V, Agarwal A, Alomar A, et al. NBER Working Paper 27532, July 2020.
A New Framework and Software to Estimate Time-Varying Reproduction Numbers During Epidemics,” Cori A, Ferguson N, Fraser C, Cauchemez S. American Journal of Epidemiology 178(9), November 2013, pp. 1505–1512.
“Real Time Bayesian Estimation of the Epidemic Potential of Emerging Infectious Diseases,” Bettencourt LMA, Ribeiro R. PLOS One 3(5), May 2008.
“Adaptive Control of COVID-19 Outbreaks in India: Local, Gradual, and Trigger-based Exit Paths from Lockdown,” Malani A, Soman A, Asher S, Novosad P, Imbert C, Tandel V, Agarwal A, Alomar A, et al. NBER Working Paper 27532, July 2020.


