How to Catch Cheating Students? It's Algorithmic
To identify likely cheaters, the researchers compared the predicted number and the observed number of matching answers for all possible pairs of students.
An introductory natural science course at a top American university offered in the spring of 2012 had three midterm exams and one final. Two hundred fourteen students took both the third midterm and the final. After the third midterm, two students reported that other students cheated, and the professor in charge of the course asked Steven D. Levitt and Ming-Jen Lin to develop a method to uncover the cheaters. In Catching Cheating Students (NBER Working Paper No. 21628), Levitt and Lin describe how the "simple algorithm" they developed enabled them to identify roughly 10 percent of students who were very likely to have cheated on the third midterm.
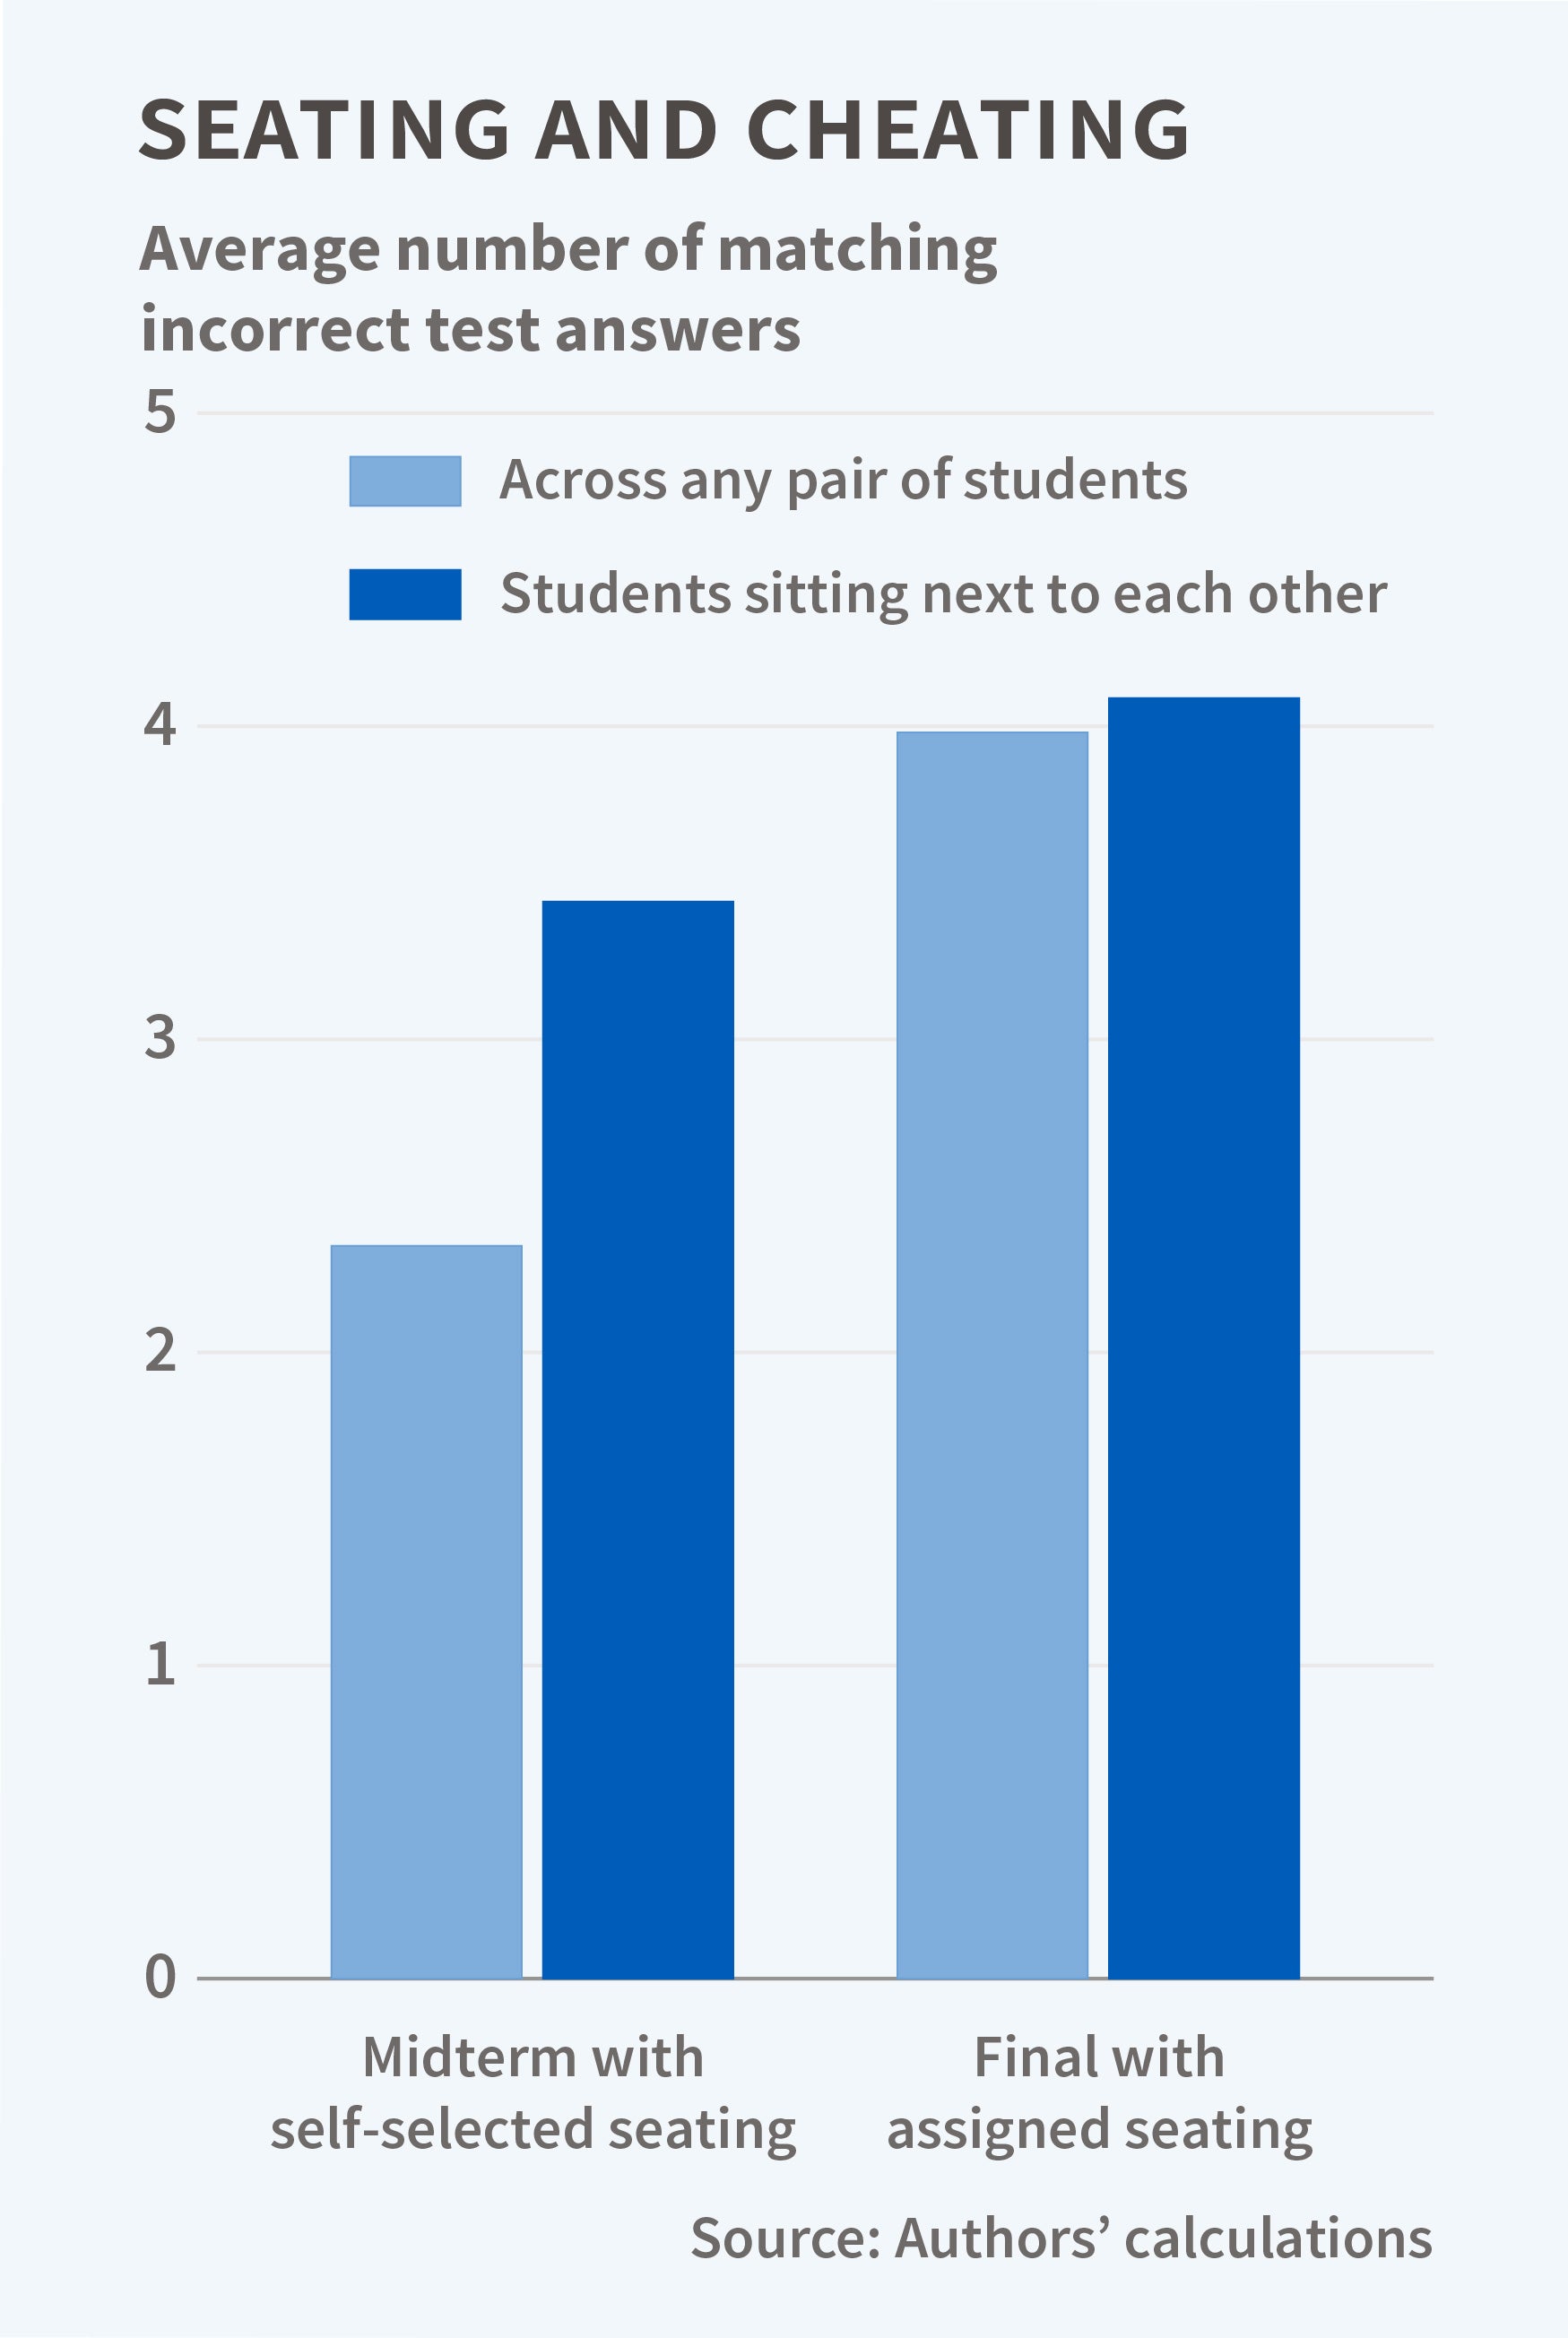
Nearly every classroom seat was occupied when students took the midterm exam. Students chose their own seats; there was one test monitor, and seating positions were recorded. Students also chose their own seating positions when they arrived to take the final exam. Again their choices were recorded. But before the final exam was handed out, students were moved to randomly assigned seats. The exams were multiple choice tests. There were two versions of the final with the same questions in different order.
The researchers hypothesized that the simplest way to cheat is to copy from the student sitting next to you. They compared the number of matching pairs of incorrect answers in all of the theoretically possible 22,791 pairs of students who took the third exam with the number of matching pairs of incorrect answers in pairs of students who actually sat next to one another. Because the typical student answered most of the questions correctly, the mean number of shared incorrect answers across all theoretical pairs of students was 2.34. Cheating was a likely explanation when student pairs actually sitting next to one another averaged an additional 1.1 shared incorrect answers, more than would be expected by chance alone.
To identify pairs of potential cheaters, the researchers compared the predicted and observed matching answers for all possible pairs of students, using the percentage correct on each of the midterms and the final to model a student's predicted answer to a particular question. Then they calculated the predicted number of matching answers for each pair and compared it to the actual number of matching answers observed for each pair. The difference between observed and predicted matching answers was computed both for matching correct and matching incorrect answers. Matching incorrect answers were a stronger indicator of potential cheating. Student pairs with more than six residual matching incorrect answers showed up as clear outliers in a scatter plot.
Some pairs of students who sat next to one another were more than 60 times more likely to be in the upper one tenth of one percent of the distribution of the number of residual matching incorrect answers than randomly constructed pairs. About nine percent of the pairs, consisting of 18 students, showed up in the extreme tail. By chance, less than one pair of students sitting together should have shown up there.
When seating was randomized for the final, the distribution of the percentage of residual matching incorrect answers was indistinguishable from one that would have been produced by chance. The distribution of residual matching correct answers still had more pairs of students with relatively high numbers of matches than one would expect. After examining the possibility that students studying together might be more likely to produce matching correct answers, the authors concluded that even with randomized seating four students probably cheated on the final.
—Linda Gorman


