Investment Returns of Nonprofit Endowments
Endowments sustain the operations and activities of many nonprofit organizations, yet little is known about how they are invested or the returns that they earn. In The Risk, Reward, and Asset Allocation of Nonprofit Endowment Funds (NBER Working Paper 34078), Andrew W. Lo, Egor V. Matveyev, and Stefan Zeume present new facts about the function, asset allocation, and returns of US nonprofit endowments.
The researchers collect the tax return filings, specifically Form 990, for nearly 375,000 public nonprofit organizations for fiscal years 2008 through 2020. They identify approximately 40,000 endowments. The forms report information on organizations’ missions, activities, governance structures, officers and directors, balance sheets, income statements, and asset allocations.
Organizations that have endowment funds are larger, older, have more employees and volunteers, and spend more on charitable activities than those that do not. They spend a smaller fraction of their budget on administrative expenses, and they tend to grow faster. On average, 29.6 percent of an organization’s total assets are held in an endowment. Hospitals, with only 6 percent of funds in endowment, are notably different from other nonprofits on this dimension.
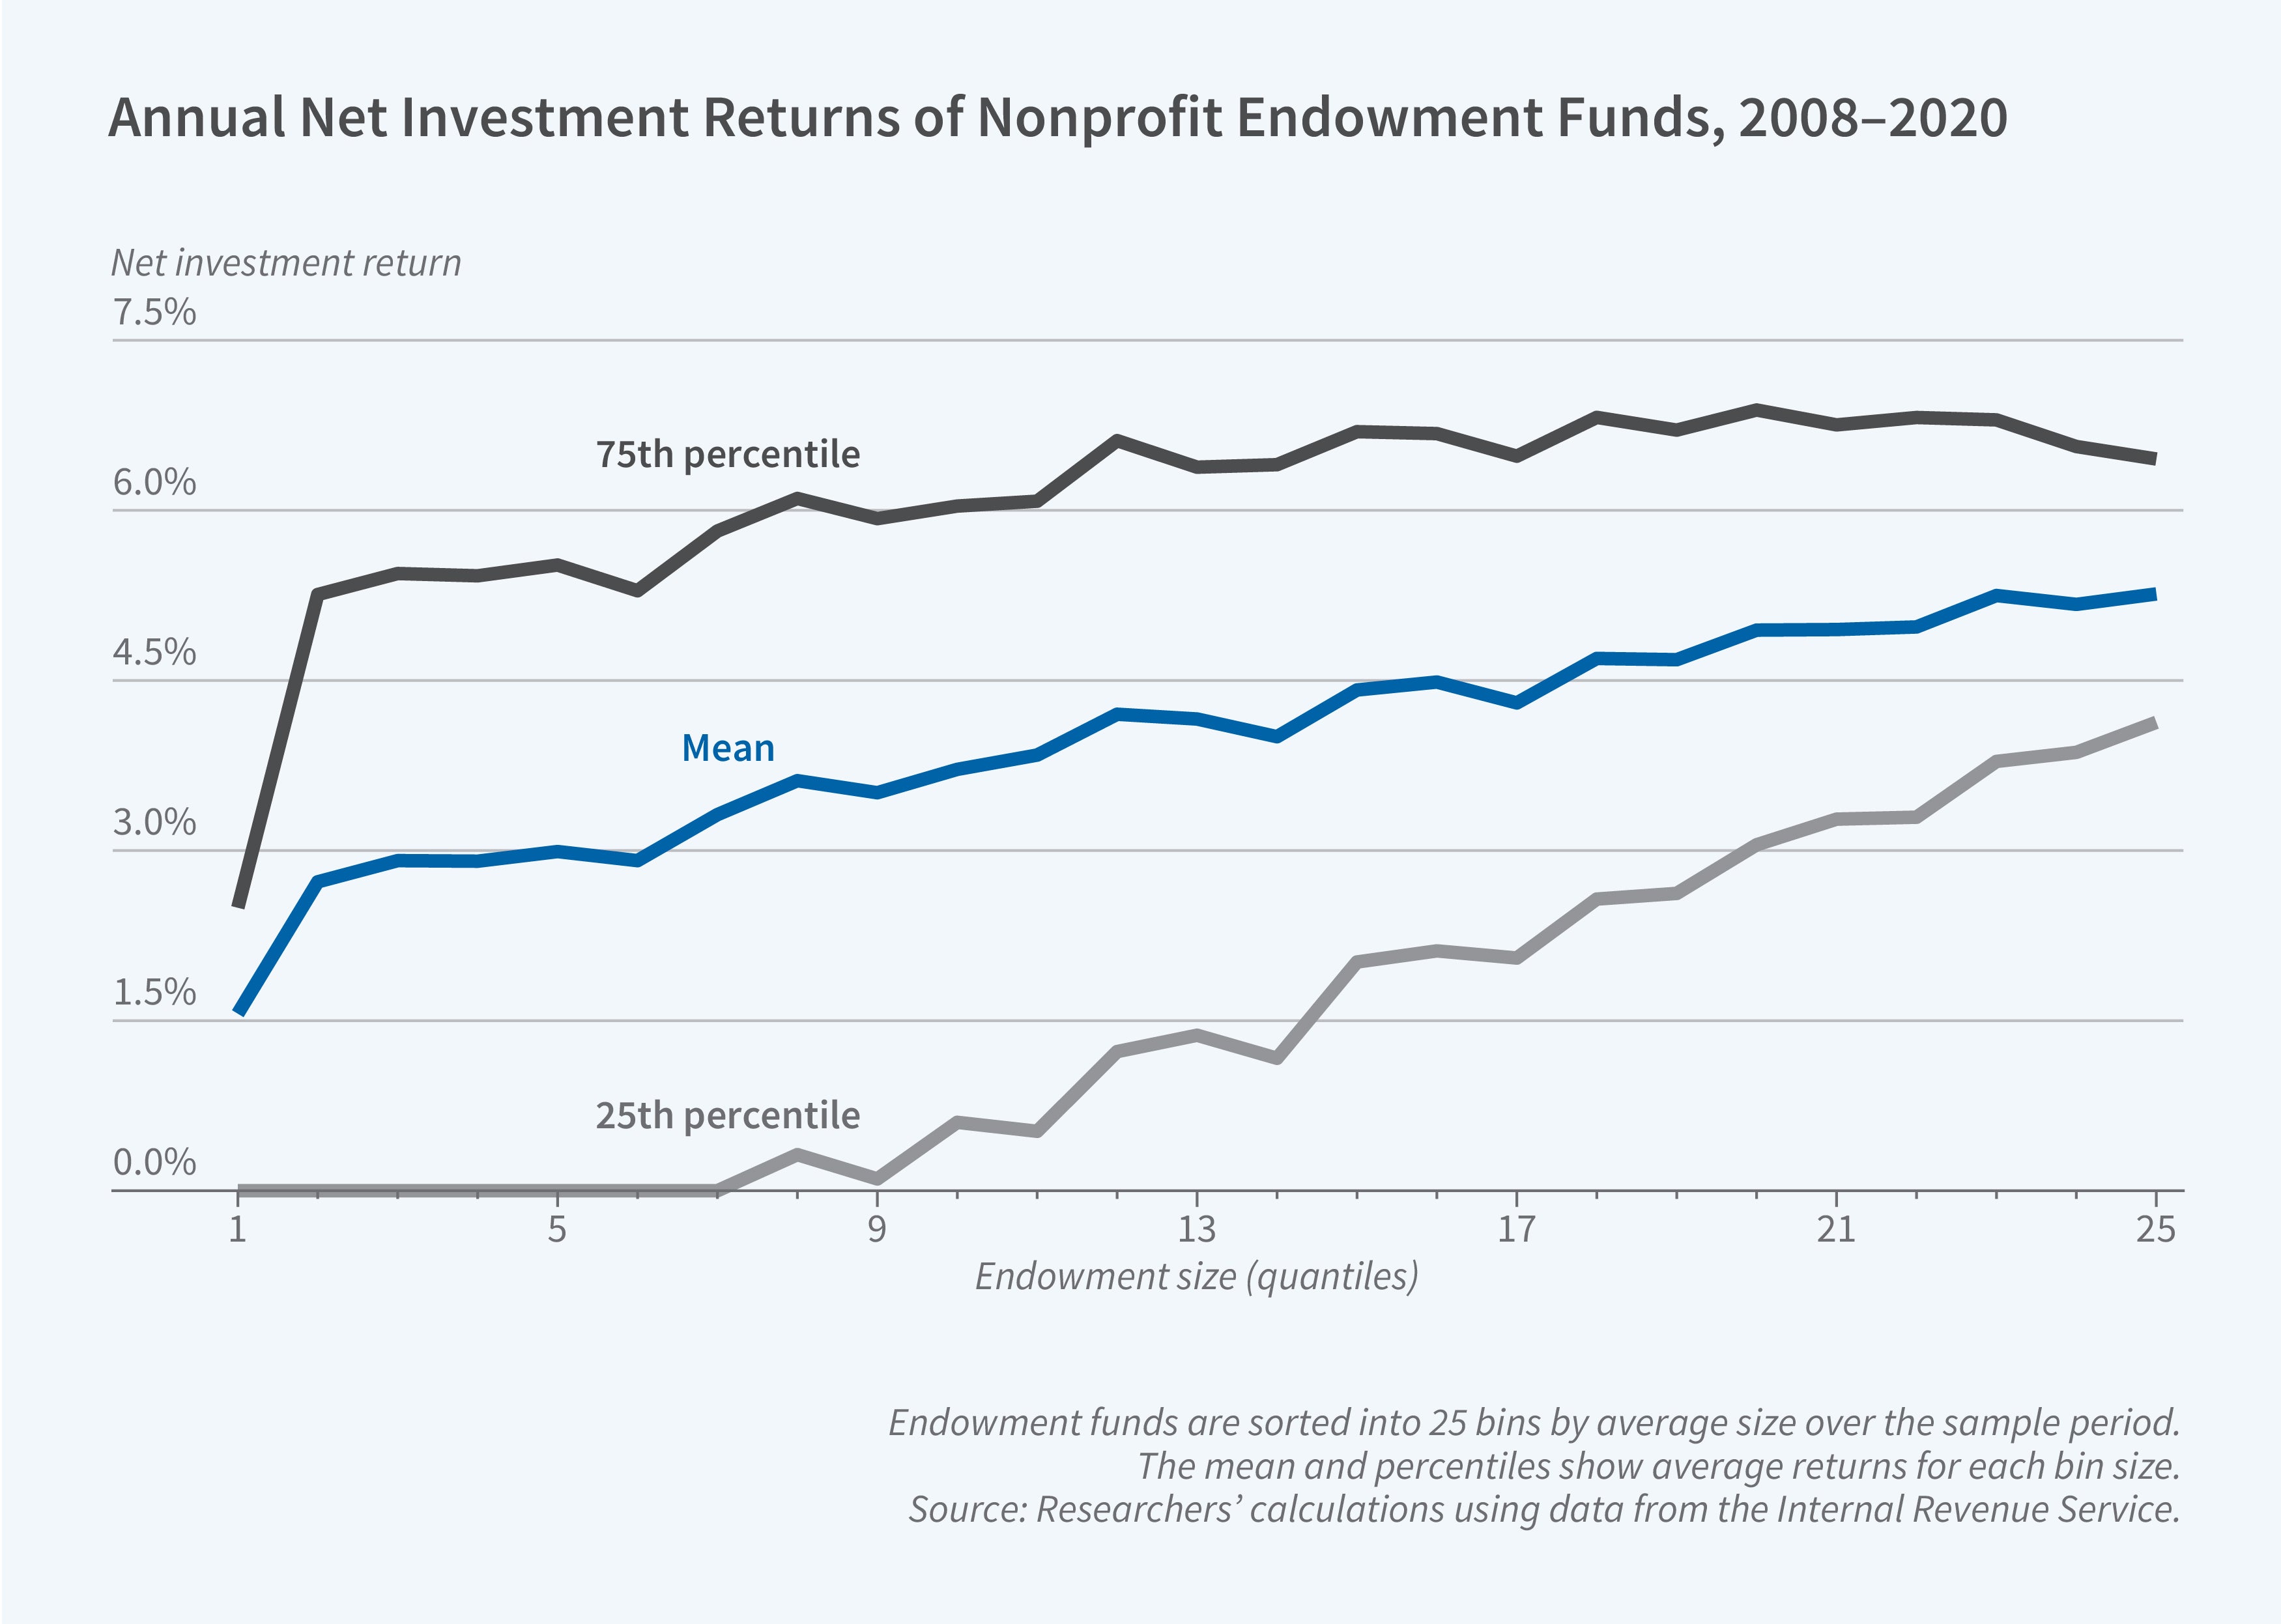
Over the 2008–20 period, endowment funds experienced a median annual growth rate of 3.4 percent. There are a small number of institutions with much higher growth; the mean is 9.4 percent. Endowments receive inflows from contributions, which are high at inception but then fall, and investment returns. On average, returns account for two-thirds of endowment growth, but for the median endowment, they account for nearly 95 percent. The average net investment return is 4.3 percent, but there is a wide spread.
The endowments’ portfolio allocations to public equity increased between 2008 and 2020, while allocations to fixed income and cash declined. Allocations to other assets, including private equity, venture capital, hedge funds, real assets, and real estate, were stable. Smaller funds were significantly more likely to invest in individual stocks and bonds. Large endowments allocated about 35 percent to international equity, whereas smaller funds allocated a much smaller share.
Organizations in sectors that are sometimes called upon in emergencies, such as environment, religion, and human services, exhibit relatively high allocations to safe assets. In contrast, higher education and hospitals, which are supported more by consistent revenue, invest more in asset classes other than public equity, fixed income, and cash.
Charitable giving is procyclical. A 1 percent market return is associated with a 3 percent increase in donation growth; therefore, organizations dependent on donations are more exposed to aggregate market risk. These organizations allocate less to public equities and hold more cash and fixed-income securities.
Large funds earn higher returns than small ones. The largest funds have an average net return of 4.73 percent, compared to 3.75 percent for the smallest ones. This pattern is observed in every nonprofit sector. The average Sharpe ratio, which measures the risk-adjusted investment return, was 0.535 across all endowment funds, and the average Relative Sharpe Ratio was 0.759 when the comparison portfolio held 40 percent US equities, 20 percent international equities, 20 percent investment-grade bonds, 10 percent real estate, and 10 percent cash. This means that the average endowment’s risk-adjusted performance was 24.1 percent lower than the benchmark’s Sharpe ratio.
Only 3.8 percent of nonprofits employ a chief investment officer, and those that do underperform those that do not by 20 basis points in net returns. About 60 percent of organizations do not utilize investment management services; those that do not report net returns 40 basis points lower than those that do. Average annual investment management fees are 0.63 percent of assets under management. There is a weak positive association between fees and gross returns. The higher returns are not enough to justify the high management fees, however, and the association between fees and net returns is strongly negative.
Organizations with higher administrative expenses and more highly compensated employees tend to have lower endowment returns. Those with larger boards (25 percent have fewer than 10 members) and more-independent directors generate higher returns. Organizations where CEOs capture larger shares of total compensation (averaging 55.9 percent) also tend to have higher endowment returns.
— Whitney Zhang


