Municipal Debt and Public Services During the Great Depression
The value of the US municipal bond market in early 2025 was $4.2 trillion. This substantial debt burden exposes local governments to significant financial risks during downturns. While in recent decades US cities have often received federal assistance during recessions—like the $350 billion Coronavirus Local Fiscal Recovery Fund during the COVID-19 pandemic—such support mechanisms are relatively recent innovations in American fiscal federalism.
In Public Goods Under Financial Distress (NBER Working Paper 34011), Pawel Janas examines how municipal debt affected local public services during the Great Depression. This historical setting offers two key advantages for analysis: local governments were the primary providers of public services with minimal higher-level fiscal support, and they sustained severe financial shocks without subsequent aid from the intergovernmental transfers that characterize modern fiscal arrangements.
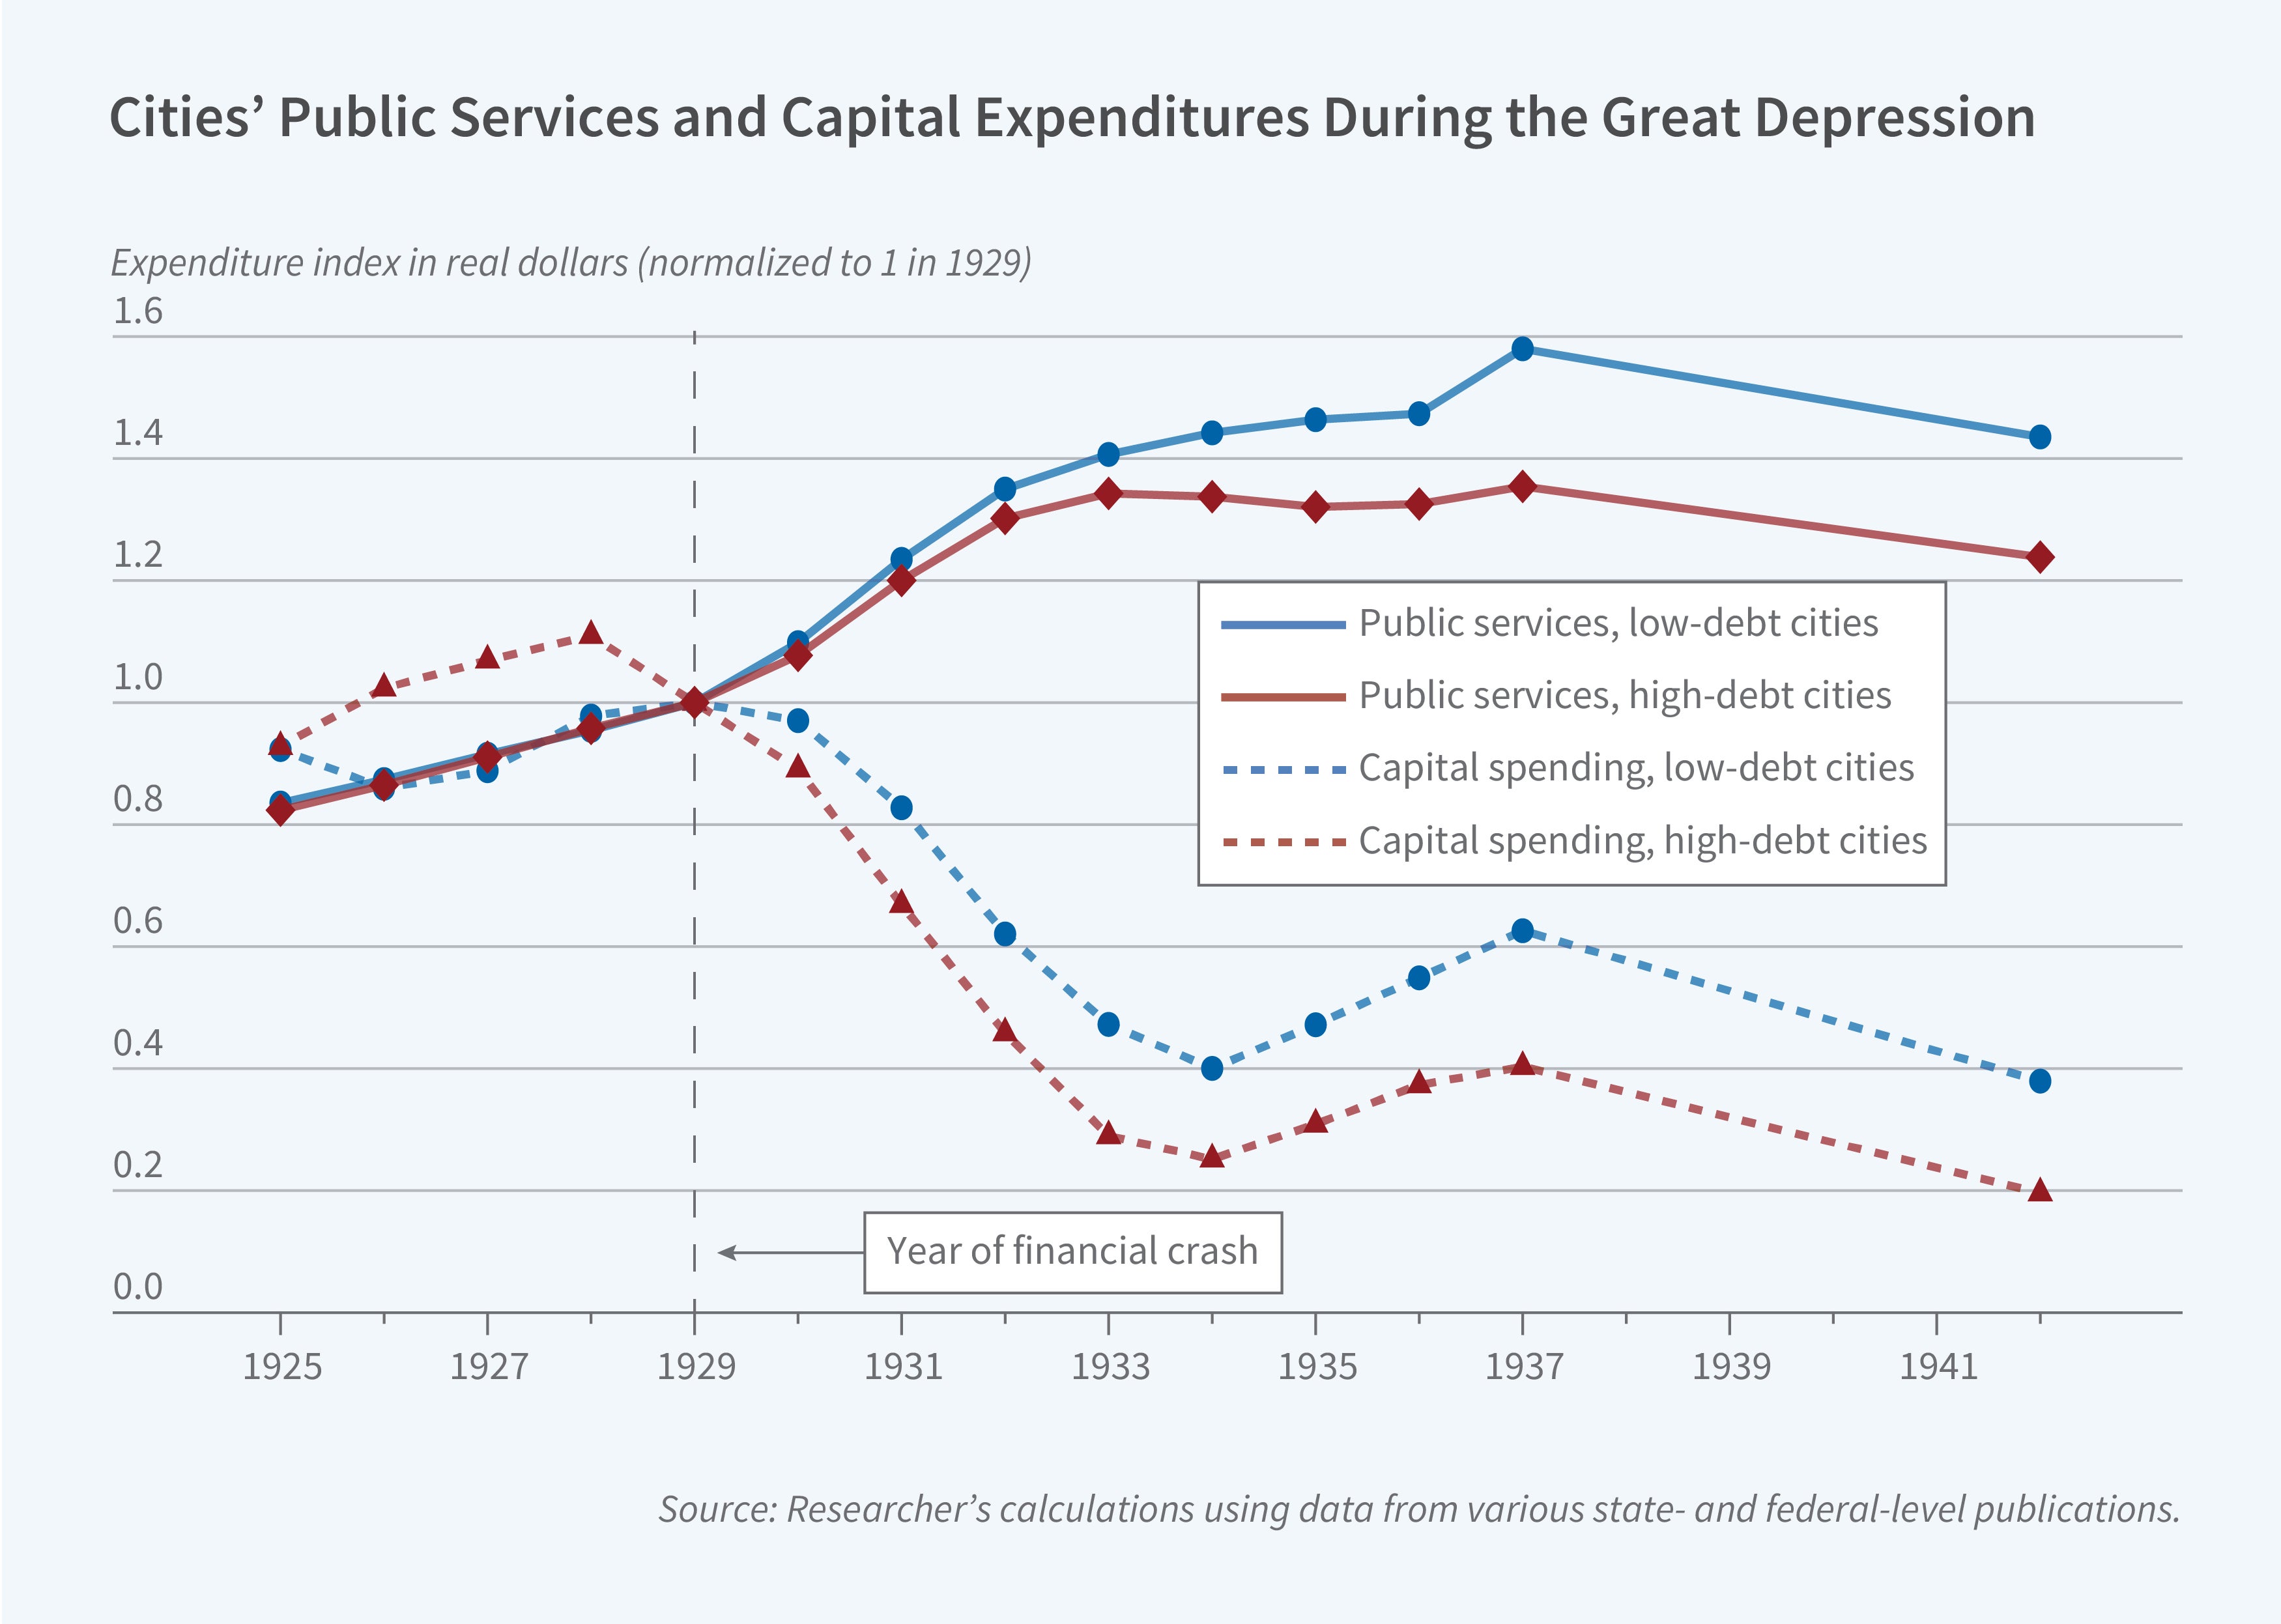
Cities with more debt maturing, which were highly exposed to the financial market turmoil of the Great Depression, made larger cuts in public spending.
To investigate these relationships, the researcher constructs a comprehensive dataset covering over 700 US cities between 1924 and 1943. The data include annual financial transactions, outstanding municipal debt, crime statistics, mortality records, and linked census information on local government workers. This allows for analysis of specific city-level spending programs and their impacts on urban communities.
The research identifies financial leverage—particularly the need to refinance existing debt—as a key constraint on public services during the crisis. Cities with higher pre-Depression debt levels made significantly deeper cuts to expenditures during the downturn. Municipalities in the 75th percentile of leverage reduced service expenditures by 3 to 7 percentage points more and capital investments by 15 percentage points more than cities in the 25th percentile during 1929–38.
Cities with more debt maturing during the Depression years faced acute financial pressure regardless of local conditions. They made deeper cuts to both capital projects and ongoing services than cities with more favorable maturity schedules. The effect was especially large in counties experiencing banking panics, suggesting financial intermediation costs were substantial. In contrast, there is limited support for alternative explanations of spending cuts, such as cities that had recently spent heavily on infrastructure not needing to invest more. Outstanding debt was predictive of spending cutbacks for these cities, too.
A 1 standard deviation increase in debt maturing during the Depression was associated with a 0.9 percentage point reduction in population growth between 1930 and 1940, widening to 2.7 percentage points by 1950. High-debt cities also experienced 107 more property crimes per 100,000 residents in 1933 than other cities—approximately 4 percent above the 1930 baseline—and saw a higher exit rate from public sector employment. Exiting workers generally moved down the occupational ladder, and financial leverage shaped who left—more educated, higher-skilled workers were less likely to remain in high-debt cities.
This research has been supported by the Kellogg Dean’s Office Research Grant, the Arthur H. Cole Dissertation Fellowship from the Economic History Association, and the Linde Institute at Caltech.


