Unpacking the Causes of Pandemic-Era Inflation in the US

After several decades of relatively low and stable inflation, in 2021 the US experienced a sharp rise in the pace of price increases. The annual inflation rate, as measured by the Consumer Price Index, was 1.7 percent in February 2021 but rose to more than 5 percent in June 2021. It continued rising for another year, peaking at about 9 percent in June 2022.
The rise in the inflation rate has been attributed to many factors. The US response to the COVID-19 pandemic included a series of federal initiatives, notably the CARES Act and the American Rescue Plan, which collectively authorized roughly $5 trillion in government spending. These programs contributed to strong consumer and business demand, which tightened labor markets (between mid-2021 and early 2022 the ratio of job vacancies to unemployed workers doubled), putting upward pressure on wages and prices.
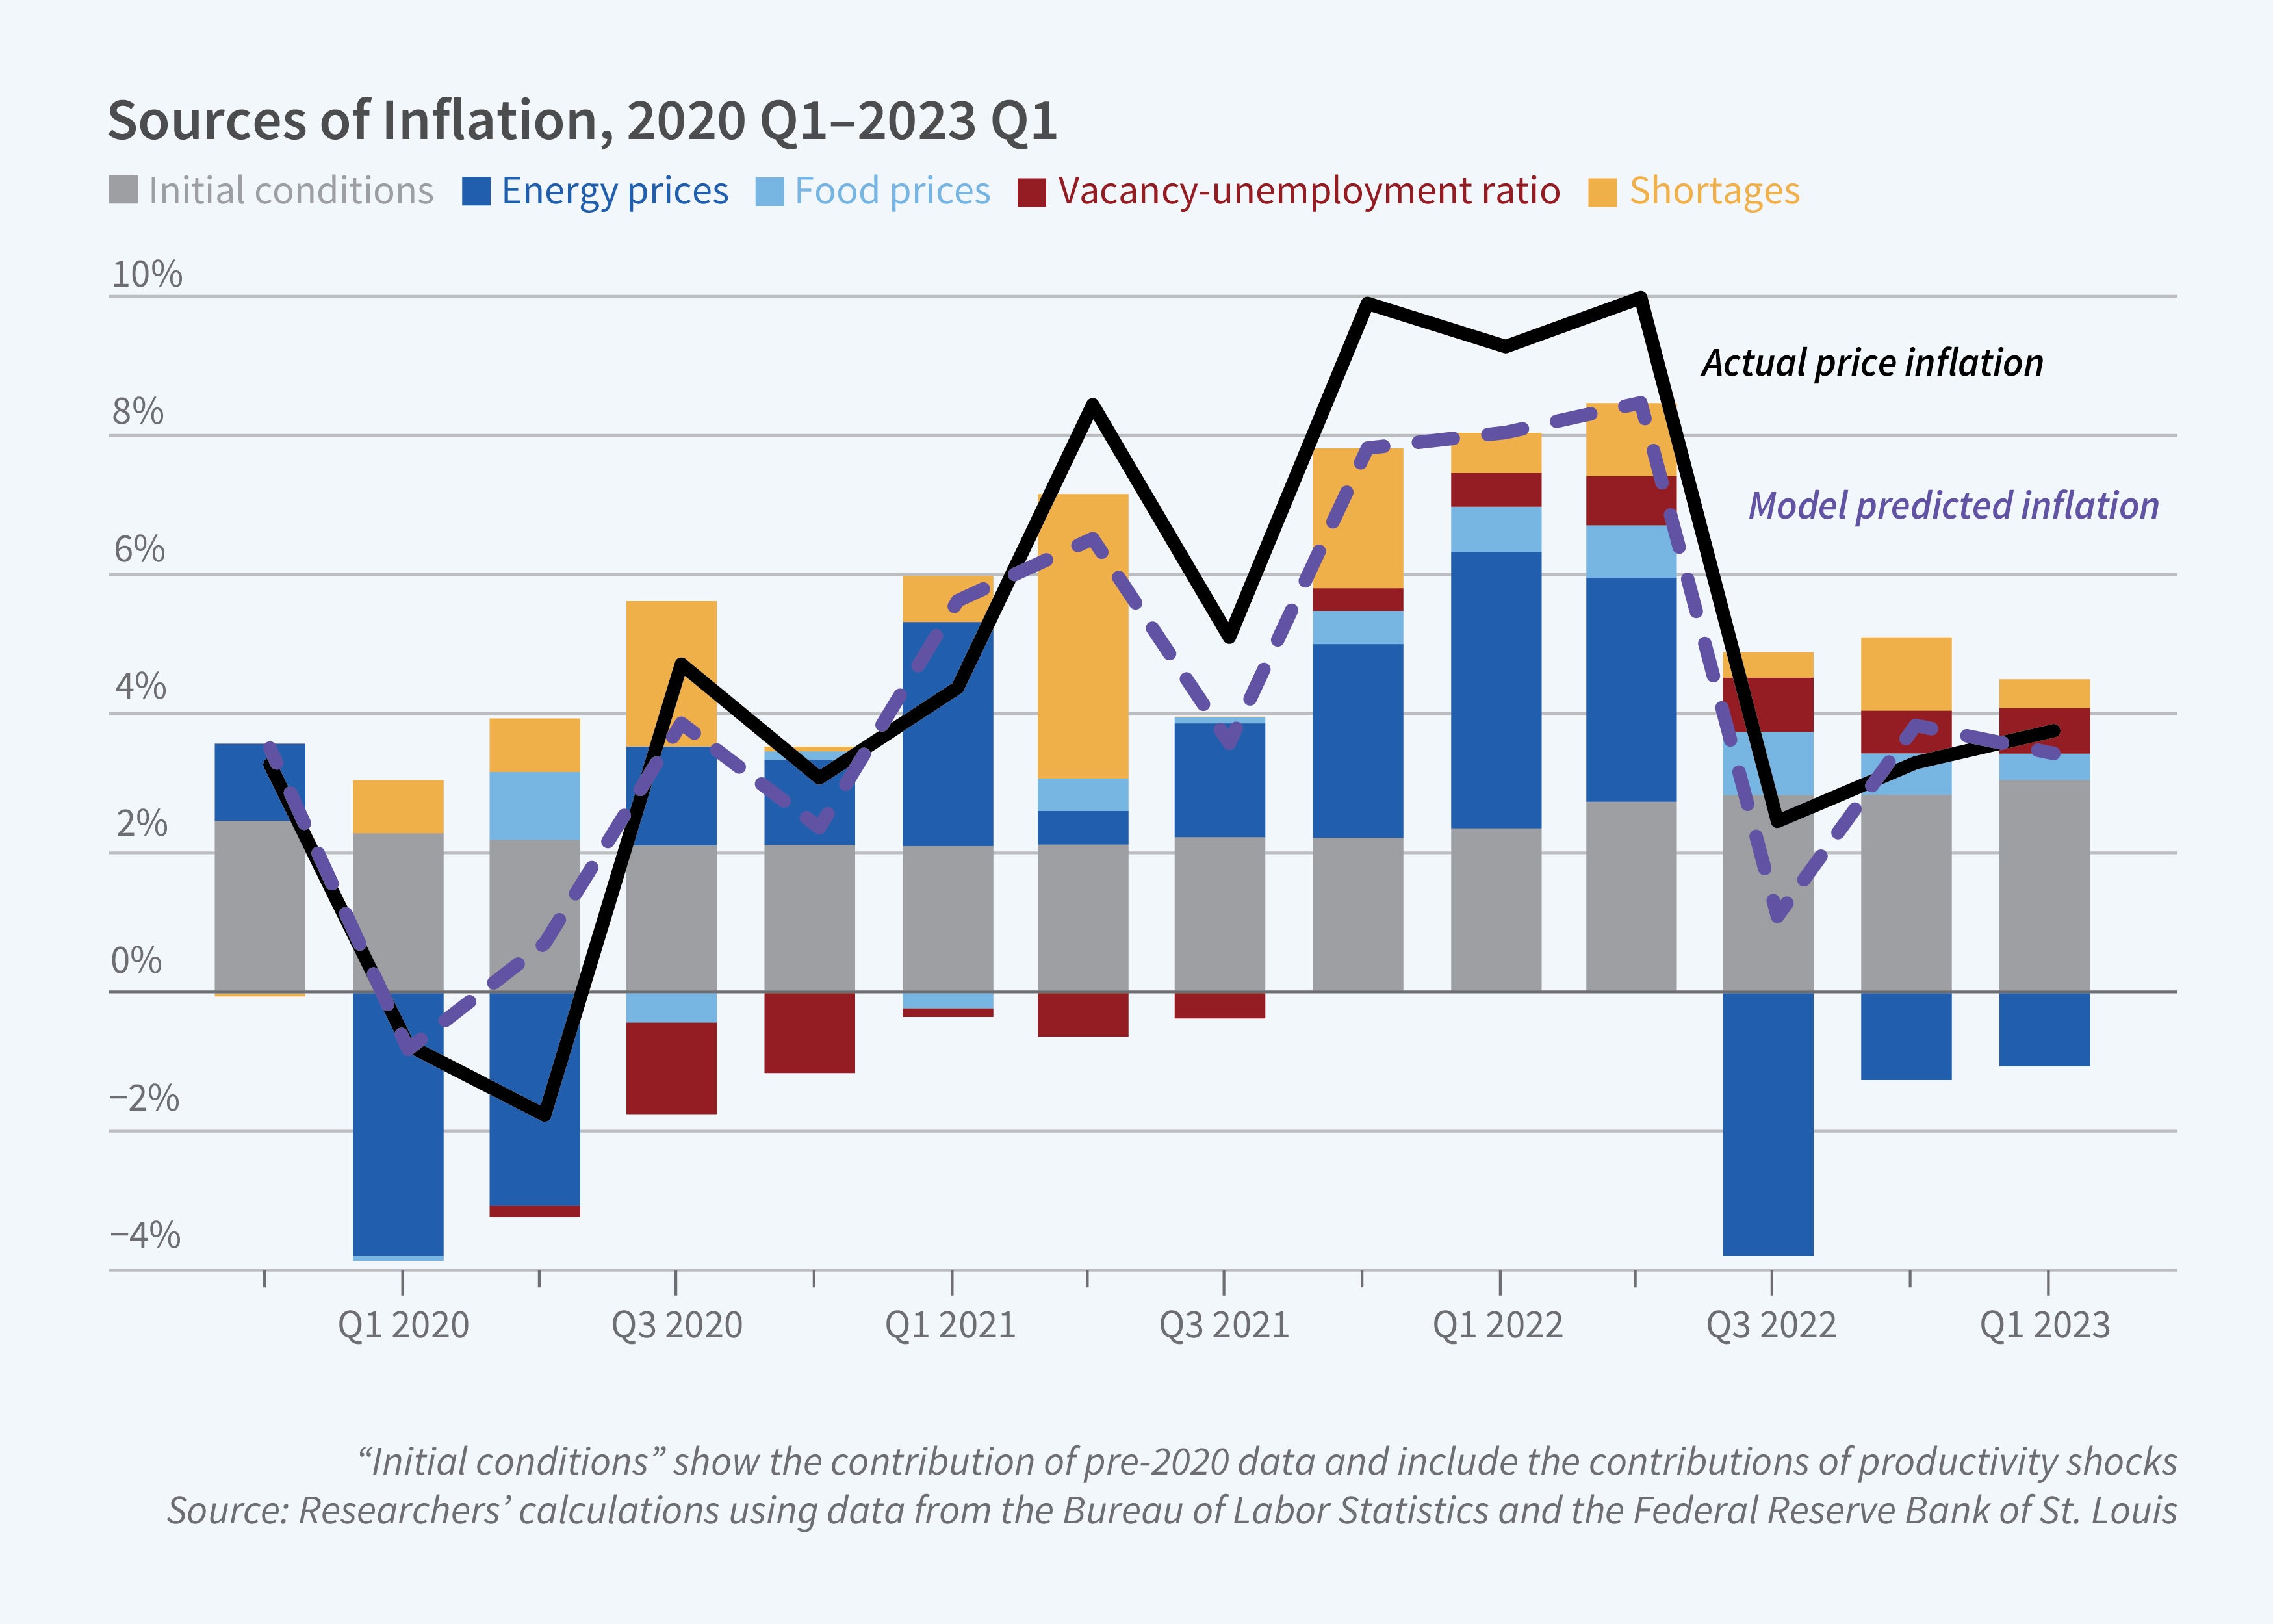
Rising commodity prices and supply chain disruptions were the principal triggers of the recent burst of inflation. But, as these factors have faded, tight labor markets and wage pressures are becoming the main drivers of the lower, but still elevated, rate of price increase.
On the supply side, supply chain disruptions had an important inflationary impact, particularly in 2021 and 2022. The auto industry is a case in point. US auto production dropped from 11.7 million vehicles in July 2020, roughly the pre-pandemic rate, to less than 9 million in the fall of 2021, reflecting shortages of computer chips and other inputs. The combination of strong demand and supply chain bottlenecks led to further pressure on prices, particularly on prices of durable goods. Rising prices of food and energy added importantly to inflation. Notably, the crude oil market was disrupted by the Russian invasion of Ukraine in early 2022. The price of West Texas Intermediate crude oil rose from less than $70 per barrel in the late summer of 2021 to more than $100 per barrel for most of the period between March and July of 2022, pushing up gasoline prices and the costs of many industrial inputs.
The relative importance of these factors, and others, in contributing to US inflation that began in mid-2021 is an open question. In What Caused the US Pandemic-Era Inflation? (NBER Working Paper 31417), Olivier J. Blanchard and Ben S. Bernanke study the historical comovement of wages, prices, and inflation expectations in an effort to measure the relative contributions of the sources of the recent US inflation shock. They estimate the relationships between price inflation, wage inflation, commodity price shocks, shortages, and labor market tightness over the period from 1990 to the start of the pandemic, and then use their estimates to simulate the inflationary effects of the various shocks that buffeted the US economy from the beginning of 2020 to early 2023.
The researchers find that energy prices, food prices, and price spikes due to shortages were the dominant drivers of inflation in its early stages, although the second-round effects of these factors, directly through their effects on other prices or indirectly through higher inflation expectations and wage bargaining, were limited. The contribution of tight labor markets to inflation was initially quite modest. But as product market shocks have faded, the tight labor market and the resulting persistence in nominal wage increases have become the main factors behind wage and price inflation. This source of inflation is unlikely to recede without macroeconomic policy intervention.


