The Effects of Job Loss on Low-Wage Workers
The effect of job losses on workers’ subsequent earnings is a subject of long-standing interest in labor economics. For a well-paid worker, losing a job can trigger a fall down the “job ladder” into a lower-paying position, firm, or industry. But what is the experience of low-wage workers, who are already on the bottom rungs of the ladder and have less room to fall?
In How Replaceable Is a Low-Wage Job? (NBER Working Paper 31447), Evan Rose and Yotam Shem-Tov study this question by tracking workers who earned less than $15 an hour in 2020 dollars between 2001 and 2014. They compare workers who leave their jobs because their firm experienced a large employment contraction to workers in comparable firms that did not experience a contraction. Focusing on company-wide layoffs is a standard strategy in the study of job displacement since it isolates job separations due to layoffs and reduces the chances that the workers who lose their jobs are different from those who keep their jobs in some unobserved way that matters for future earnings.
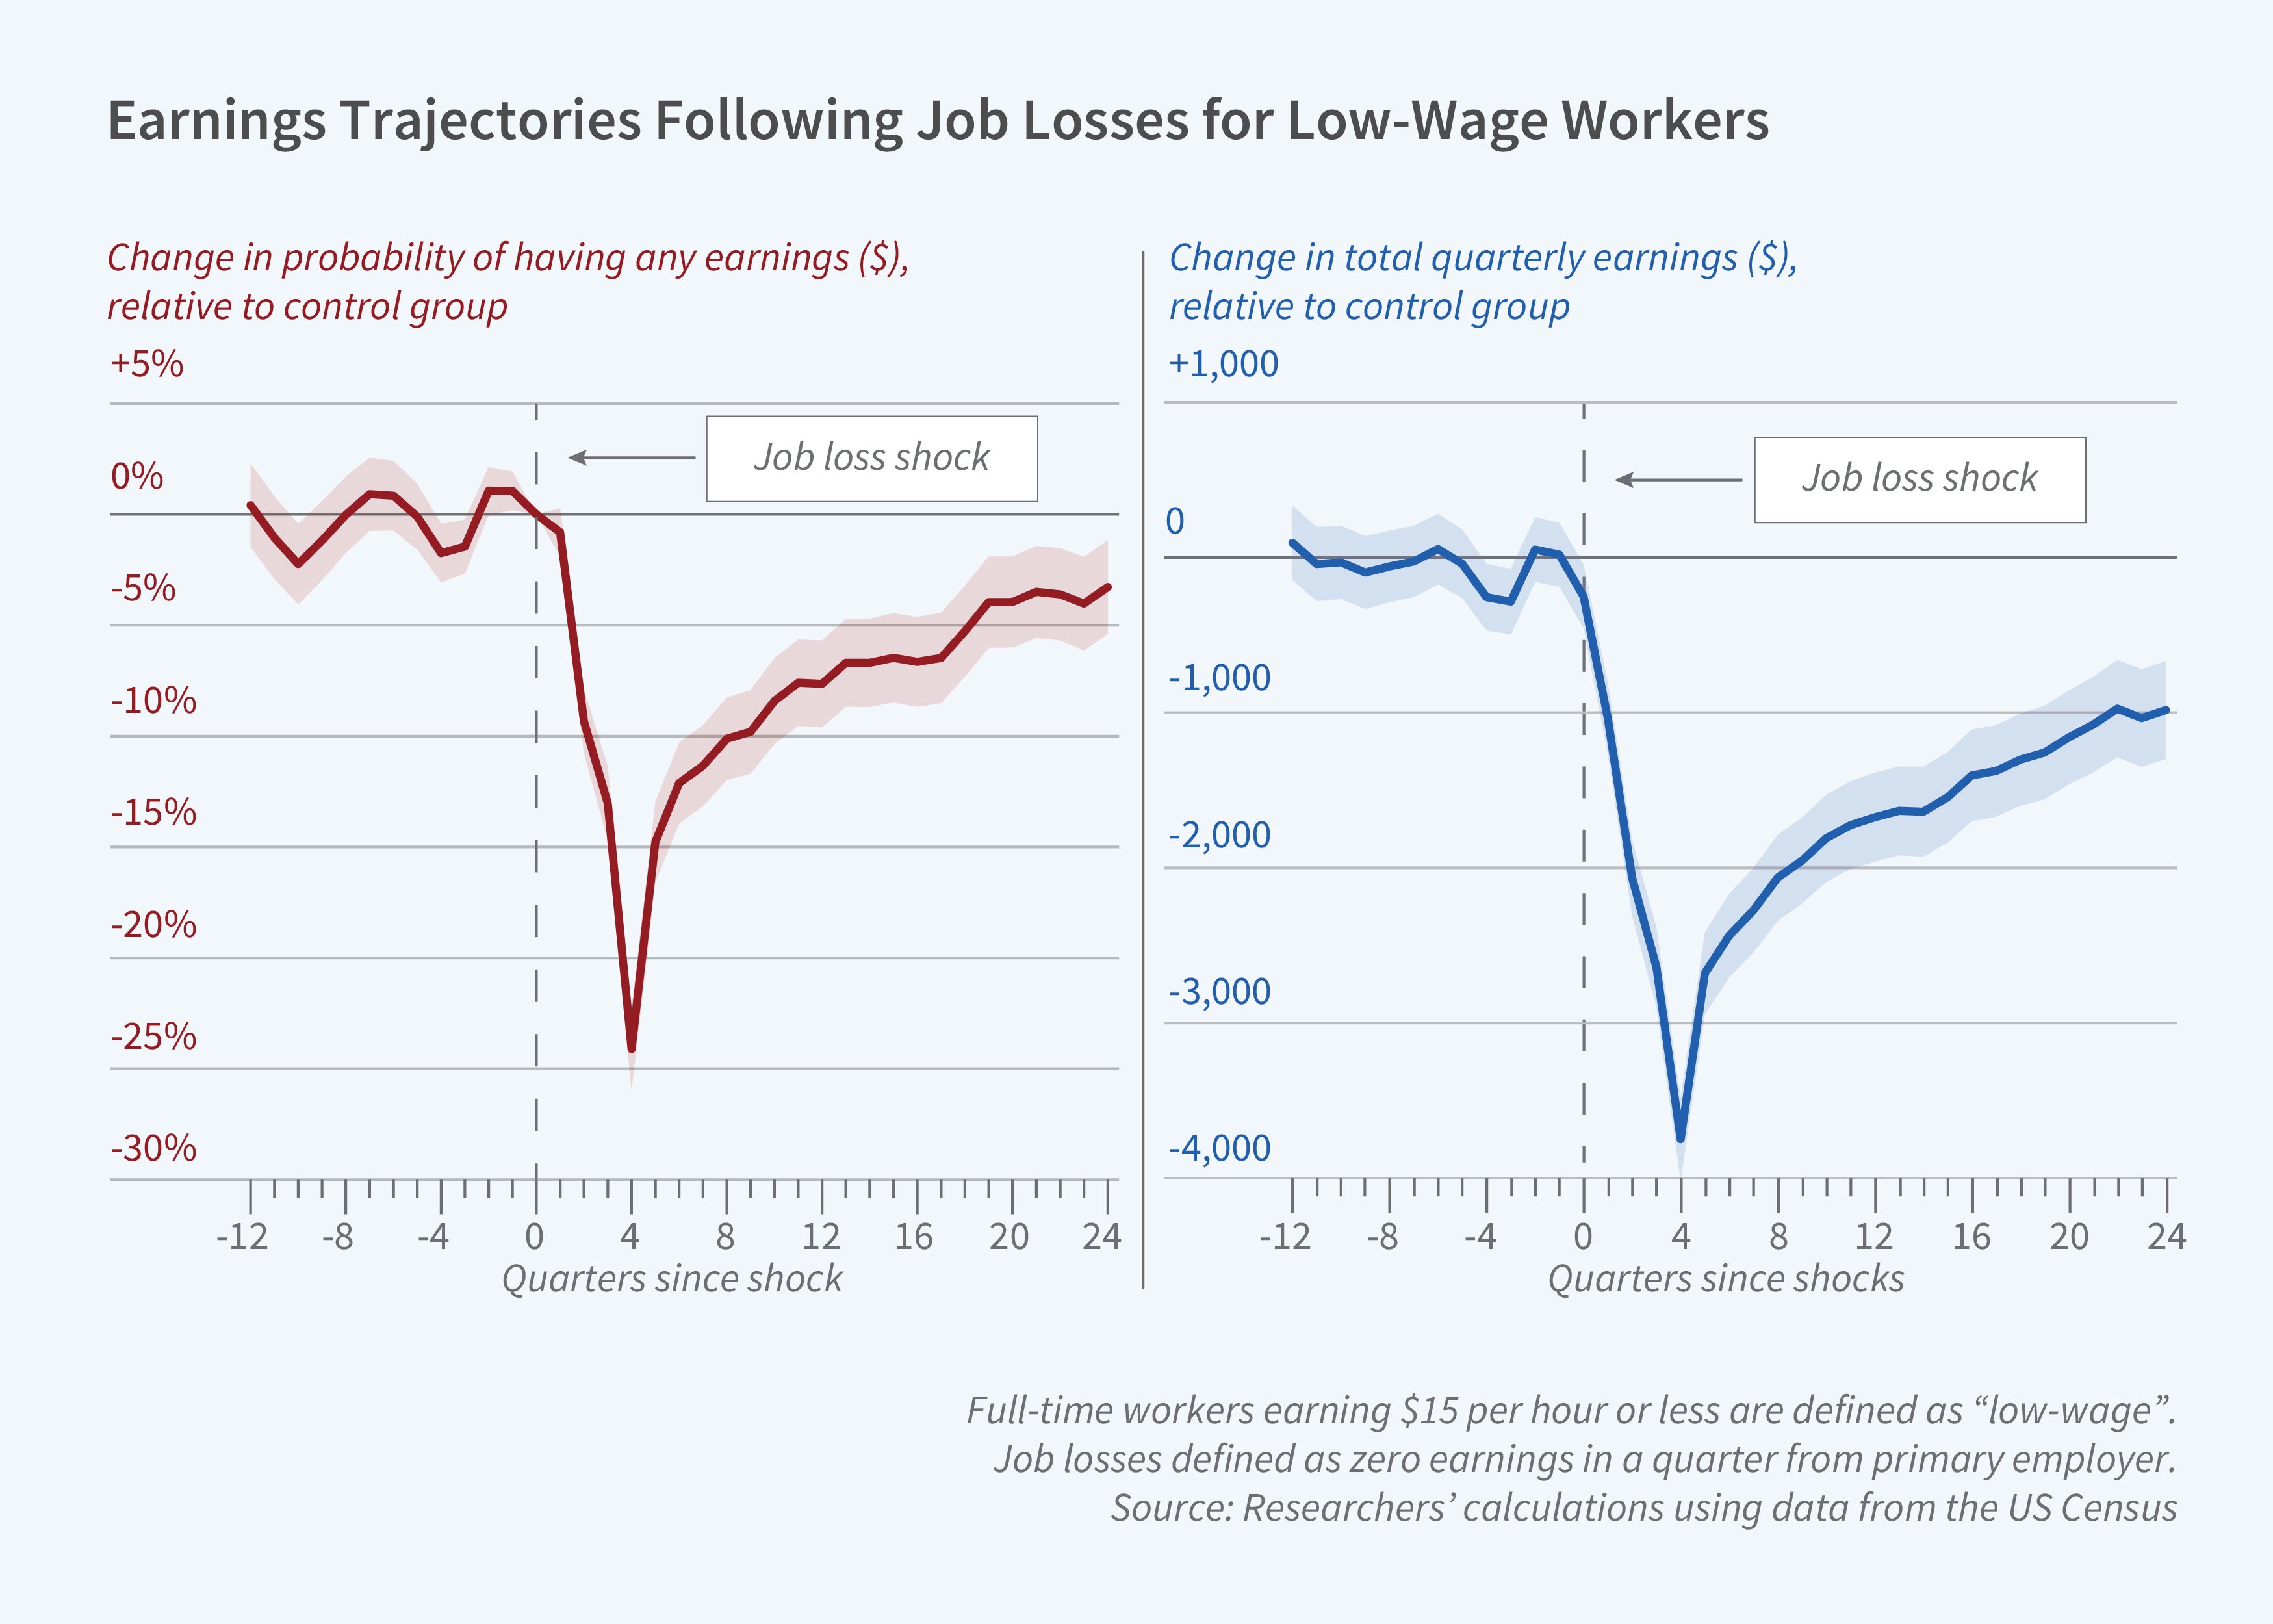
Six years after a low-wage worker loses a job, on average that worker’s earnings are significantly lower than the earnings of a comparable worker without a job loss.
Workers who lose a low-wage job suffer from persistent earnings declines. After six years, their quarterly earnings average was 13 percent lower than that of the comparison group. Very little of this loss in earnings comes from reductions in hourly wages since these workers were at the bottom of the wage distribution prior to their job loss. Instead, about half of the long-run loss arises because displaced workers are more likely to be without a job for long stretches of time. Four to six years out, unemployment rates among displaced workers are 3.2 percentage points higher, and rates of labor force nonparticipation are 2.6 percentage points higher, than in the comparison group. The other half of the long-run earnings loss comes from a decline in the number of weeks worked per year — down by about 3.2 — and in hours worked per week — down by about 3.
When the researchers apply a similar empirical strategy to an alternative sample of workers earning $15 to $30, they find long-run earnings losses of 17 percent. As in prior studies, the earnings losses for these workers come predominantly from drops in hourly wages rather than reductions in employment rates or weekly hours. Job loss therefore seems to have large effects on workers across the wage distribution, but the sources of low-wage workers’ losses are different. Their difficulty seems to be climbing back onto the job ladder at all, rather than falling down to a lower rung where jobs pay less per hour.
— Shakked Noy


