Mergers in Consumer Packaged Goods and Consumer Prices
Mergers can increase prices if the merging parties gain market power due to the deal. They can decrease prices if the union induces cost savings that the firms pass through to consumers. The regulatory agencies that review mergers must determine which scenario is more likely.
In Merger Effects and Antitrust Enforcement: Evidence from US Retail (NBER Working Paper 31123), Vivek Bhattacharya, Gastón Illanes, and David Stillerman study the results of 50 mergers. The deals examined were valued at $280 million or more and involved producers of consumer packaged goods sold at grocery stores and mass merchandisers. These producers sell many products; these mergers impacted 126 product markets.
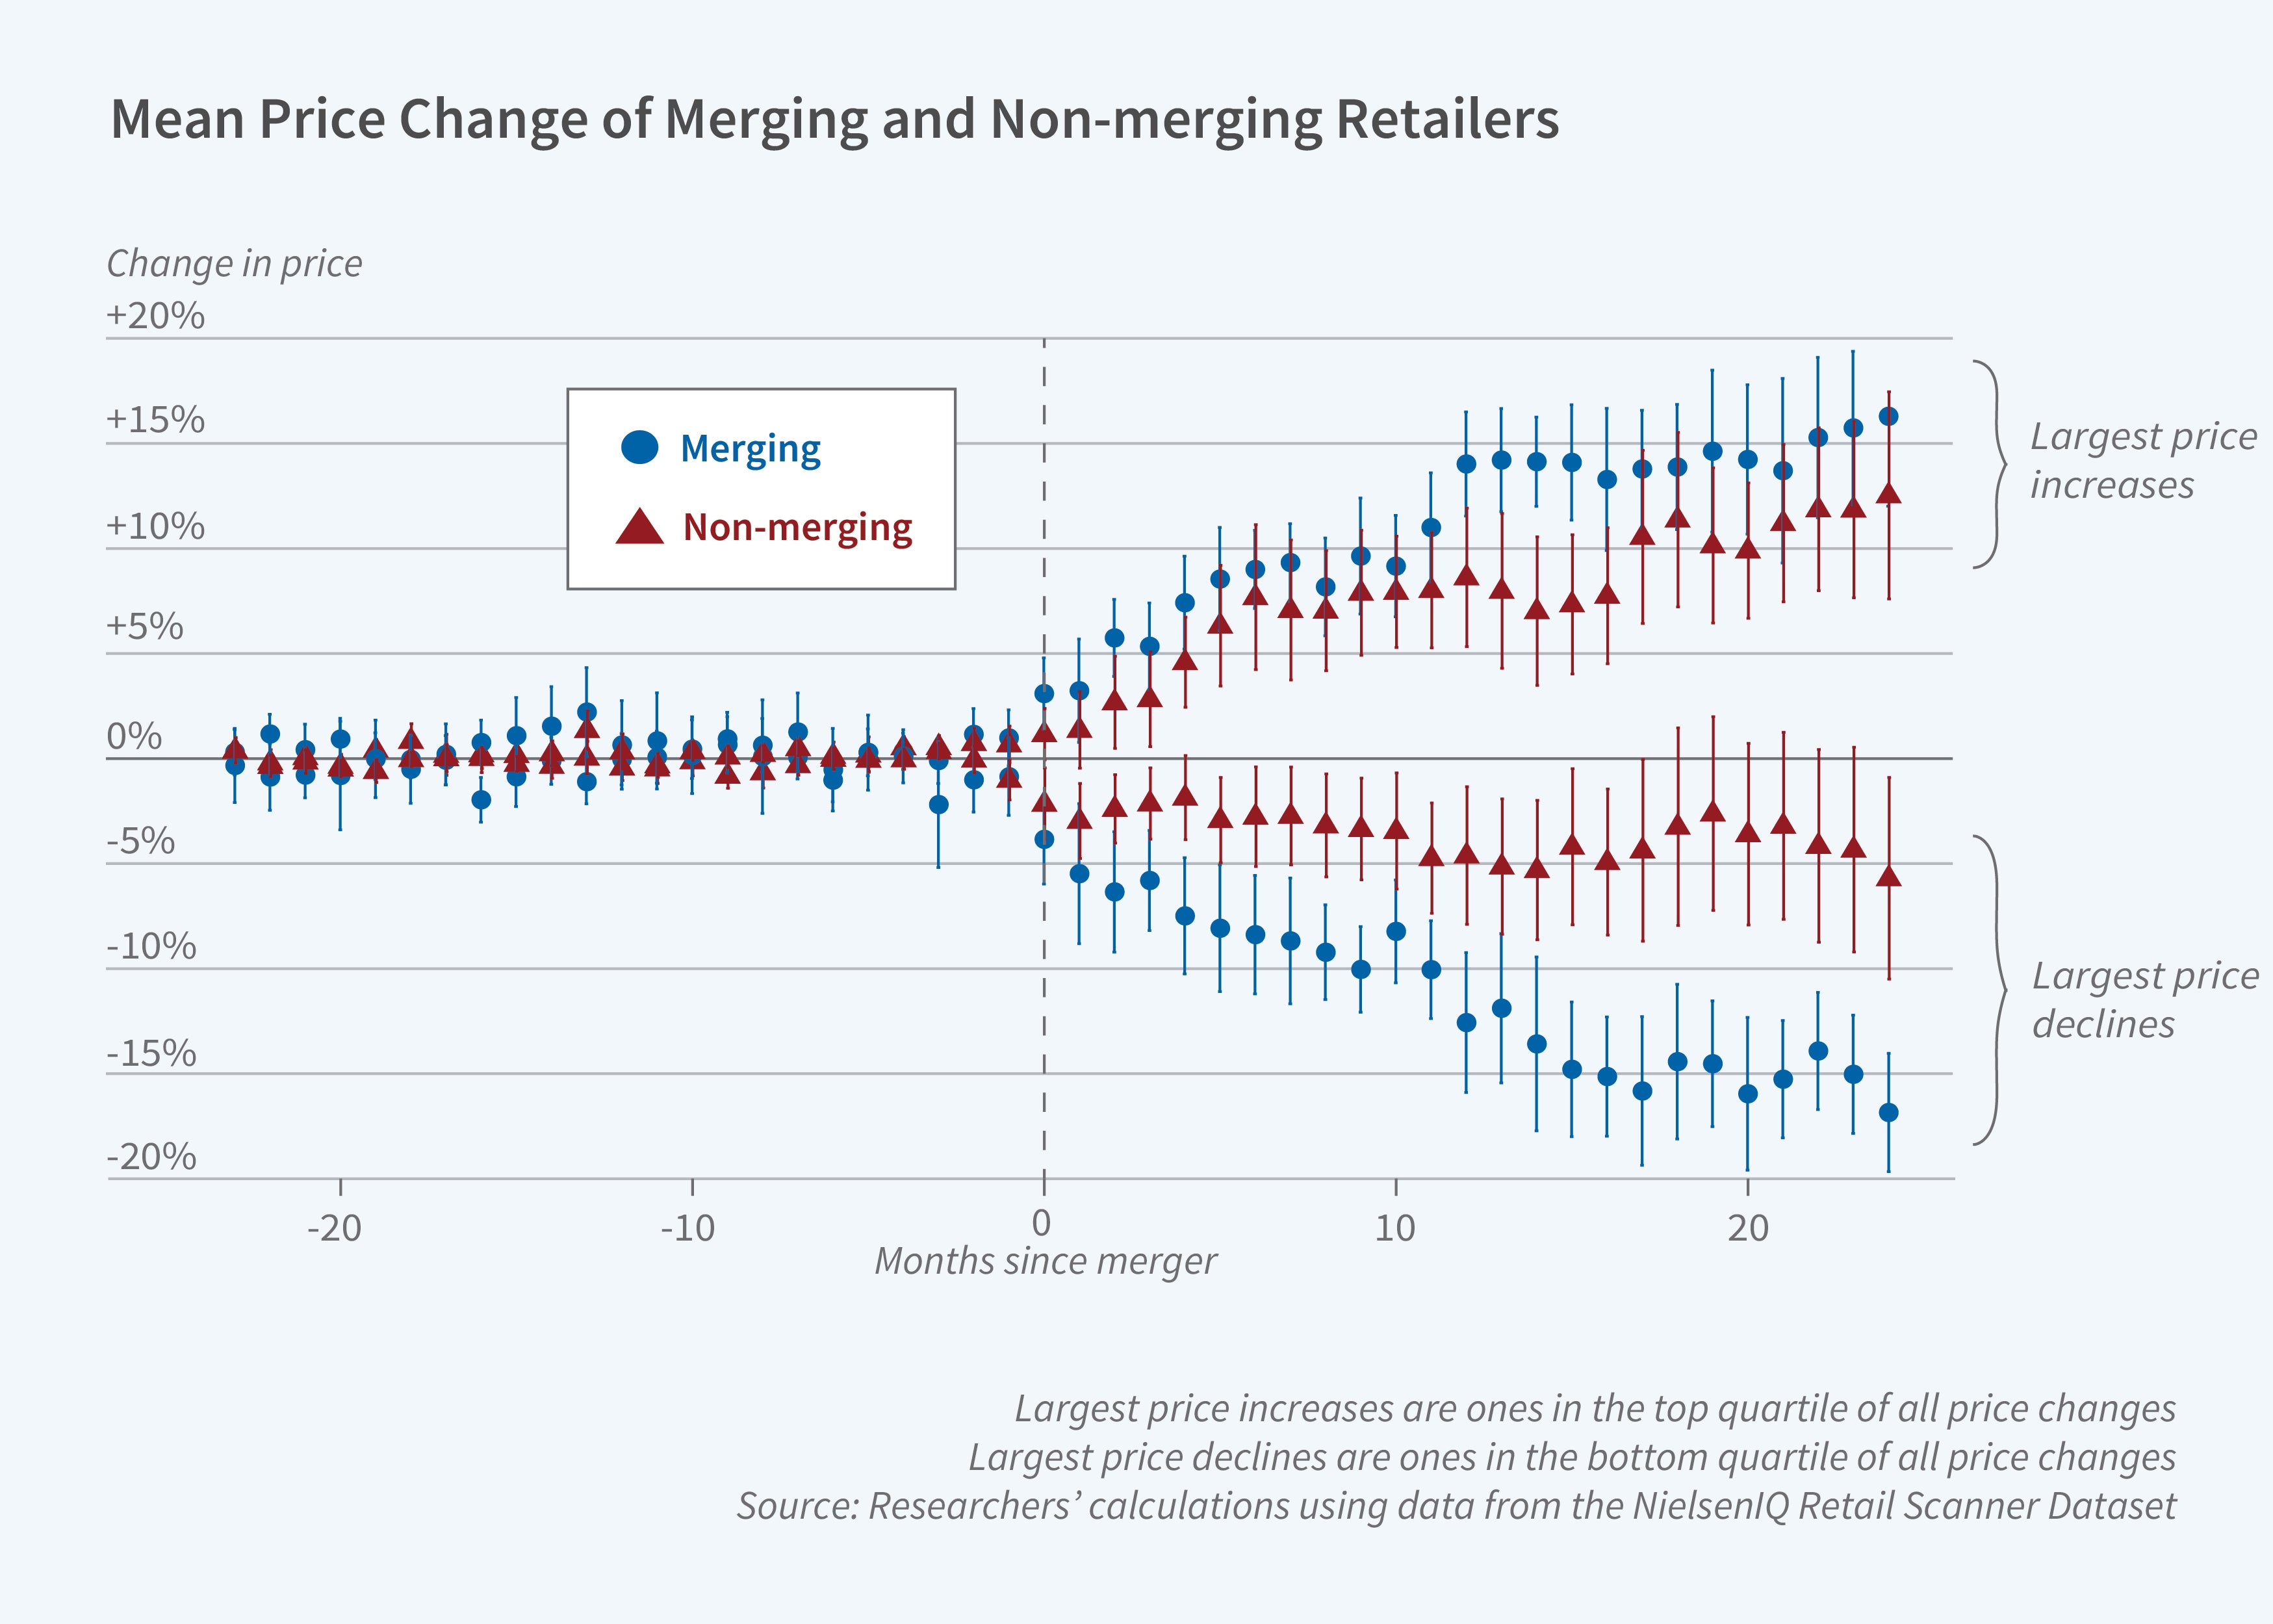
Consumer packaged goods producer mergers led to disparate price changes. One-quarter resulted in price drops of 2.3 percent or more, while another quarter led to increases of at least 5.3 percent.
The researchers study the effect of mergers on the sale prices and quantities sold of individual products in the two years before and after completed mergers, both for the merging parties and for competitors. They rely on data from the NielsenIQ Retail Scanner Dataset.
After a merger, the average price of a product sold by the merging parties decreased by 0.1 percent. Over the same period, prices for products sold by nonmerging firms rose by 2.1 percent. These averages mask substantial differences across mergers, consistent with the notion that some deals lead to stronger exertion of market power while others lead to cost synergies. In 25 percent of the analyzed mergers, prices fell by at least 2.3 percent. Another 25 percent led to price increases of 5.3 percent or more.
Aggregate quantities decreased by 2.3 percent on average after a merger, again with substantial variation: the first quartile saw a drop of 6.9 percent, compared with an increase of 3.1 percent for the third quartile. Significant quantity declines following a merger correlate with narrower distribution networks and with reductions in product portfolios.
The researchers apply their findings to estimate the decision rule that agencies used in deciding whether to challenge proposed mergers. They find that during their study period, 2006 to 2017, US antitrust agencies challenged mergers with an expected sales-weighted average price increase of more than 8.6 percent. Reducing the challenge threshold to 5 percent would have blocked few procompetitive mergers while reducing the probability of approval for anticompetitive mergers. However, it would have tripled the number of proposed mergers that the agencies would have had to challenge.
—Linda Gorman
This project was funded by grants from the Center for Equitable Growth and the National Science Foundation (SES-2116934).


