Constructing Firm-Level Measures of Environmental Impact
While investor attention often focuses on carbon emissions, local pollutants are also important components of many firms’ environmental damages.
Environmental, social, and governance (ESG) concerns have become increasingly important drivers of investor behavior, and a range of indices seek to guide this investment by tracking firms’ performance on each dimension of sustainability. Measures of firms’ carbon emissions are often cited in this context. In Measuring Firm Environmental Performance to Inform Asset Management and Standardized Disclosure (NBER Working Paper 29454), Nicholas Z. Muller finds that metrics that incorporate firms’ emissions of local pollutants as well as of carbon dioxide (CO2) provide a more accurate assessment of environmental impacts and also have greater predictive power for financial outcomes.
Muller defines an index of environmental performance based on firms’ total pollution damages across eight pollutants: three greenhouse gases — CO2, methane, and nitrous oxide — and five local air pollutants — fine particulate matter, sulfur dioxide, nitrogen oxides, volatile organic compounds, and ammonia. Local pollutants are dwarfed in volume by carbon emissions, but their high per-ton health risks make them important components of many firms’ environmental damages.
He then estimates this index for US utilities using facility-level emissions data collected by the Environmental Protection Agency in 2014 and 2017. To calculate firms’ total pollution damages, he first calculates each pollutant’s impacts on health and well-being in dollar terms. For greenhouse gases, these damages equal the social cost of carbon multiplied by firms’ carbon emissions. For local air pollutants, emissions damages are estimated using an integrated assessment model that translates emissions data into county-level pollution concentrations, converts these concentrations into excess mortality using epidemiological dose-response functions, and then values excess deaths using estimates of the willingness to pay for mortality risk reductions.
Finally, Muller converts firm-specific pollution damages into an index of relative pollution intensity by dividing each utility’s share of the industry’s total pollution damages by its share of the industry’s total market capitalization. In 2014, this metric ranged from 0.06 for American Water Works — its share of industry pollution damages was less than one-tenth of its share of industry market capitalization — to 5.81 for NRG Energy, a firm with a pollution damage share roughly six times greater than its market value share.
The eight-pollutant index reveals trends in utilities’ aggregate environmental impacts that a focus on greenhouse gases alone would not capture. Muller calculates that total pollution damages from utilities fell by about 20 percent annually between 2014 and 2017, almost entirely driven by falling damages from local pollutants. Carbon emissions remained flat over this period.
In addition to providing a more comprehensive picture of firms’ environmental damages, the eight-pollutant score is also more predictive of firms’ financial outcomes during the 2014–17 period than the carbon-only measure.
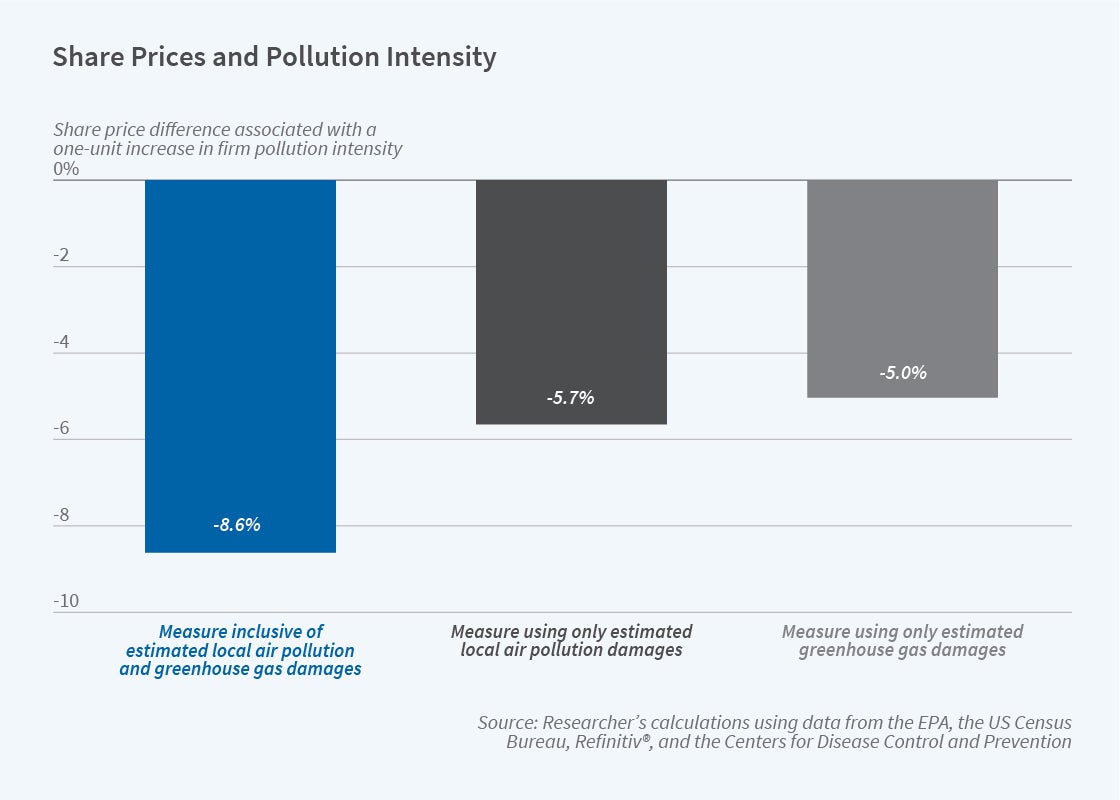
Muller finds that between 2014 and 2017, firms that became more pollution intensive experienced share price declines. A one-unit increase in the eight-pollutant index value is associated with an 8.6 percent decrease in share price. By comparison, when studied in isolation, a one-unit increase in the carbon emission index was associated with a 5.0 percent decline. Focusing only on the latter would therefore underestimate the impact of firm-level environmental damages on prices.
The eight-pollutant score is also a better predictor of other investment outcomes. For example, firms with increasing pollution intensity between 2014 and 2017 saw larger one-year gains in earnings per share (EPS), and they also saw higher earnings surprises — the gaps between analysts’ earnings forecasts and actual earnings. The eight-pollutant performance metric again predicts future EPS and EPS surprises better than would an index based only on greenhouse gas emissions.
These stronger financial correlations suggest that a multipollutant index of environmental performance incorporates information that a measure focused only on greenhouse gas emissions may omit.
— Lucy E. Page


