Improving Understanding of the Retirement Earnings Test

The decisions that prospective retirees make about when to stop working and when to claim Social Security benefits can have profound impacts on their financial well-being in retirement. Yet many older workers have an incomplete understanding of relevant Social Security policies, including the Retirement Earnings Test (RET).
Under the RET, retirees who claim before the Full Retirement Age (FRA) and have earnings above a specified (relatively low) threshold receive reduced benefits before the FRA and increased benefits after the FRA. Past survey evidence suggests that fewer than half of prospective retirees realize that working after claiming benefits can reduce benefits prior to the FRA, and only around one-third of those who do also realize that benefits increase after the FRA to account for the temporary decrease in benefits; to many others, the RET appears to be a tax. Prior attempts to enhance understanding of the RET have generally not been successful.
In Communicating the Implications of How Long to Work and When to Claim Social Security Benefits (NBER RDRC Working Paper NB21-04), researchers Megan Weber, Stephen Spiller, Suzanne Shu, and Hal Hershfield explore how to increase understanding of the RET via visualizations. In addition to examining objective understanding of RET features, the authors also explore the ability to apply RET knowledge in scenarios as well as confidence and subjective feelings of understanding.
Several factors can create difficulties for individuals in understanding the temporal trade-off that the RET creates. Due to loss aversion, individuals may weight current income losses more heavily than future income gains. In addition, the per-period decrease in benefits prior to the FRA that results from the RET, which persists for only a few years, is typically larger than the per-period increase in benefits that comes later, which persists for a longer time. Individuals may have difficulty in understanding how an income flow translates to a cumulative total.
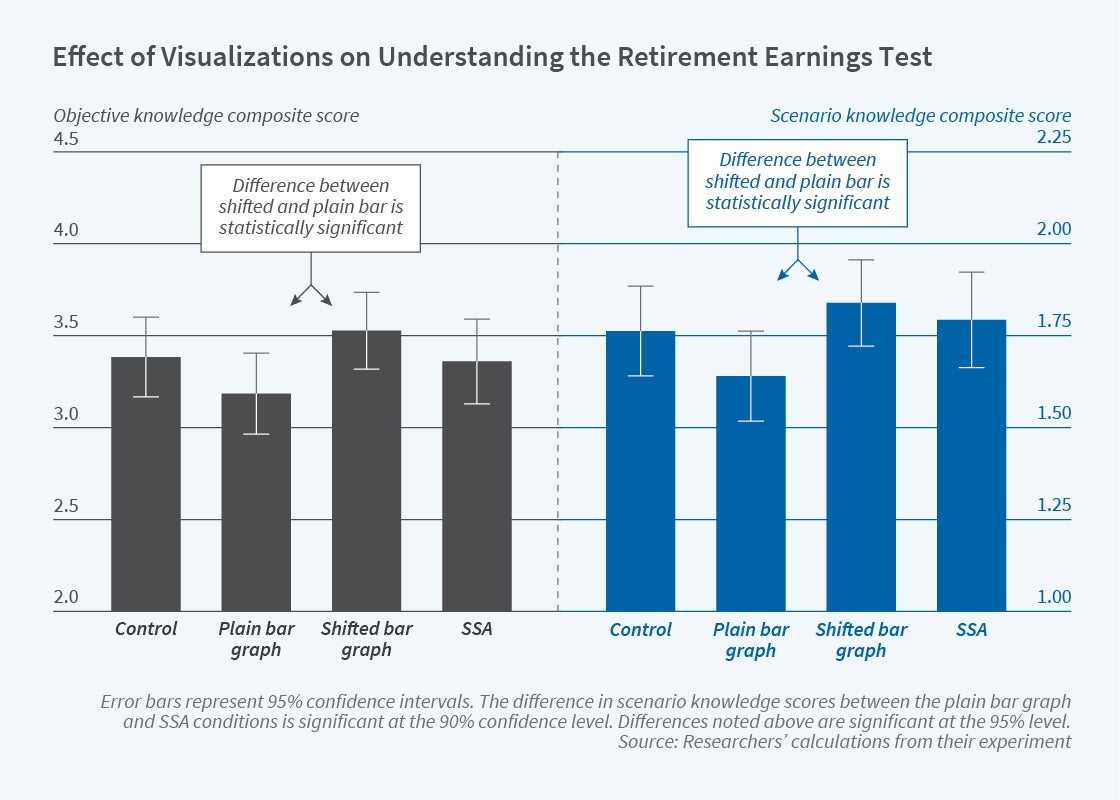
The authors recruited around 1,000 participants between 40 and 67 years of age from the Amazon Mechanical Turk platform. Participants are assigned to groups that are presented with different visual displays of information about the RET. The “plain bar graph” group is shown bar graphs with the benefit amounts for two situations: claiming while not working, or claiming while working with a specified income. The “shifted bar graph” group is shown a display that emphasizes the shift of benefits from pre-FRA to post-FRA years under the RET. The “SSA” group is shown a graph designed to mimic the visual on the Social Security Administration’s Program Explainer web page, along with text boxes next to the graph explaining key concepts. Finally, the control group receives only a written example of a hypothetical beneficiary’s benefits if she chose to claim with versus without working.
On questions that tested participants’ objective knowledge of RET features such as the ability to recoup lost benefits after the FRA, the shifted bar graph group had the highest overall score while the plain bar graph group had the lowest; the difference between the two was statistically significant. For questions that tested participants’ ability to apply their RET knowledge to hypothetical scenarios about work and claiming, both the shifted bar graph group and the SSA group had more correct answers than the plain bar graph group; these differences were also statistically significant. However, the various groups scored similarly on questions about their confidence in their understanding of the RET. Interestingly, the control group did not tend to perform worse than the experimental groups, possibly because the hypothetical example given to the control group included specific dollar amounts, which most of the other groups did not receive.
Overall, the authors find that “the visual that depicted a shift from [earlier] benefits to later benefits was the one that improved understanding and application of RET policies.” Noting that improving understanding of the RET has the potential to generate large welfare gains, the authors conclude “we hope that these tests of alternative visual presentations of the tradeoffs, informed by psychological research on how individuals understand income flows, can provide insight into how to improve RET communication.”
The research reported herein was performed pursuant to grant RDR18000003 from the US Social Security Administration (SSA) funded as part of the Retirement and Disability Research Consortium. The opinions and conclusions expressed are solely those of the author(s) and do not represent the opinions or policy of SSA, any agency of the Federal Government, or NBER. Neither the United States Government nor any agency thereof, nor any of their employees, makes any warranty, express or implied, or assumes any legal liability or responsibility for the accuracy, completeness, or usefulness of the contents of this report. Reference herein to any specific commercial product, process or service by trade name, trademark, manufacturer, or otherwise does not necessarily constitute or imply endorsement, recommendation or favoring by the United States Government or any agency thereof.


