How Inspection Timing Affects Care Quality in US Nursing Homes
Nursing homes certified by the Centers for Medicare & Medicaid Services to provide care and receive public reimbursement through Medicare and Medicaid are subject to mandatory annual inspections. While inspections are unannounced, they typically occur on an approximately yearly basis, as 74 percent of inspections take place between 40 and 60 weeks after the previous one. The average gap is around 53 weeks. Due to the cyclical nature of inspections, nursing home operators are able to anticipate when an inspection is likely and adjust their behavior accordingly. They appear to devote more effort to patient care when inspections are approaching.
In Predictably Unpredictable Inspections (NBER Working Paper 34491), Ashvin Gandhi, Andrew Olenski, and Maggie Shi study how the predictability of nursing home inspections shapes facility effort and patient outcomes. They draw on inspection records spanning 2006 to 2019 and patient outcome data from 2013 to 2019. To measure effort, the researchers construct a composite index, drawing on payroll-based staffing variables including total hours, registered nurse hours, and full-time and overtime hours, as well as care input measures such as rates of antipsychotic use and physical restraint.
Nursing homes strategically increase care quality when an inspection is imminent. Making inspections less predictable could save almost 100 lives per year.
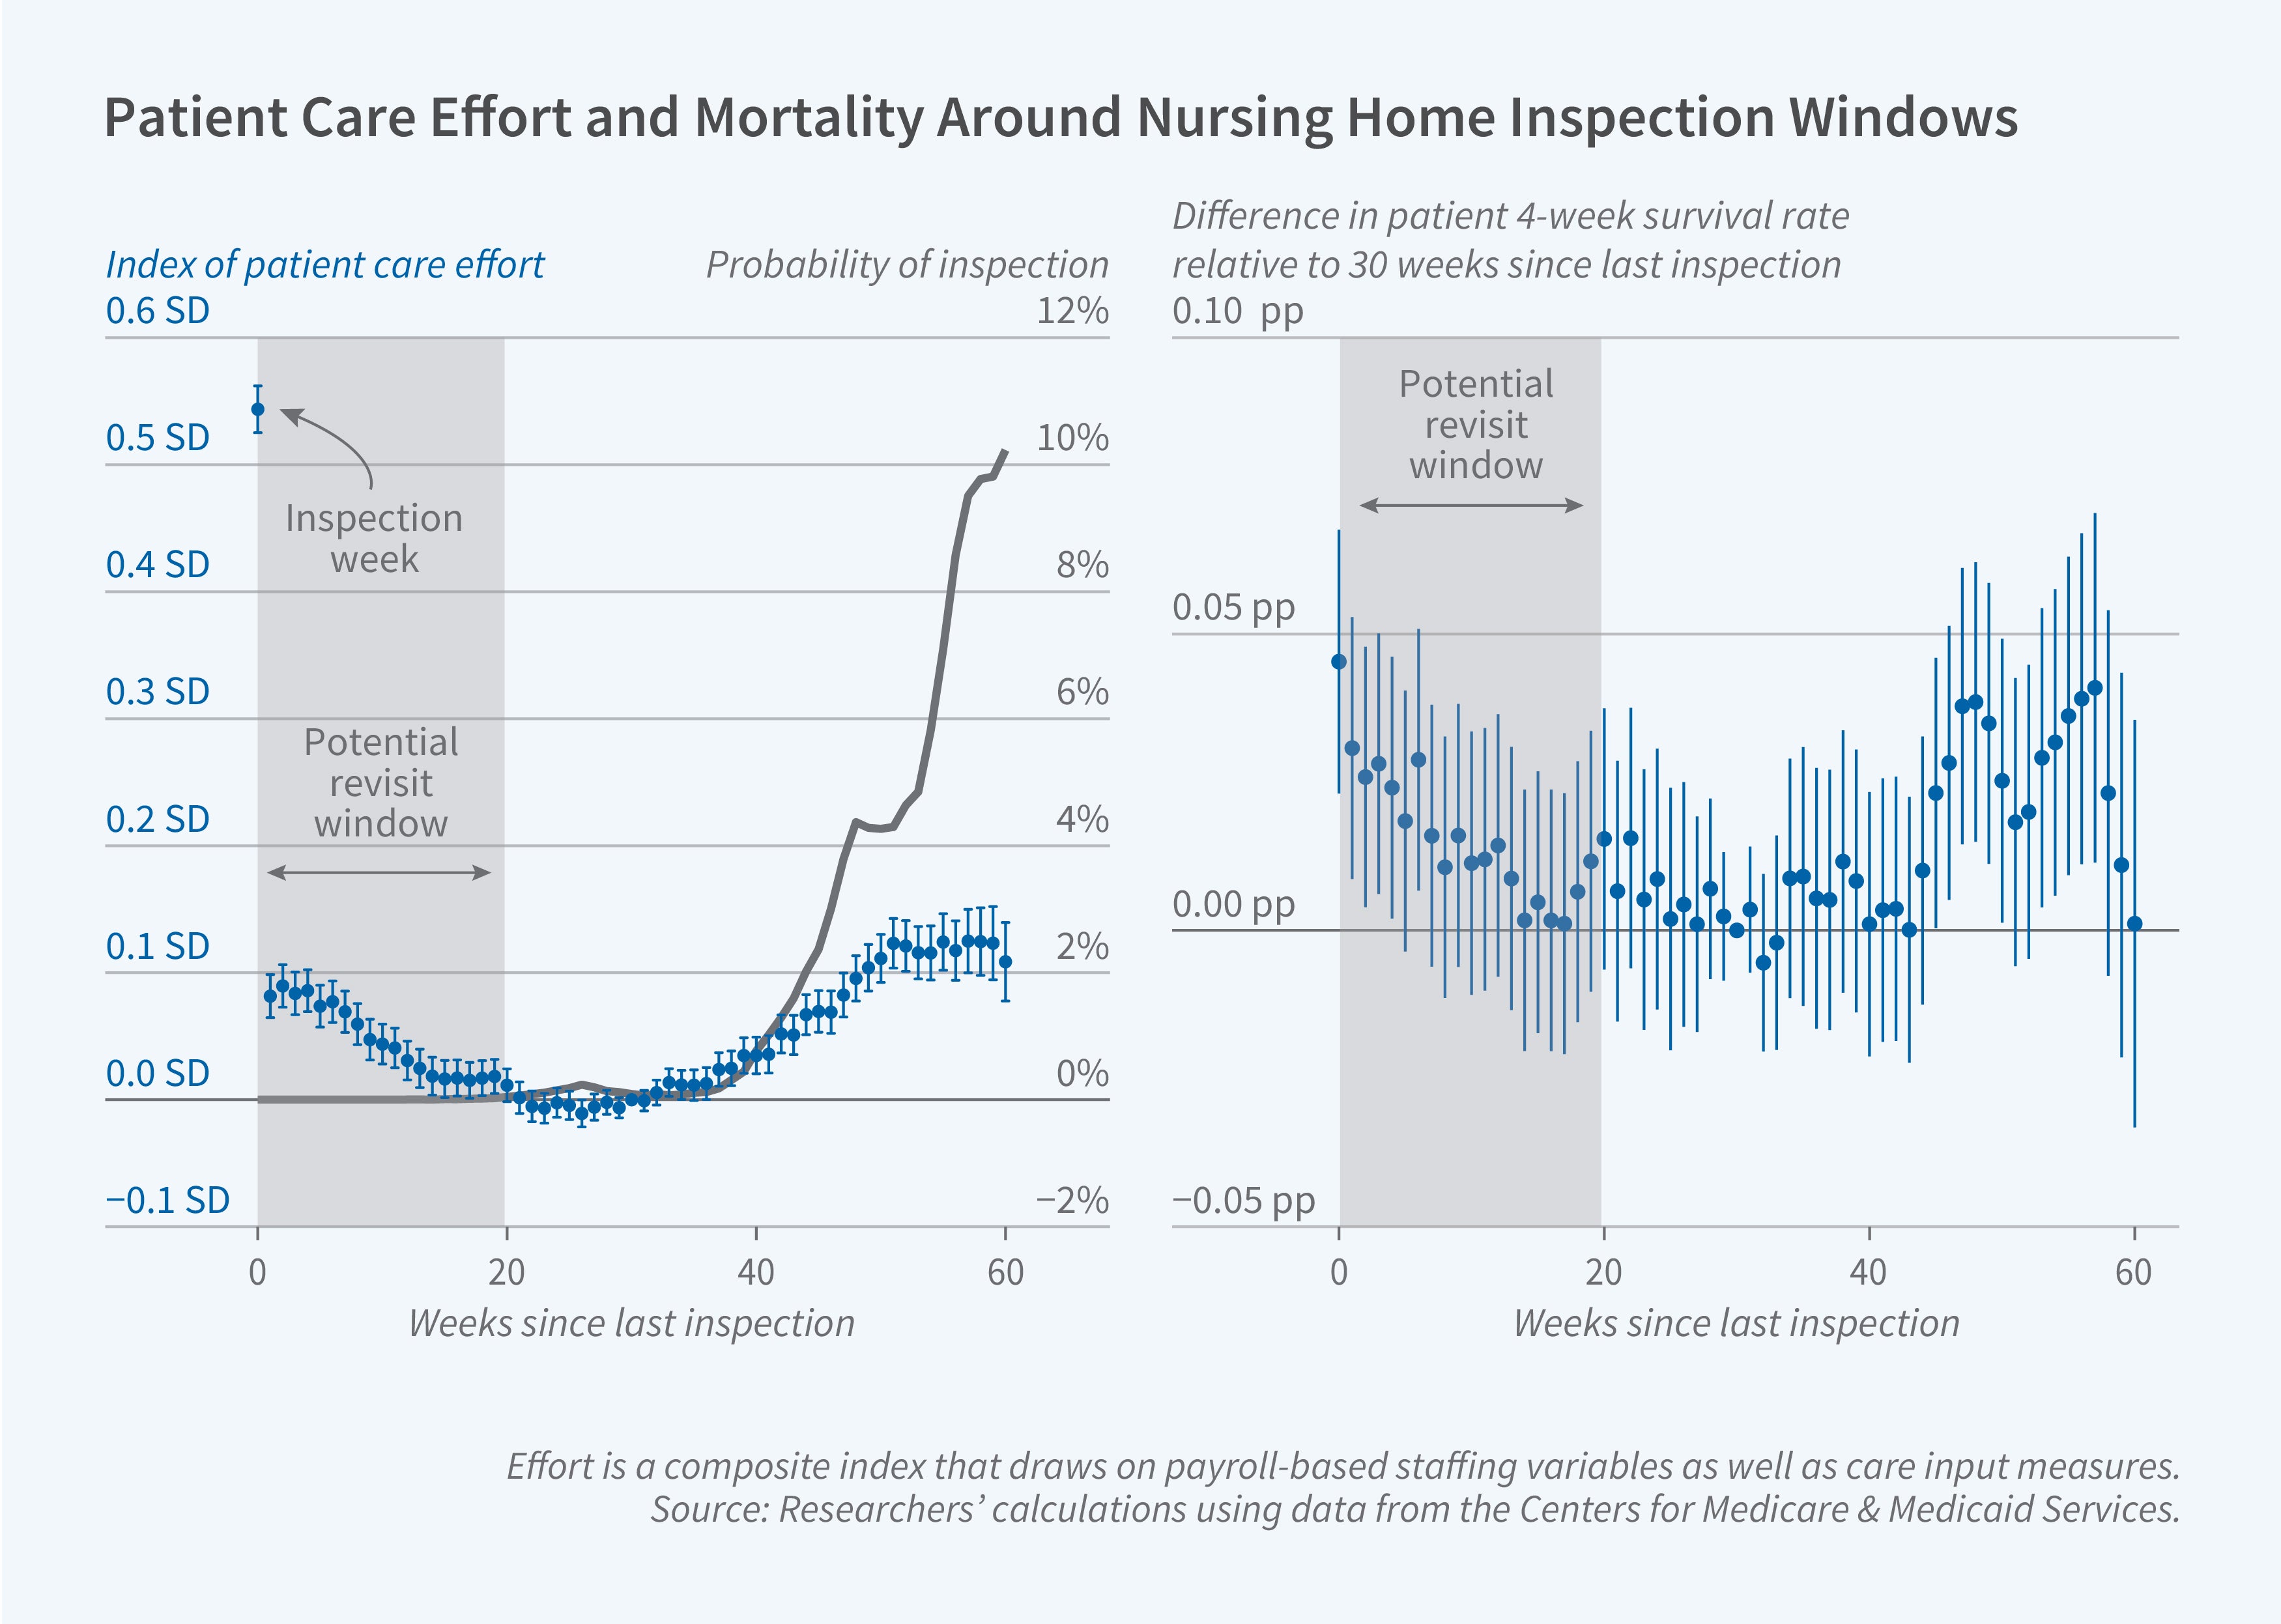
The researchers find that effort is highest during an inspection and follows a U-shaped pattern afterwards. For about 20 weeks, effort remains elevated but declining, aligning with the window during which inspectors may return to follow up on any deficiencies found during the initial inspection. Beyond 20 weeks, inspection risk is minimal, and effort flattens. However, about 40 weeks out, as the next inspection approaches, effort begins to rise again.
Four-week patient survival rates mirror this pattern: Improvements in survival correspond with periods of elevated effort. To verify that this pattern reflects changes in care rather than shifts in patient composition, the researchers examine predicted survival rates for new admissions and for discharges, and do not detect any changes.
The researchers estimate that a 1 standard deviation increase in effort is associated with a 0.2 percentage point (5.4 percent) lower patient mortality rate. Because the relationship between inspection risk and effort is concave, meaning that effort responds less to each additional increase in inspection risk, the researchers predict that smoothing inspection risk over time, rather than a pattern that vacillates between high- and low-risk periods, would be expected to motivate higher average effort and improve overall survival rates.
The researchers also find that, while inspections are highly informative about facility quality immediately after they occur, that signal decays over the following weeks. Thus, making inspections less predictable would also come at an informational cost, as less regular inspections may mean that regulators hold less up-to-date information about facility quality at any given time. However, they estimate that this information cost is fairly moderate, as the signal decays relatively slowly.
The researchers use their findings to develop a model of strategic effort provision by nursing homes, which they use to evaluate the impact of alternative inspection designs—varying the frequency and predictability of inspections—on patient outcomes and on regulator information about quality. Compared to a benchmark of no inspections at all, the researchers calculate that the current system saves 886 lives per year (57 lives per 1,000 inspections) by incentivizing higher facility effort. Under the current regime, regulators also have access to 56.3 percent of the information about facility quality that they would have under continuous monitoring, compared to 0 percent under no inspections.
In examining alternative inspection frequencies, the researchers find that lives saved increase consistently with inspection frequency. An additional 0.26 inspections per facility-year (a 25 percent increase) saves an additional 226 lives (25 percent) and increases the share of information available to regulators from 56.3 percent to 58.9 percent. However, the average benefit per 1,000 inspections declines slightly with frequency for both lives saved and information, reflecting the decreasing returns to inspecting recently inspected facilities.
The researchers also use their model to evaluate the effect of budget-neutral changes (i.e., maintaining the same number of total inspections) in the predictability of inspections. If inspections arrive with equal probability in any given week, the model suggests that facilities provide modest but constant effort throughout the year, as there is no longer any incentive to strategically time their effort. Under a perfectly predictable regime, in contrast, facilities concentrate nearly all their effort in the immediate lead-up to the scheduled inspection and exert minimal effort otherwise.
The researchers estimate that making inspections unpredictable would save about 92 more lives per year than the current system. This is equivalent to the gain from increasing inspection frequency by 10 percent. The perfectly predictable regime saves roughly 115 fewer lives per year than the current system, while providing virtually the same level of information as the current regime.
Ultimately, the researchers conclude that the degree of randomness in inspection timing and the frequency of inspection are complementary. Increasing frequency is estimated to be 9 percent more effective at saving lives when inspections are unpredictable than when they are as predictable as under the status quo.
- Leonardo Vasquez
The researchers acknowledge support from Arnold Ventures and the Becker Friedman Institute for Economics.