Do Rideshare Users Comparison Shop?
The widespread adoption of mobile web and smartphone apps was expected to dramatically reduce consumer search costs and intensify price competition, particularly in markets where comparing prices requires little more than opening a second application. The US rideshare market, dominated by Uber and Lyft, provides an opportunity for testing this prediction. In 2023, Lyft reported revenue of $13.8 billion in bookings on 709 million rides. Uber, roughly ten times larger, reported $138 billion in revenue on 9.4 billion trips.
In Leaving Money on the Dashboard: Price Dispersion and Search Frictions on Uber and Lyft (NBER Working Paper 34441), Jeffrey Fossett, Michael Luca, and Yejia Xu investigate price disparities between the two platforms and the extent to which consumers compare prices before booking rides.
Rideshare users in New York City compare prices between Uber and Lyft only 16 percent of the time, leaving money on the table.
The researchers analyzed 2,238 matched trips in New York City (NYC) during one week in February 2025, collecting price quotes from both Uber and Lyft for identical routes at identical times. They selected trips to match the temporal and geographical distribution of actual rideshare usage patterns shown in public data provided by the NYC Taxi & Limousine Commission. They measure consumer search behavior using device-level data from Comscore covering 4,016 mobile devices over a three-month period in 2023. The data indicate which rideshare applications users opened on given days.
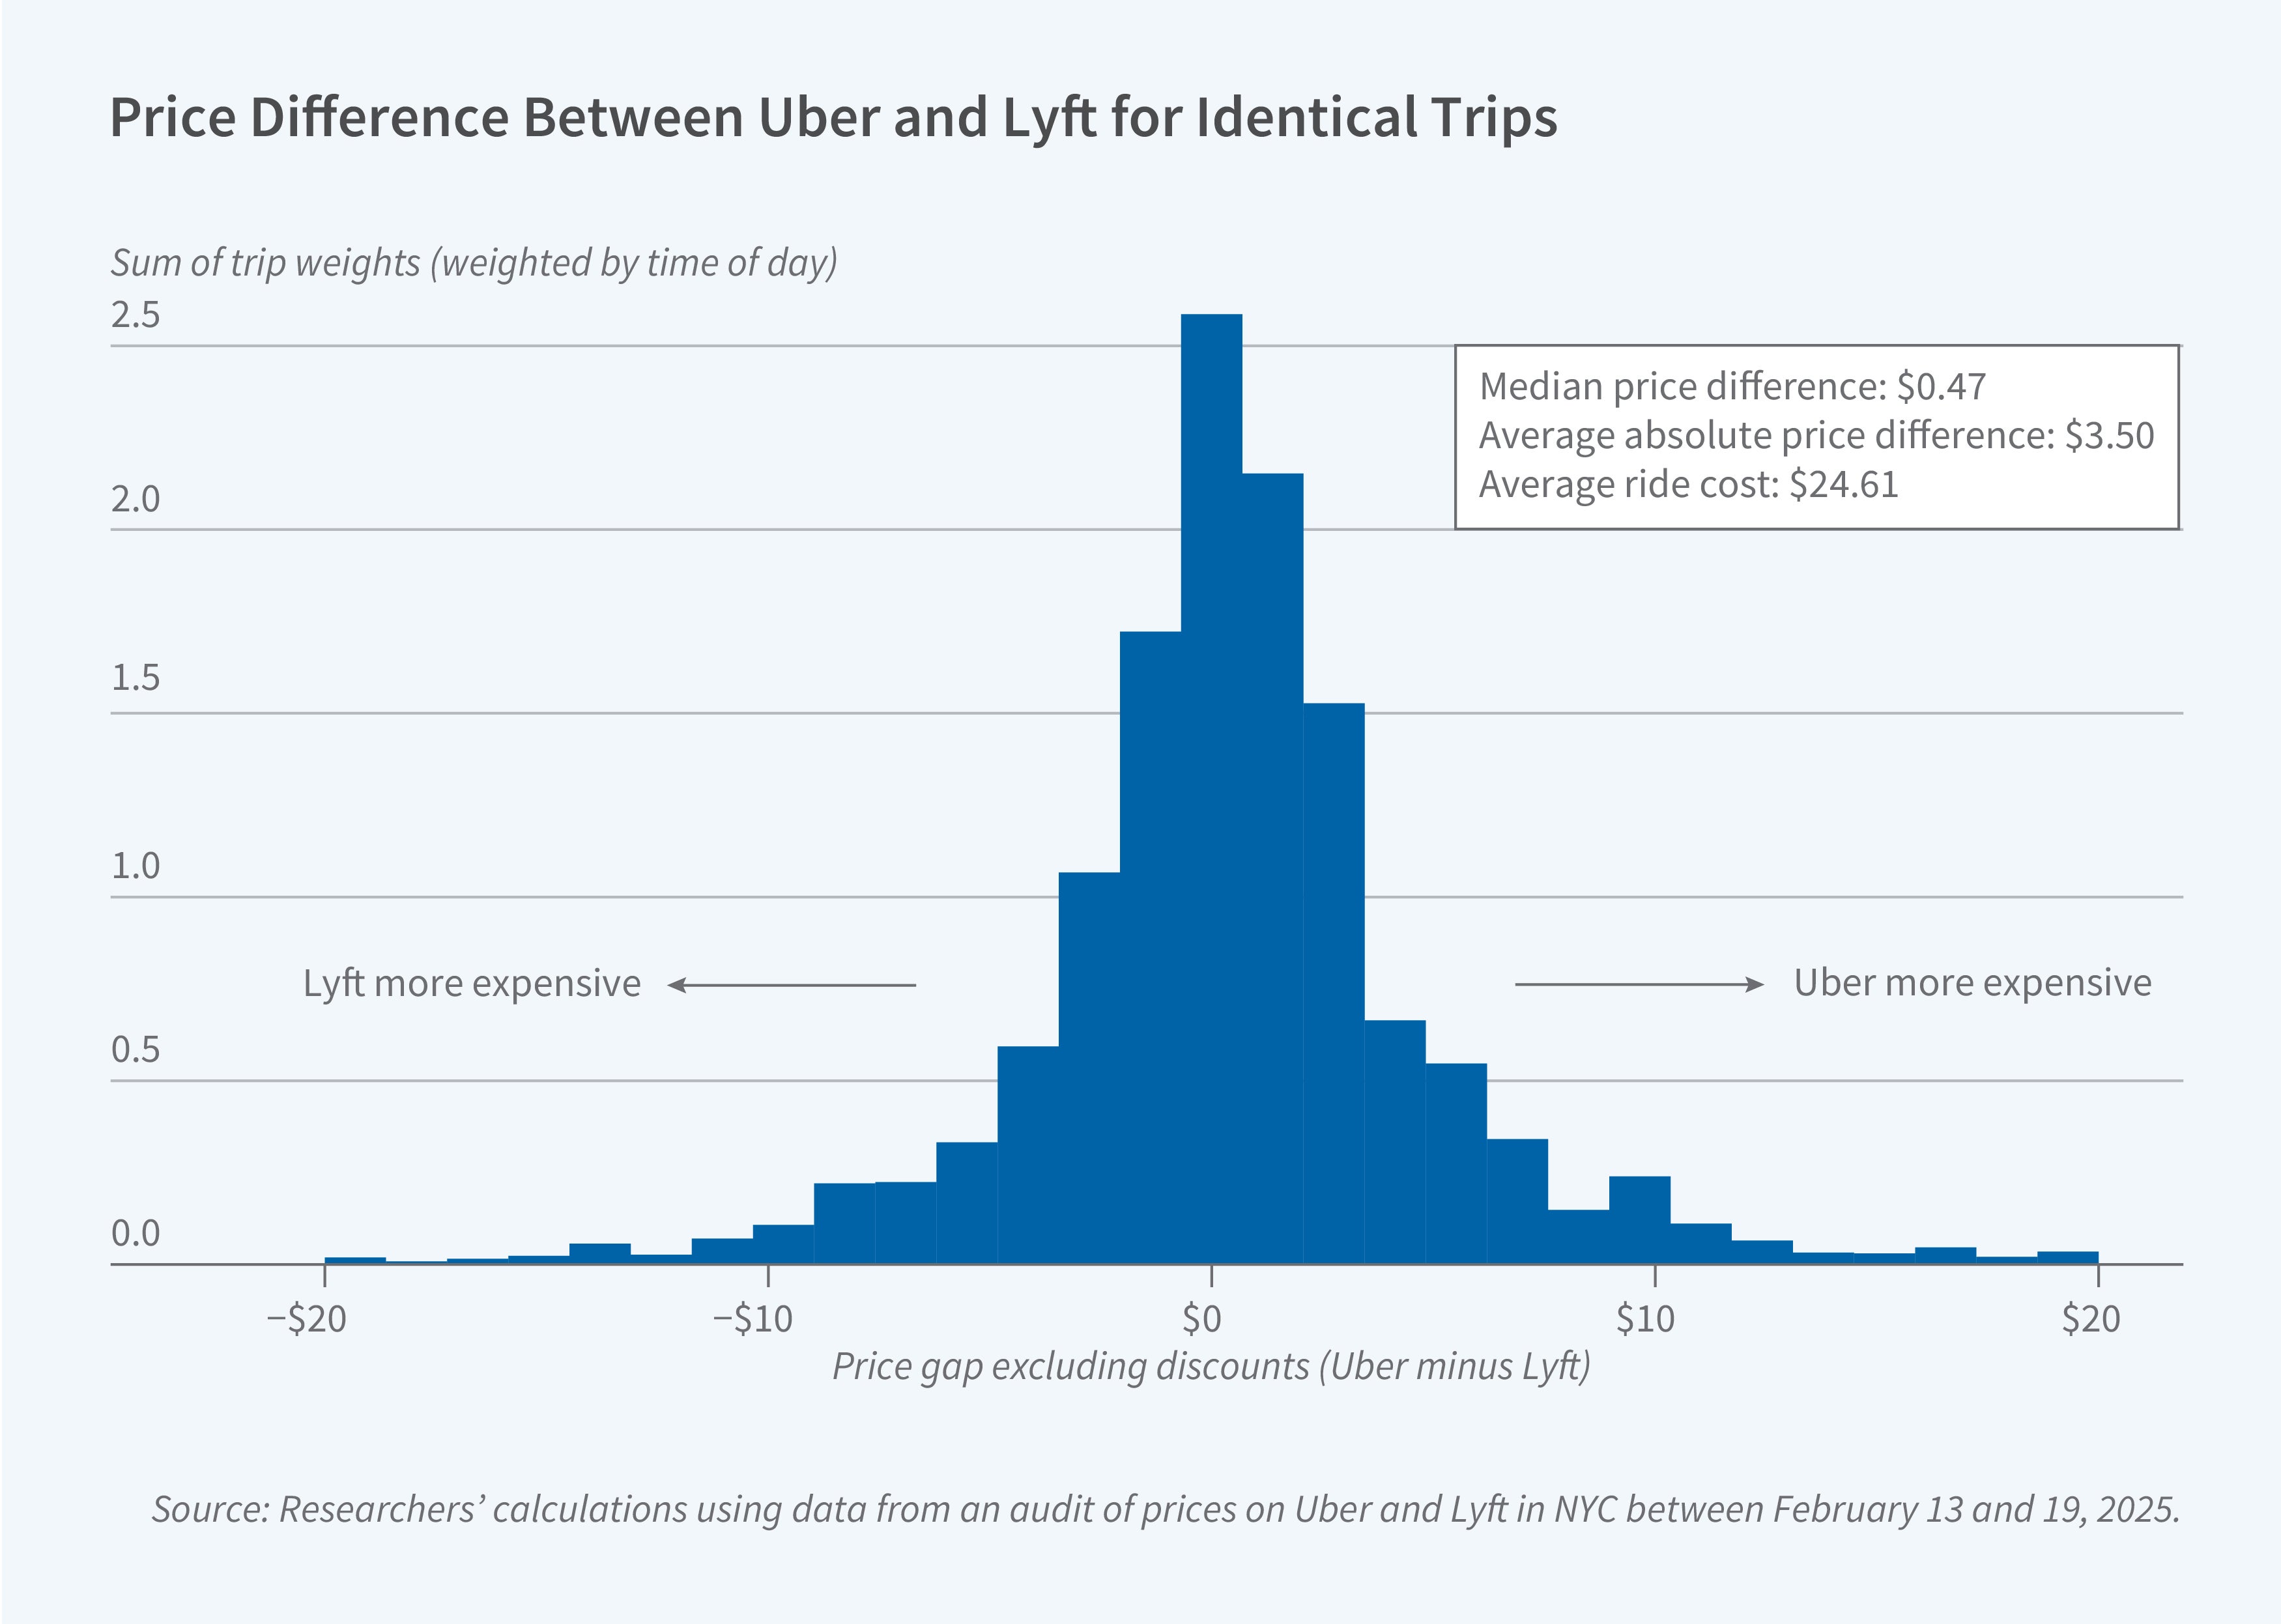
They found that the average absolute price gap between Uber and Lyft was approximately $3.50, representing roughly 14 percent of the average fare price, with higher gaps for longer rides. Price differences exceeded $1 about 75 percent of the time, and the distribution of price gaps was relatively symmetric, meaning neither platform was consistently cheaper.
Despite significant potential savings, price comparison rates were low. Among consumers who opened either the Uber or the Lyft app on a given day, only 16 percent opened the other. This pattern was consistent across demographic groups, showing no systematic variation by household income or age.
To assess whether this behavior was economically rational, the researchers calibrated a sequential search model assuming a value of time of $28.80 per hour, drawing on literature estimating the value of time, and that it took app users one minute to retrieve a price quote—a conservative estimate. The model predicted that consumers should compare prices 97 percent of the time—a rate dramatically higher than that in the data. To rationalize the observed comparison rate, consumers would need to value their time at $209.47 per hour or require 7.27 minutes to check prices, both implausibly high values. The researchers estimate that NYC riders collectively forgo approximately $300 million in potential annual savings by not comparing prices between platforms—roughly 6 percent of total gross bookings. Consumers may benefit from comparing prices more regularly. The market could also become more competitive if there were increased access to price aggregators, reducing search frictions.


