The Long Shadow of Early Life: Life Cycle Exposures and Old-Age Mortality
Period life expectancy in the United States rose from roughly 47 years in 1900 to 77 years in 2020—a gain of 30 years across 12 decades.1 Economists have worked to understand what drives these aggregate improvements and, more specifically, what explains variation in longevity across individuals and groups. Cutler, Deaton, and Lleras-Muney’s foundational survey identified education, income, and public health infrastructure as central determinants, with medical care playing a more limited and targeted role.2 Much of what drives old-age mortality—the question of why people who survive to 65 live to 75 rather than 85—remains poorly understood and often correlational. This lack of knowledge matters because the gains in life expectancy over the twentieth century were concentrated not at the end of life but near the beginning of it. The dramatic rise from 47 to 77 years reflects largely the near-elimination of infant and child mortality; age-specific mortality rates at 65 and older have improved far more modestly, and the slowdown in those gains has become a recurring concern in the demography and economics literatures. Recent cohort-mortality forecasts and related evidence document deceleration in longevity gains.3 While most efforts at examining determinants of longevity have focused on conditions in older ages, especially medical innovations and individual resources, there is growing evidence that early-life conditions may be a significant factor.
This summary describes a substantial body of work that I have carried out with Hamid Noghanibehambari of Austin Peay State University. We explore the extent to which the early-life conditions and interventions that shape childhood development and adult health and human capital play a role in who survives into old age.
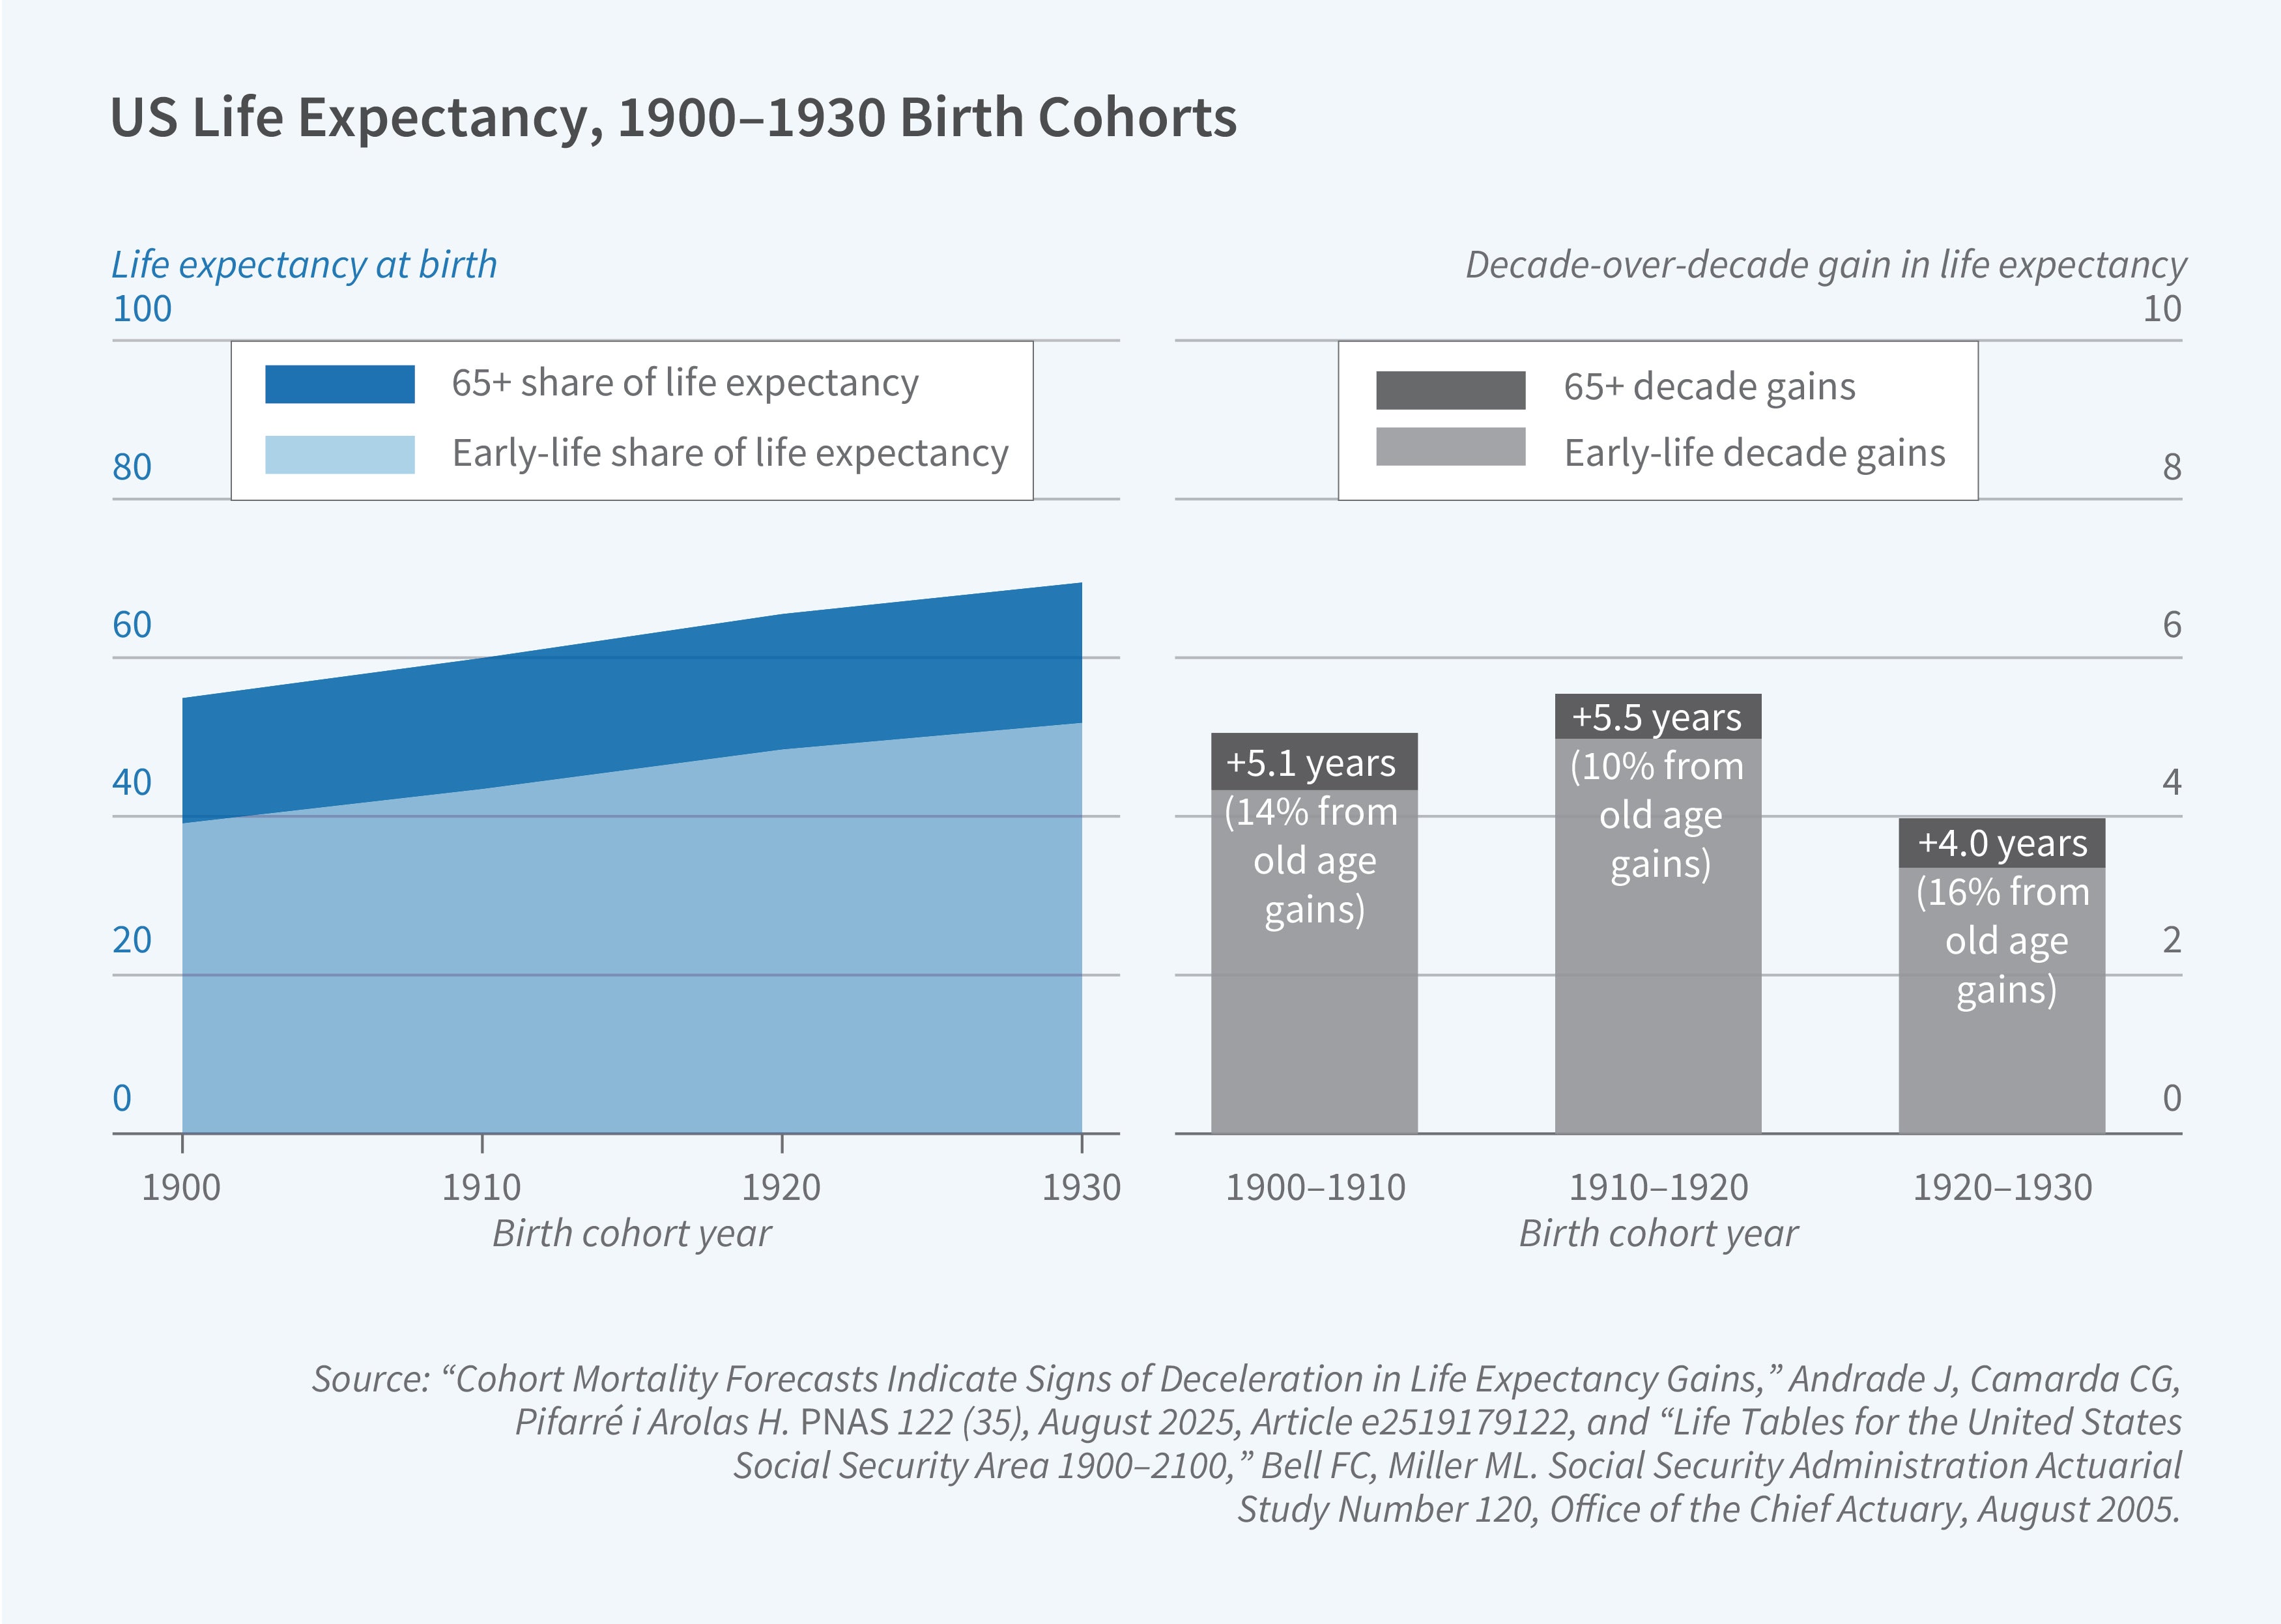
Credibility linking early-life circumstances to old-age outcomes faces major constraints: Among the most important is the length of the human lifespan itself. A researcher implementing an ideal experiment that begins in utero must wait over 80 years to answer this question directly. Instead, many researchers have focused on analyzing recent old-age mortality determinants by "looking backward" in historical time (still often 80+ years) and face many data constraints, since gold-standard measures of circumstances are not available. Here, creativity is important to overcome substantial hurdles, and much inference is indirect. The other key issues are effect sizes and the need for "big data." For context, cohort life expectancy between 1900 and 1930 increased about 15 years. However (like period life expectancy) the gains are overwhelmingly attributable to improvements at young ages: The conditional (at age 65) cohort life expectancy gains across these 30 birth cohorts were just over 2 years for men and barely 1 year for women (see Figure 1).4,5 Thus, early-life effect estimates on old-age mortality can be both consequential and likely measured in months. It is possible that most US survey infrastructure (e.g., the Health and Retirement Study) is not powered to detect these effect sizes.
Building the Evidence Base on Early-Life Effects
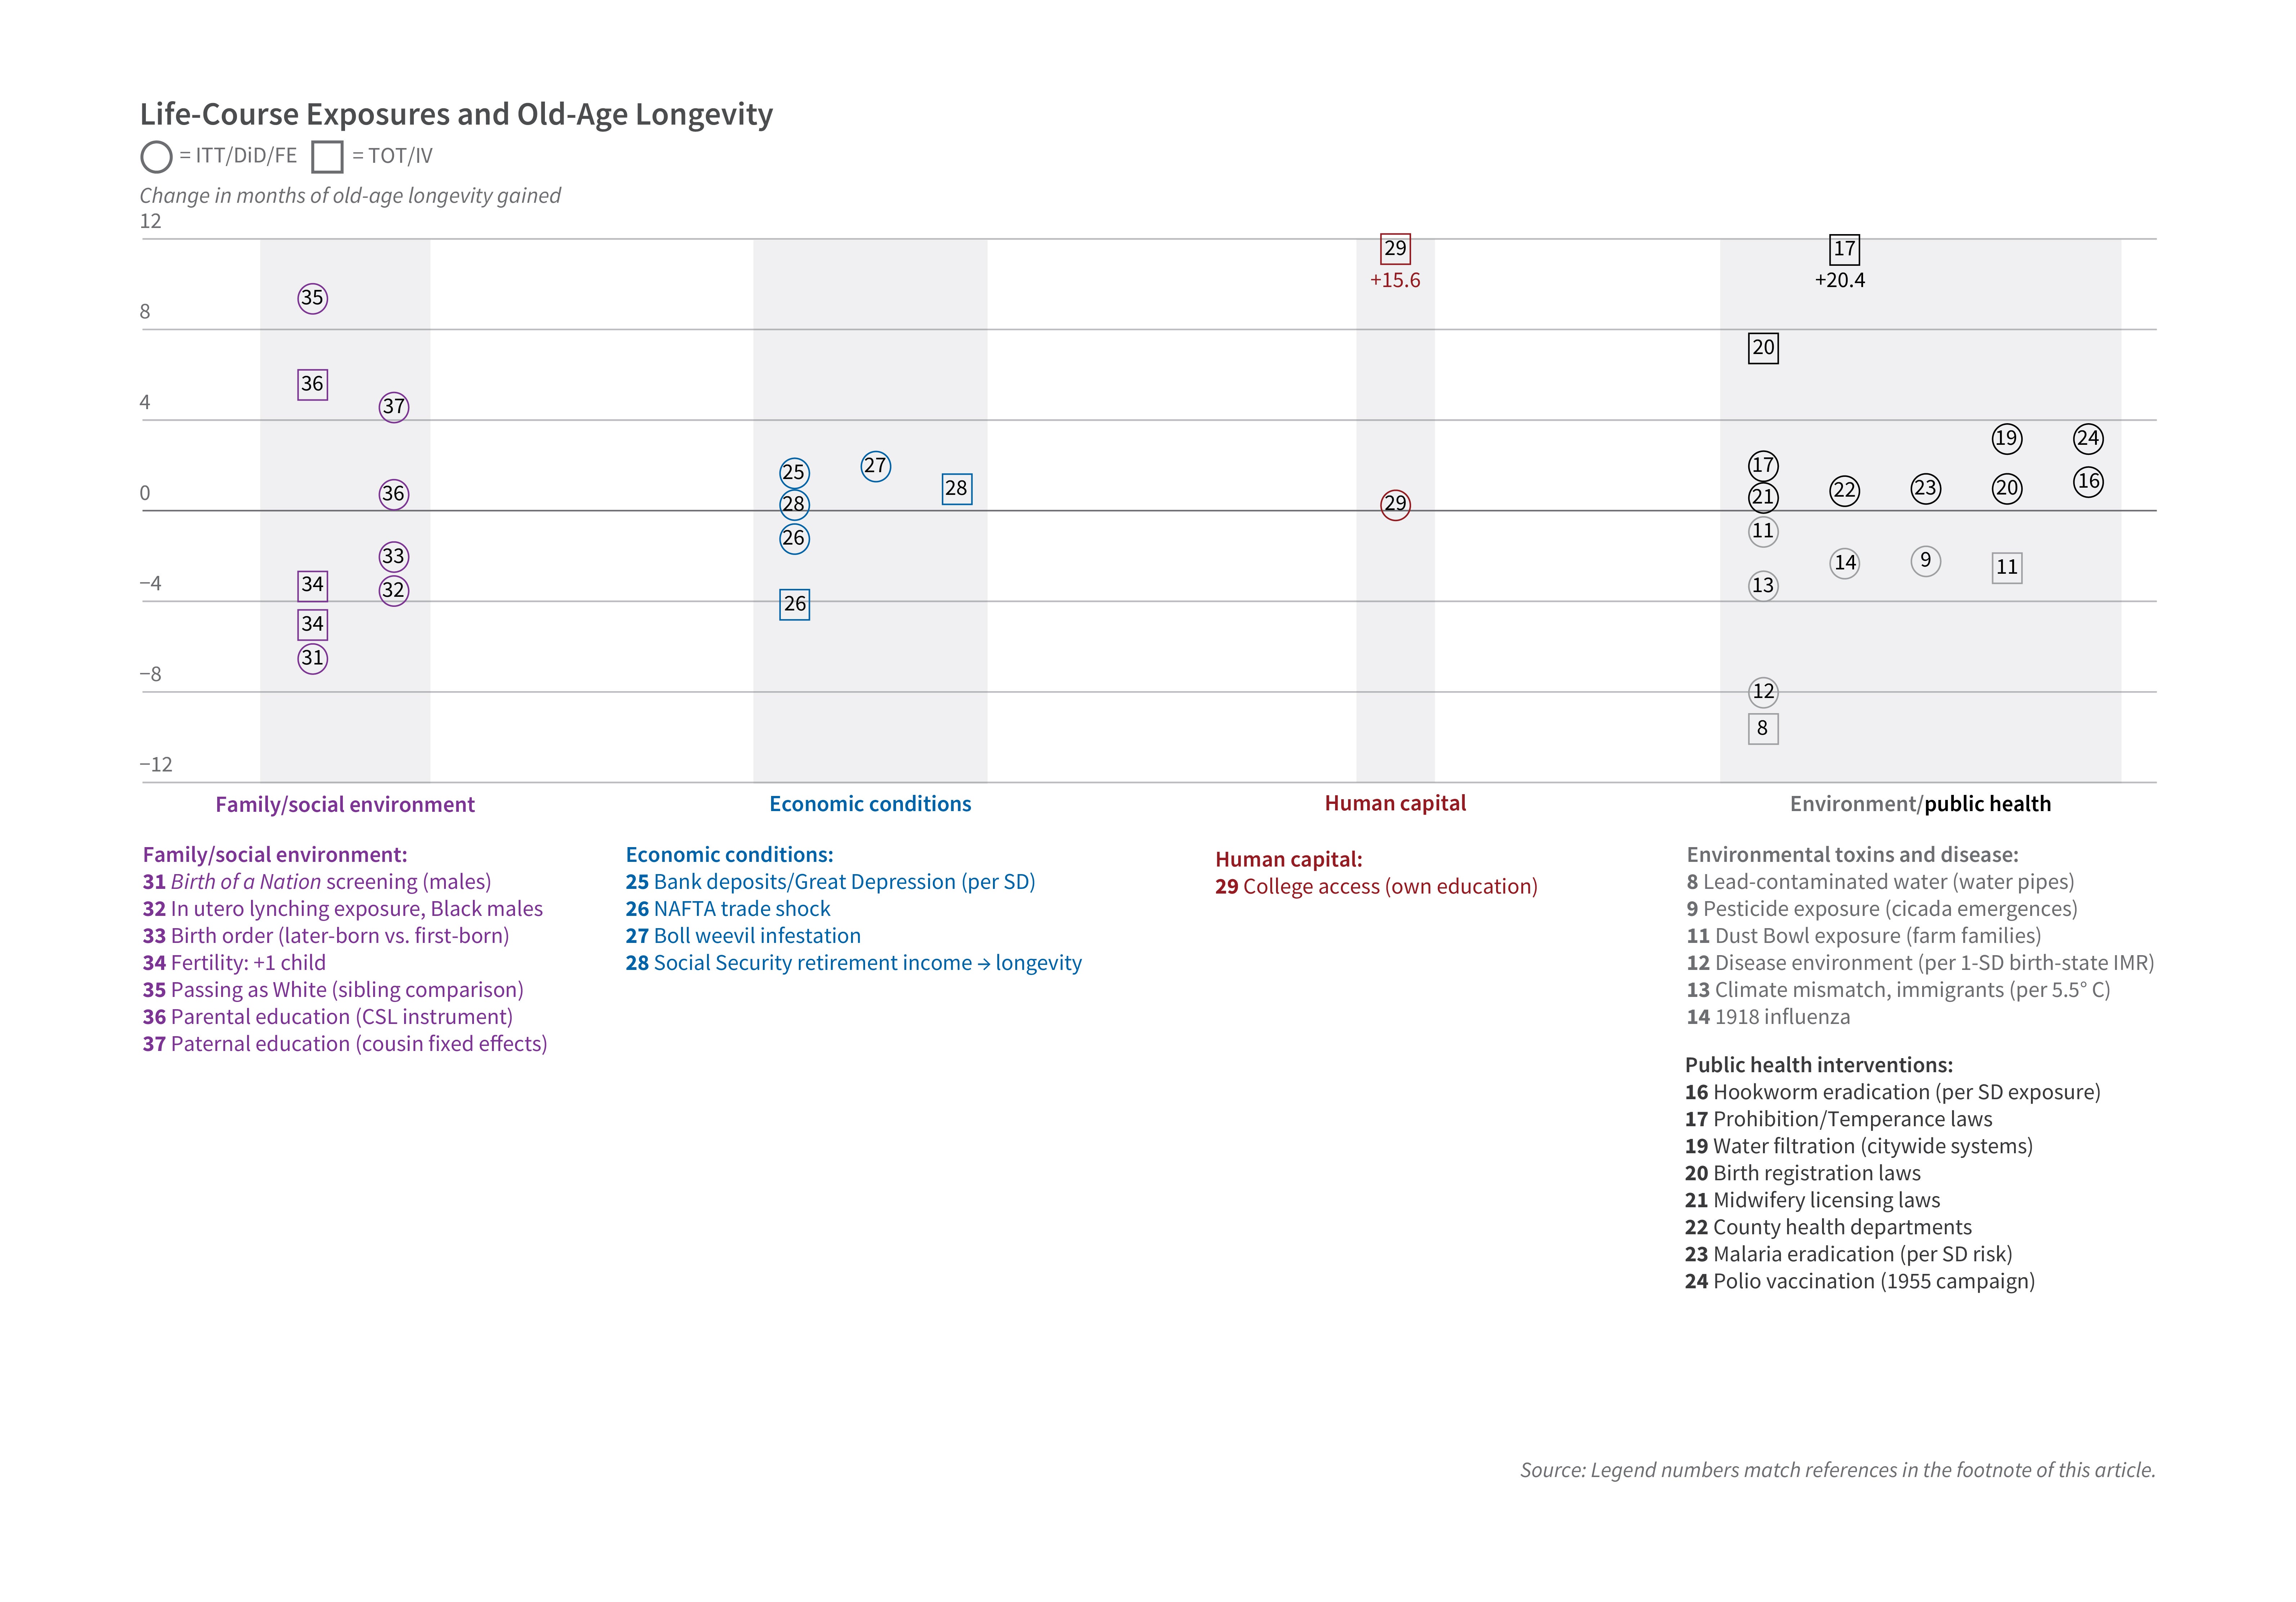
My studies with Noghanibehambari and other colleagues represent a systematic effort to fill in the empirical (and conceptual) map. Figure 2 arrays estimated months of longevity gained or lost in old age as a result of a large share of causes studied in our joint program—environmental toxins and disease, racialized violence, economic conditions, public health, human capital (including intergenerational education), and selected external benchmarks. These estimates use the same research designs used throughout this article: Social Security Administration death records linked to the full-count 1940 census through the CenSoc project, usually combined with spatial and temporal variation in exposure. In many cases we extend prior research that established short- or medium-run effects and trace implications for mortality decades later.6
Environmental Toxins and Disease
Lead-contaminated drinking water in cities that installed lead-pipe systems in the late nineteenth and early twentieth centuries has been linked to fertility, infant mortality, and birth outcomes.7 Our instrumental-variable estimates, exploiting proximity to lead refineries, imply roughly 9.6 months lower longevity at older ages.8 Pesticide exposure tied to periodical cicada emergences—which plausibly raised agricultural insecticide use—reduced longevity by about 2 months in intent-to-treat (ITT) estimates for highly agricultural counties, with ITT estimates for sons in highly exposed farm families on the order of 10 months.9 The Dust Bowl combined environmental and income shocks and caused persistent local income and migration responses to erosion.10 Our estimates imply roughly 2.5 months lower longevity among sons in highly exposed farm families.11 Figure 2 also lists related program papers on disease environment, climate, and the 1918 influenza pandemic.12,13,14
Public Health Interventions
Bleakley’s analysis of the Rockefeller hookworm eradication campaign in the American South anchors the short-run human-capital literature.15 We estimate the eradication campaign led to roughly 1.3 months higher longevity overall, with larger effects for non-White children and complementarities with Rosenwald school construction.16 In utero and early-childhood exposure to alcohol prohibition is associated with higher longevity in ITT estimates (and larger treatment-on-treated effects for heavily exposed cohorts).17 Municipal water filtration spread unevenly across cities and affected racial gaps in infant mortality.18 Our difference-in-differences estimates imply roughly 3.2 months higher longevity at older ages from filtration exposure.19 The figure adds county health departments, polio vaccination, malaria eradication, midwifery licensing, birth registration, and other interventions on the public health interventions panel.20,21,22,23,24
Economic Conditions and Policies
A large literature has linked economic resources to health. Our program adds to this literature with several examples: county bank deposits during the Great Depression, NAFTA-era trade shocks, the boll weevil infestation, and Social Security retirement income.25,26,27,28 College access—new four-year colleges near age 17—adds on the order of 1 to 1.6 years of longevity in treatment-on-treated estimates.29
Racial and Social Environment
Ang shows that screenings of the film The Birth of a Nation were followed by elevated racial violence; we estimate 6.5 months lower male longevity in highly exposed counties.30,31 Historical work on the geography of lynching motivates our measure of in utero exposure to a lynching in the county of birth; we estimate 3.5 months lower longevity for Black males, explaining a substantial fraction of the Black-White longevity gap in 1980.32 Figure 2 also includes birth order, fertility, "passing as white," intergenerational college, and paternal education.33,34,35,36,37
Across all of these papers, a pattern recurs that echoes the finding in Adriana Lleras-Muney and Flavien Moreau’s unified model of cohort mortality: Effects are largely invisible in middle age and emerge only after age 55 or 60.38 This latency is not a quirk of our data; it likely reflects the biology of how early-life conditions interact with aging processes, accumulating until the body’s reserves are depleted enough that the earlier insults become mortality determining.
Fully charting this terrain means facing real constraints. On the census side, records are released after a 72-year restriction, meaning the 1950 census became available only in 2022 and the 1960 census will not be public until 2032—leaving large blocks of birth cohorts and their associated exposures still out of reach for linked mortality analysis. On the death record side, individual-level mortality data before the mid-1970s are largely absent, a gap that is striking for a country of such administrative capacity; coverage from the 1970s through the early 2000s is relatively complete for older ages (through Social Security application links) but sparse for younger ones. A further break came around 2005, when a policy change led many states to stop sharing mortality data with federal systems, producing a significant drop in coverage in the publicly available linked files. The combined effect is to circumscribe our analytical window to birth cohorts of roughly the 1910s through 1930s, whose deaths fall in the well-covered 1975–2005 window—which in turn determines which historical exposures and policies can be studied. Ongoing work in our group is extending this forward using the newly available 1950 census, accepting less-complete death record coverage to examine exposures from the 1940s and 1950s whose effects may manifest through midlife rather than just old age.
Even within the available window, a second set of constraints shapes what can be measured. Going back in time to characterize early-childhood exposures requires relying on indirect and ecological proxies rather than direct biological measurement. Our cicada paper illustrates the approach: Cicada emergence serves as an indirect measure of pesticide application in agricultural counties, which in turn proxies for infant exposure—a chain of inference that is plausible and well supported but very different from a blood lead level or a daily pollution reading. As a result, nearly all estimates in this literature are ITT, applying to everyone in an exposed geographic area regardless of actual dose. This mode of inference is standard in economic history and has genuine strengths—ecological exposure is often less subject to selection than individual behavioral choices and is often directly policy relevant—but it sacrifices the mechanistic specificity that contemporary data with ICD-coded diagnoses, biomarkers, and daily exposure measurements would provide.
What Have We Learned, and What Comes Next?
The accumulated evidence suggests a striking pattern: Early-life conditions routinely shift old-age longevity by one to four months, in both directions, depending on whether the exposure was a toxin or a beneficial intervention. These are not small effects. A one-to-four-month shift in average longevity, applied to the cohorts born between 1900 and 1940, represents millions of life-years—and the effects compound across exposures, since few people experienced only one. To put the magnitudes in perspective roughly, the full set of early-life exposures we have studied, taken together, could plausibly account for a meaningful share of the overall improvement in old-age longevity observed across the twentieth century. Much more work remains before we can be precise about that accounting, but the direction is clear. What happens in the first years of life does not disappear at 65.
Data Infrastructure
The ability to pursue this research program rests on a data breakthrough: the creation of large-scale linked datasets connecting historical census records to decades-long mortality outcomes. Three data products deserve mention.
The CenSoc project, developed at Berkeley and now in its third version, links the full-count 1940 US census to Social Security Administration death records—producing a CenSoc-DMF file covering 5.3 million male deaths from 1975 to 2020 and a CenSoc-Numident file covering 7.0 million records of all genders from 1988 to 2005.39 Nearly every paper in the research program described here uses one of these datasets. Their scale—millions of observations—makes it feasible to detect the modest-but-real effects of early-life exposures that would be invisible in smaller survey-based studies, and to implement fine-grained geographic and cohort comparisons that identification requires.
The IPUMS Multigenerational Longitudinal Panel (MLP) links individuals across US censuses from 1850 to 1950, tracking more than 175 million people across 645 million census links.40 The MLP opens the possibility of studying intergenerational pathways—how conditions experienced by parents and grandparents transmit to children’s long-run health, a question that CenSoc, anchored to 1940, cannot fully address—but one we have begun to examine empirically, finding that parental college access and fathers’ educational attainment have significant positive effects on children’s old-age longevity, with treatment-on-treated estimates ranging from 4 to 6 months for a college-educated father.41,42 The LIFE-M project provides complementary infrastructure, linking 1880–1940 census records to birth, marriage, and death certificates for Ohio and North Carolina, enabling cause-of-death analysis and intergenerational tracing in those states.43
Despite these advances, two additional data sources remain largely off the table—underutilized not from lack of interest but from structural barriers. Medicare administrative records contain detailed information on medical care utilization, diagnoses, and (through additional links) cause of death for virtually all Americans over 65; together with links to place of birth, they would allow researchers to trace the mechanisms by which early-life conditions translate into specific diseases and medical trajectories in old age. But access is expensive and administratively slow, effectively limiting use to well-resourced teams with institutional relationships with the Centers for Medicare and Medicaid Services. Large-scale electronic health record data present a complementary barrier: The records exist and contain richer clinical detail than any administrative source, but interoperability and data-sharing agreements remain immature at the scale needed for population-level causal inference. As my coauthors and I document elsewhere, these two data sources hold the keys to filling in the next round of details—the causes of death, the disease mechanisms, and the clinical pathways that connect early-life exposures to mortality statistics decades later.44
Endnotes
“Actuarial Life Table,” Social Security Administration.
“The Determinants of Mortality,” Cutler DM, Deaton AS, Lleras-Muney A. NBER Working Paper 11963, January 2006, and Journal of Economic Perspectives 20(3), Summer 2006, pp. 97–120.
“Cohort Mortality Forecasts Indicate Signs of Deceleration in Life Expectancy Gains,” Andrade J, Camarda CG, Pifarré i Arolas H. PNAS 122(35), August 2025, Article e2519179122; ”Trend Breaks in Life Expectancy in the United States over 120 Years and Potential Sources of Future Gains,” Shi J, Fletcher JM. Population Studies, September 2025, pp. 1–18.
“Life Tables for the United States Social Security Area 1900–2100,” Bell FC, Miller ML. Social Security Administration Actuarial Study Number 120, Office of the Chief Actuary, August 2005.
“Cohort Mortality Forecasts Indicate Signs of Deceleration in Life Expectancy Gains,” Andrade J, Camarda CG, Pifarré i Arolas H. PNAS 122(35), August 2025, Article e2519179122.
“CenSoc Mortality File: Version 3.0 [dataset],” Goldstein JR, Alexander M, Breen C, González AM, Menares F, Osborne M, Snyder M, Yildirim U. University of California, Berkeley, 2023.
The Impact of Lead Exposure on Fertility, Infant Mortality, and Infant Birth Outcomes,” Clay K, Hollingsworth A, Severnini ER. NBER Working Paper 31379, June 2023, and Review of Environmental Economics and Policy 18(2), Summer 2024, pp. 301–320.
“Early-Life Lead Exposure and Male Longevity: Evidence from Historical Municipal Water Systems,” Fletcher J, Noghanibehambari H. Explorations in Economic History 97, July 2025, Article 101701.
“The Siren Song of Cicadas: Early-Life Pesticide Exposure and Later-Life Male Mortality,” Fletcher J, Noghanibehambari H. Journal of Environmental Economics and Management 123, January 2024, Article 102903.
“Evidence on Early-Life Income and Late-Life Health from America’s Dust Bowl Era,” Cutler DM, Miller G, Norton DM. PNAS 104(33), August 2007, pp. 13244–13249.
“Dust to Feed, Dust to Grey: The Effect of In-Utero Exposure to the Dust Bowl on Old-Age Longevity,” Noghanibehambari H, Fletcher J. NBER Working Paper 30531, October 2022, and Demography 61(1), February 2024, pp. 87–113.
“The Long Shadow of the Past: Early-Life Disease Environment and Later-Life Mortality,” Noghanibehambari H, Fletcher JM. IZA Discussion Paper 16503, October 2023.
“Chilling Sunsets: Climate Distances and Later-Life Mortality of Immigrants,” Noghanibehambari H, Fletcher J. Environmental and Resource Economics 88, August 2025, pp. 3367–3396.
“Walking with Feet Tied to the Past: Childhood Exposure to the 1918 Influenza Pandemic and Later-Life Mortality,” Noghanibehambari H, Fletcher J. Working Paper.
“Disease and Development: Evidence from Hookworm Eradication in the American South,” Bleakley H. The Quarterly Journal of Economics 122(1), February 2007, pp. 73–117.
“Unhooking the Past: Early-Life Exposure to Hookworm Eradication and Later-Life Longevity,” Noghanibehambari H, Fletcher J. NBER Working Paper 32249, December 2024, and Journal of Health Economics 106, March 2026, Article 103120.
“In-Utero and Childhood Exposure to Alcohol and Old Age Mortality: Evidence from the Temperance Movement in the US,” Noghanibehambari H, Fletcher J. Economics & Human Biology 50, August 2023, Article 101276.
“Water Purification Efforts and the Black-White Infant Mortality Gap, 1906–1938,” Anderson DM, Charles KK, Rees DI, Wang T. NBER Working Paper 26489, November 2019, and Journal of Urban Economics 122, March 2021, Article 103329.
“Water Is Life, Clean Water Means Health: The Effect of Early-Life Exposure to Citywide Water Filtration on Old-Age Male Mortality,” Noghanibehambari H, Fletcher J. American Journal of Health Economics 12(2), Spring 2026, pp. 199–230.
“Childhood Exposure to Birth Registration Laws and Old-Age Mortality,” Noghanibehambari H, Fletcher J. Health Economics 32(3), March 2023, pp. 735–743.
“Long-Term Health Benefits of Occupational Licensing: Evidence from Midwifery Laws,” Noghanibehambari H, Fletcher J. Journal of Health Economics 92, December 2023, Article 102807.
“Blueprints of Maladies: Early-Life Malaria Eradication and Later-Life Mortality,” Noghanibehambari H, Fletcher J. Working Paper, 2025.
“Protection from Early-Life Disease: The 1955 Polio Vaccination Campaign and Later-Life Mortality,” Noghanibehambari H, Vu H, Fletcher J. Working Paper.
“Early-Life Economic Conditions and Old-Age Male Mortality: Evidence from Historical County-Level Bank Deposit Data,” Noghanibehambari H, Fletcher J, Schmitz L, Duque V, Gawai V. Journal of Population Economics 37, February 2024, Article 32.
“The Silk Road of Ashes: Exposure to NAFTA and Adult Mortality,” Noghanibehambari H, Fletcher J. NBER Working Paper 34840, February 2026.
“A Blessing in Disguise: Boll Weevil Infestation and Old-Age Male Longevity,” Noghanibehambari H, Fletcher J. Working Paper, 2026.
“In Money, We Survive: The Effects of Social Security Retirement Income on Longevity,” Noghanibehambari H, Fletcher J. Forthcoming in the American Journal of Health Economics.
“The Effects of Education on Mortality: Evidence Using College Expansions,” Fletcher J, Noghanibehambari H. NBER Working Paper 29423, October 2021 and Health Economics, 33(3), March 2024.
“The Birth of a Nation: Media and Racial Hate,” Ang D. American Economic Review 113(6), June 2023, pp. 1424–1460.
“Mortality in the Long Shot: Lasting Legacies of Screening the The Birth of a Nation,” Fletcher J, Noghanibehambari H. Working Paper, 2025.
“Is Lynching Over? Long-Term Effects of In Utero Exposure to Racialized Violence in the US Black Population,” Vu H, Noghanibehambari H, Fletcher J, Green T. Working Paper, 2026.
“The Early Bird Catches the Worm: The Effect of Birth Order on Old-Age Mortality,” Noghanibehambari H, Fletcher J. Population and Development Review 49(3), September 2023, pp. 531–560.
“Children Are Bridges to Heaven: The Effects of Fertility on Later-Life Mortality,” Fletcher J, Noghanibehambari H. NBER Working Paper 34378, October 2025.
“Passing as White: Racial Identity and Old-Age Longevity,” Noghanibehambari H, Fletcher J. NBER Working Paper 33394, January 2025.
“The Effects of Parental Education on Male Mortality: Evidence from the First Wave of Compulsory Schooling Laws,” Noghanibehambari H, Amin V, Fletcher J. Journal of Population Economics 38, November 2025, Article 77.
“Unequal Before Death: The Effect of Paternal Education on Children’s Old-Age Mortality in the United States,” Noghanibehambari H, Fletcher J. Population Studies 78(2), March 2024, pp. 203–229.
“A Unified Model of Cohort Mortality for Economic Analysis,” Lleras-Muney A, Moreau FE. NBER Working Paper 28193, December 2020, and Demography 59(6), December 2022, pp. 2109–2134.
“CenSoc Mortality File: Version 3.0 [dataset],” Goldstein JR, Alexander M, Breen C, González AM, Menares F, Osborne M, Snyder M, Yildirim U. University of California, Berkeley, 2023.
“IPUMS Multigenerational Longitudinal Panel: Version 2.0 [dataset],” Ruggles S, Ozder N, Fitch CA, Sobek M, Rivera Drew JA, Hacker JD, Helgertz J, Lonobile C, Nelson MA, Roberts E, and Warren JR. Minneapolis, MN: IPUMS, 2025. https://doi.org/10.18128/D016.V2.0.
“The Effects of Parental Education on Male Mortality: Evidence from the First Wave of Compulsory Schooling Laws,” Noghanibehambari H, Amin V, Fletcher J. Journal of Population Economics 38, November 2025, Article 77.
“Unequal Before Death: The Effect of Paternal Education on Children’s Old-Age Mortality in the United States,” Noghanibehambari H, Fletcher J. Population Studies 78(2), March 2024, pp. 203–229.
“The Creation of LIFE-M: The Longitudinal, Intergenerational Family Electronic Micro-Database Project,” Bailey M, Lin PZ, Shariq Mohammed AR, Mohnen P, Murray J, Zhang M, Prettyman A. Historical Methods: A Journal of Quantitative and Interdisciplinary History 56(3), August 2023, pp. 138–159.
“Using Big Data to Uncover the Causes of Dementia,” Fletcher J, Venkataramani A, Rehkopf DH. Nature Health 1, January 2026, pp. 272–274.