Stiglerian Growth
Search frictions in the labor market make it difficult for workers to locate the jobs that best suit their abilities. Search frictions in the product market make it difficult for buyers to find the products that best suit their preferences. Improvements in information and communications technology (ICT) that have ostensibly reduced search frictions —telephones, fax machines, the internet, smartphones — should have made it easier for workers to find better jobs and, in turn, led to labor productivity growth. The same technological improvements should have made it easier for buyers to locate sellers and, in turn, led to welfare gains.
I refer to the economic growth generated by declining search frictions as “Stiglerian growth” because George Stigler was the first to recognize the importance of information frictions in product and labor markets, and to understand that they can cause misallocation. In Stigler’s words, “The better informed the labor market, the closer each worker’s product to its maximum at any given time,” and conversely, “In a regime of ignorance, Enrico Fermi would have been a gardener, Von Neumann a checkout clerk at a drugstore.”1
Stiglerian Growth in the Labor Market
Paolo Martellini and I try to measure the effect of declining search frictions on productivity growth in the labor market.2 Measuring this effect requires identifying the structure of the search problem facing workers and firms, assessing the effect of technological improvements on the rate at which workers and firms come into contact, and assessing the addition to productivity induced by an increase in the contact rate between workers and firms.
Search frictions in the labor market cause unemployment and vacancies to coexist. In fact, search frictions make it time-consuming for workers to locate job openings and for firms to locate workers to fill vacant jobs, and in aggregate they lead to the coexistence of unemployment and vacancies. As search frictions decline due to improvements in ICT, one would expect the labor market to converge towards an equilibrium in which the unemployment and vacancy rates are both zero. Indeed, this is the prediction of the canonical Diamond-Mortensen-Pissarides search-theoretic model of the labor market.
This prediction is not borne out in the data, calling this model into question. Figure 1 is the scatterplot of the unemployment rate and the vacancy rate — the Beveridge curve — in the United States from 1927 to 2019. There is no evidence that the curve has shifted inward — to the left — over time. Figure 2 plots the time series of the unemployment rate and the vacancy rate, and Figure 3 plots the time series of the rate at which unemployed workers become employed (UE rate) and the rate at which employed workers become unemployed (EU rate). There are no clear secular trends in any of these series.
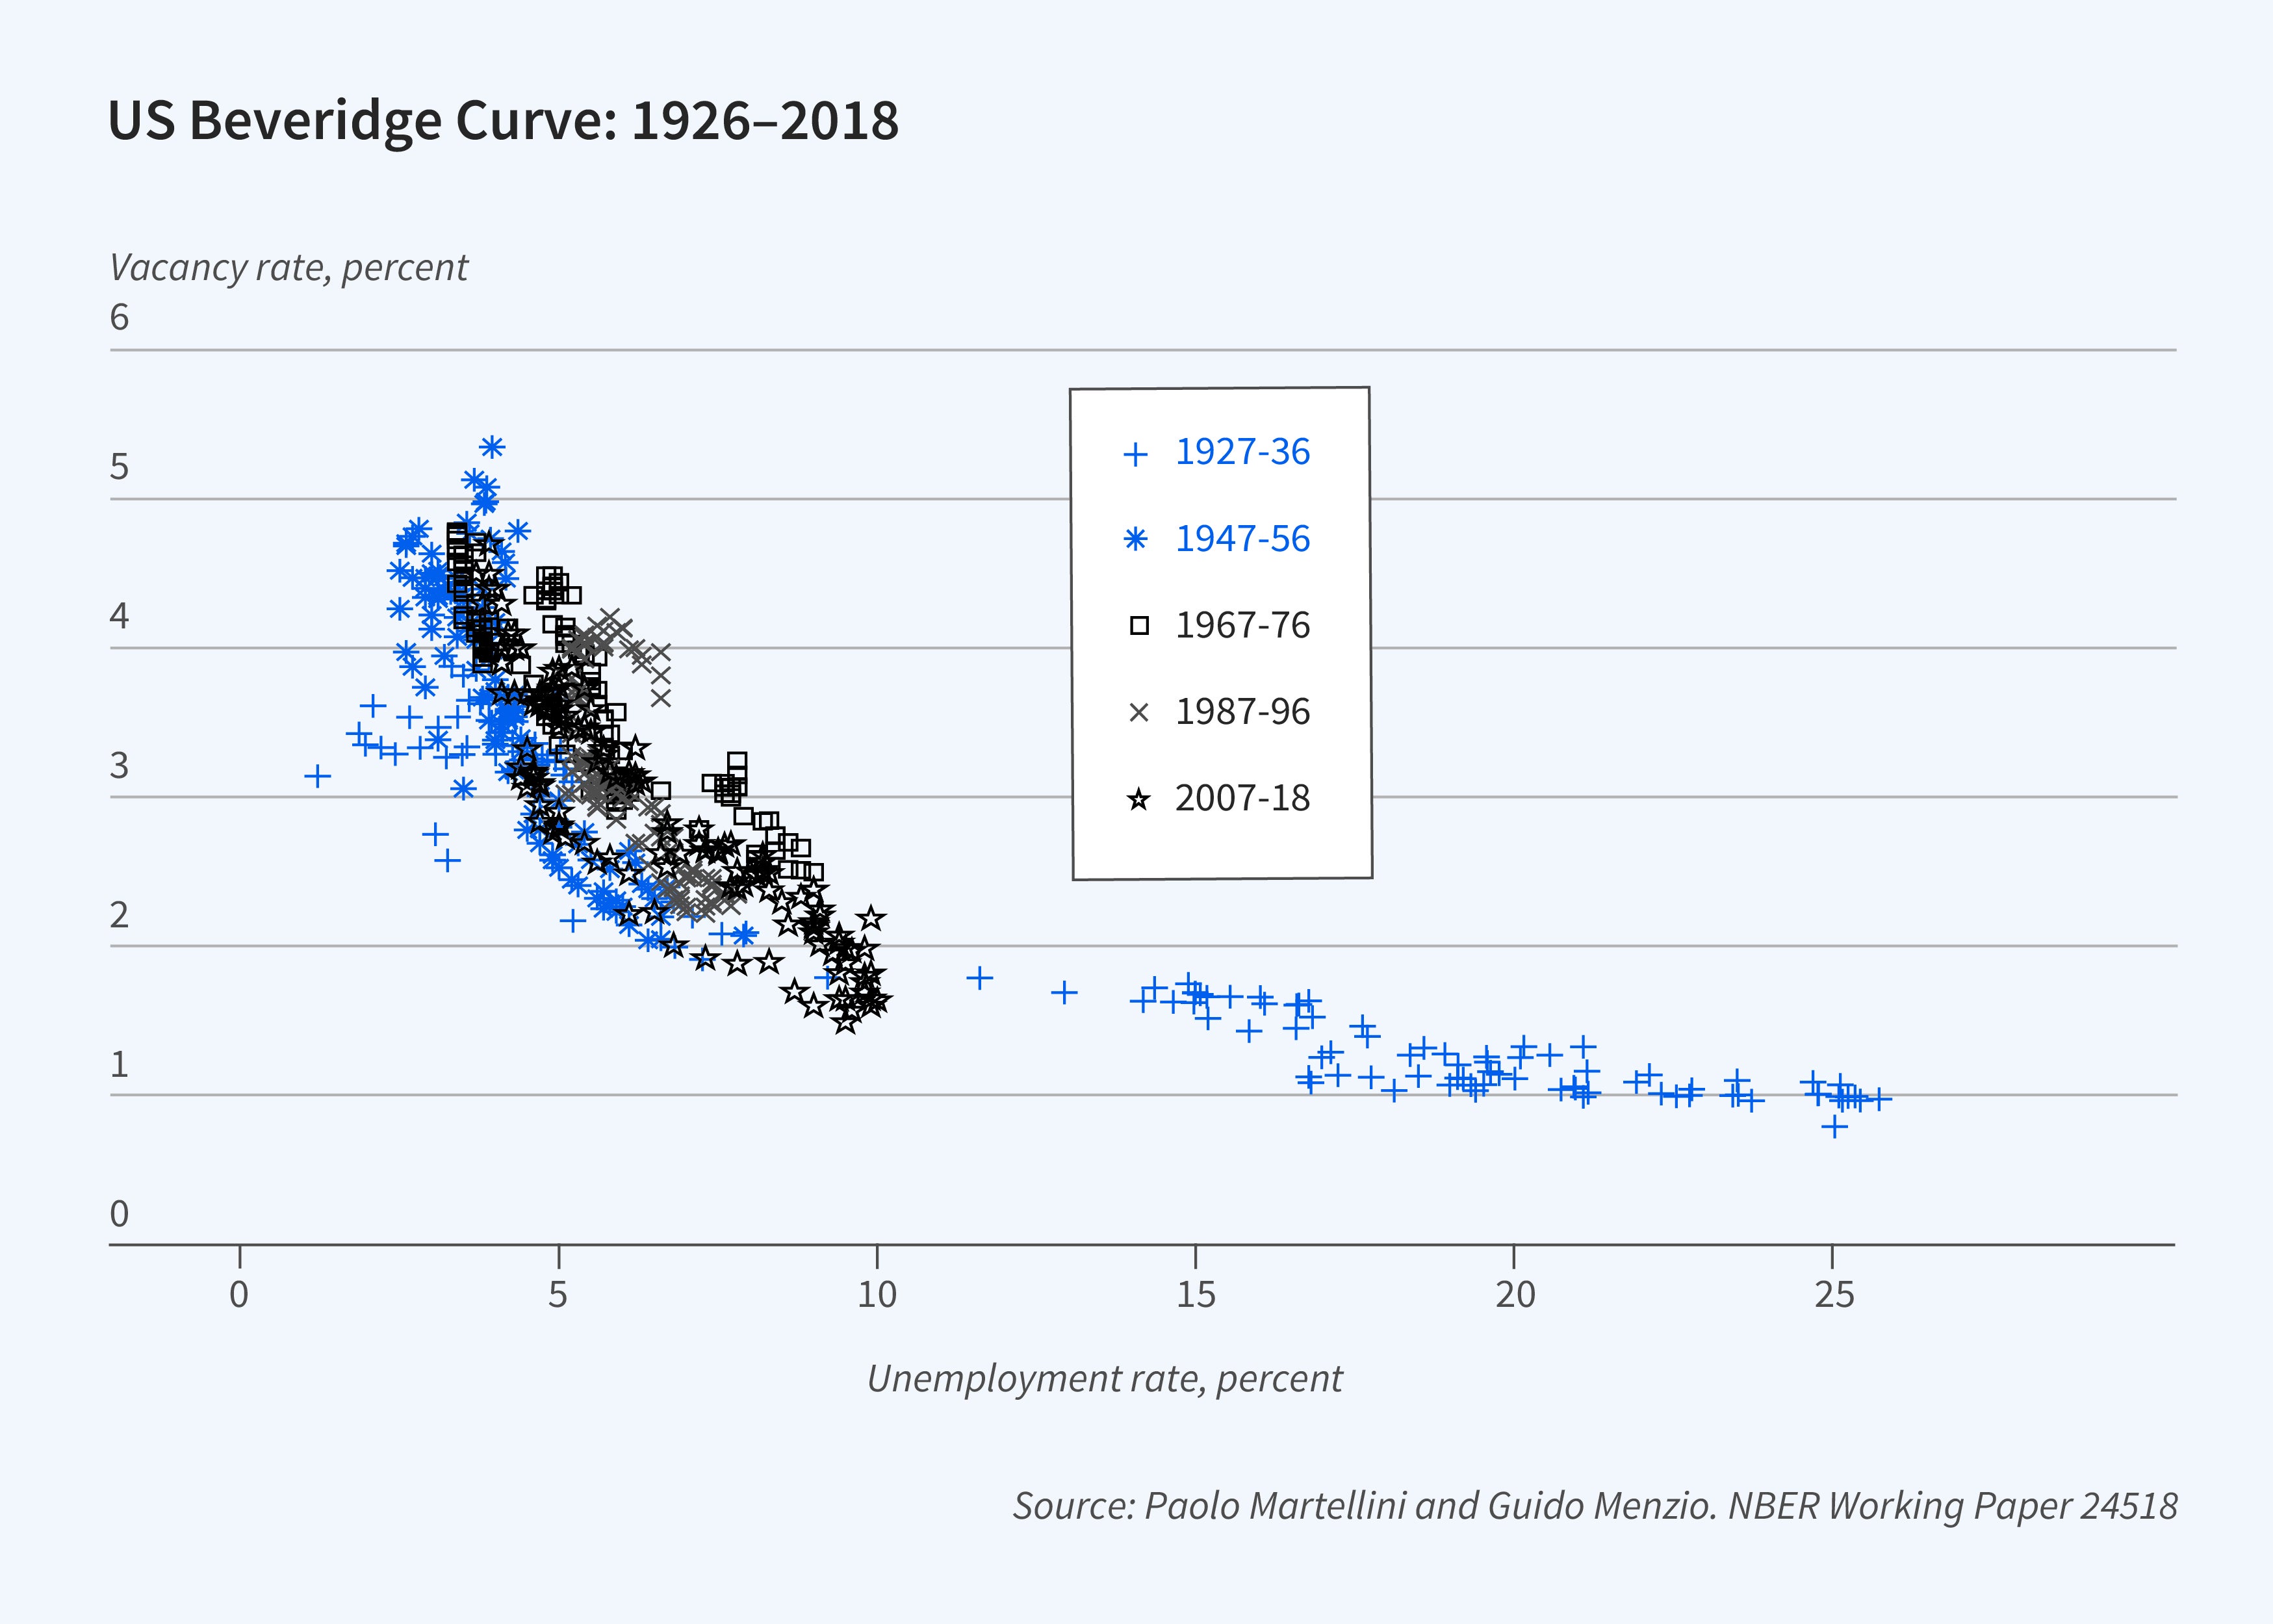
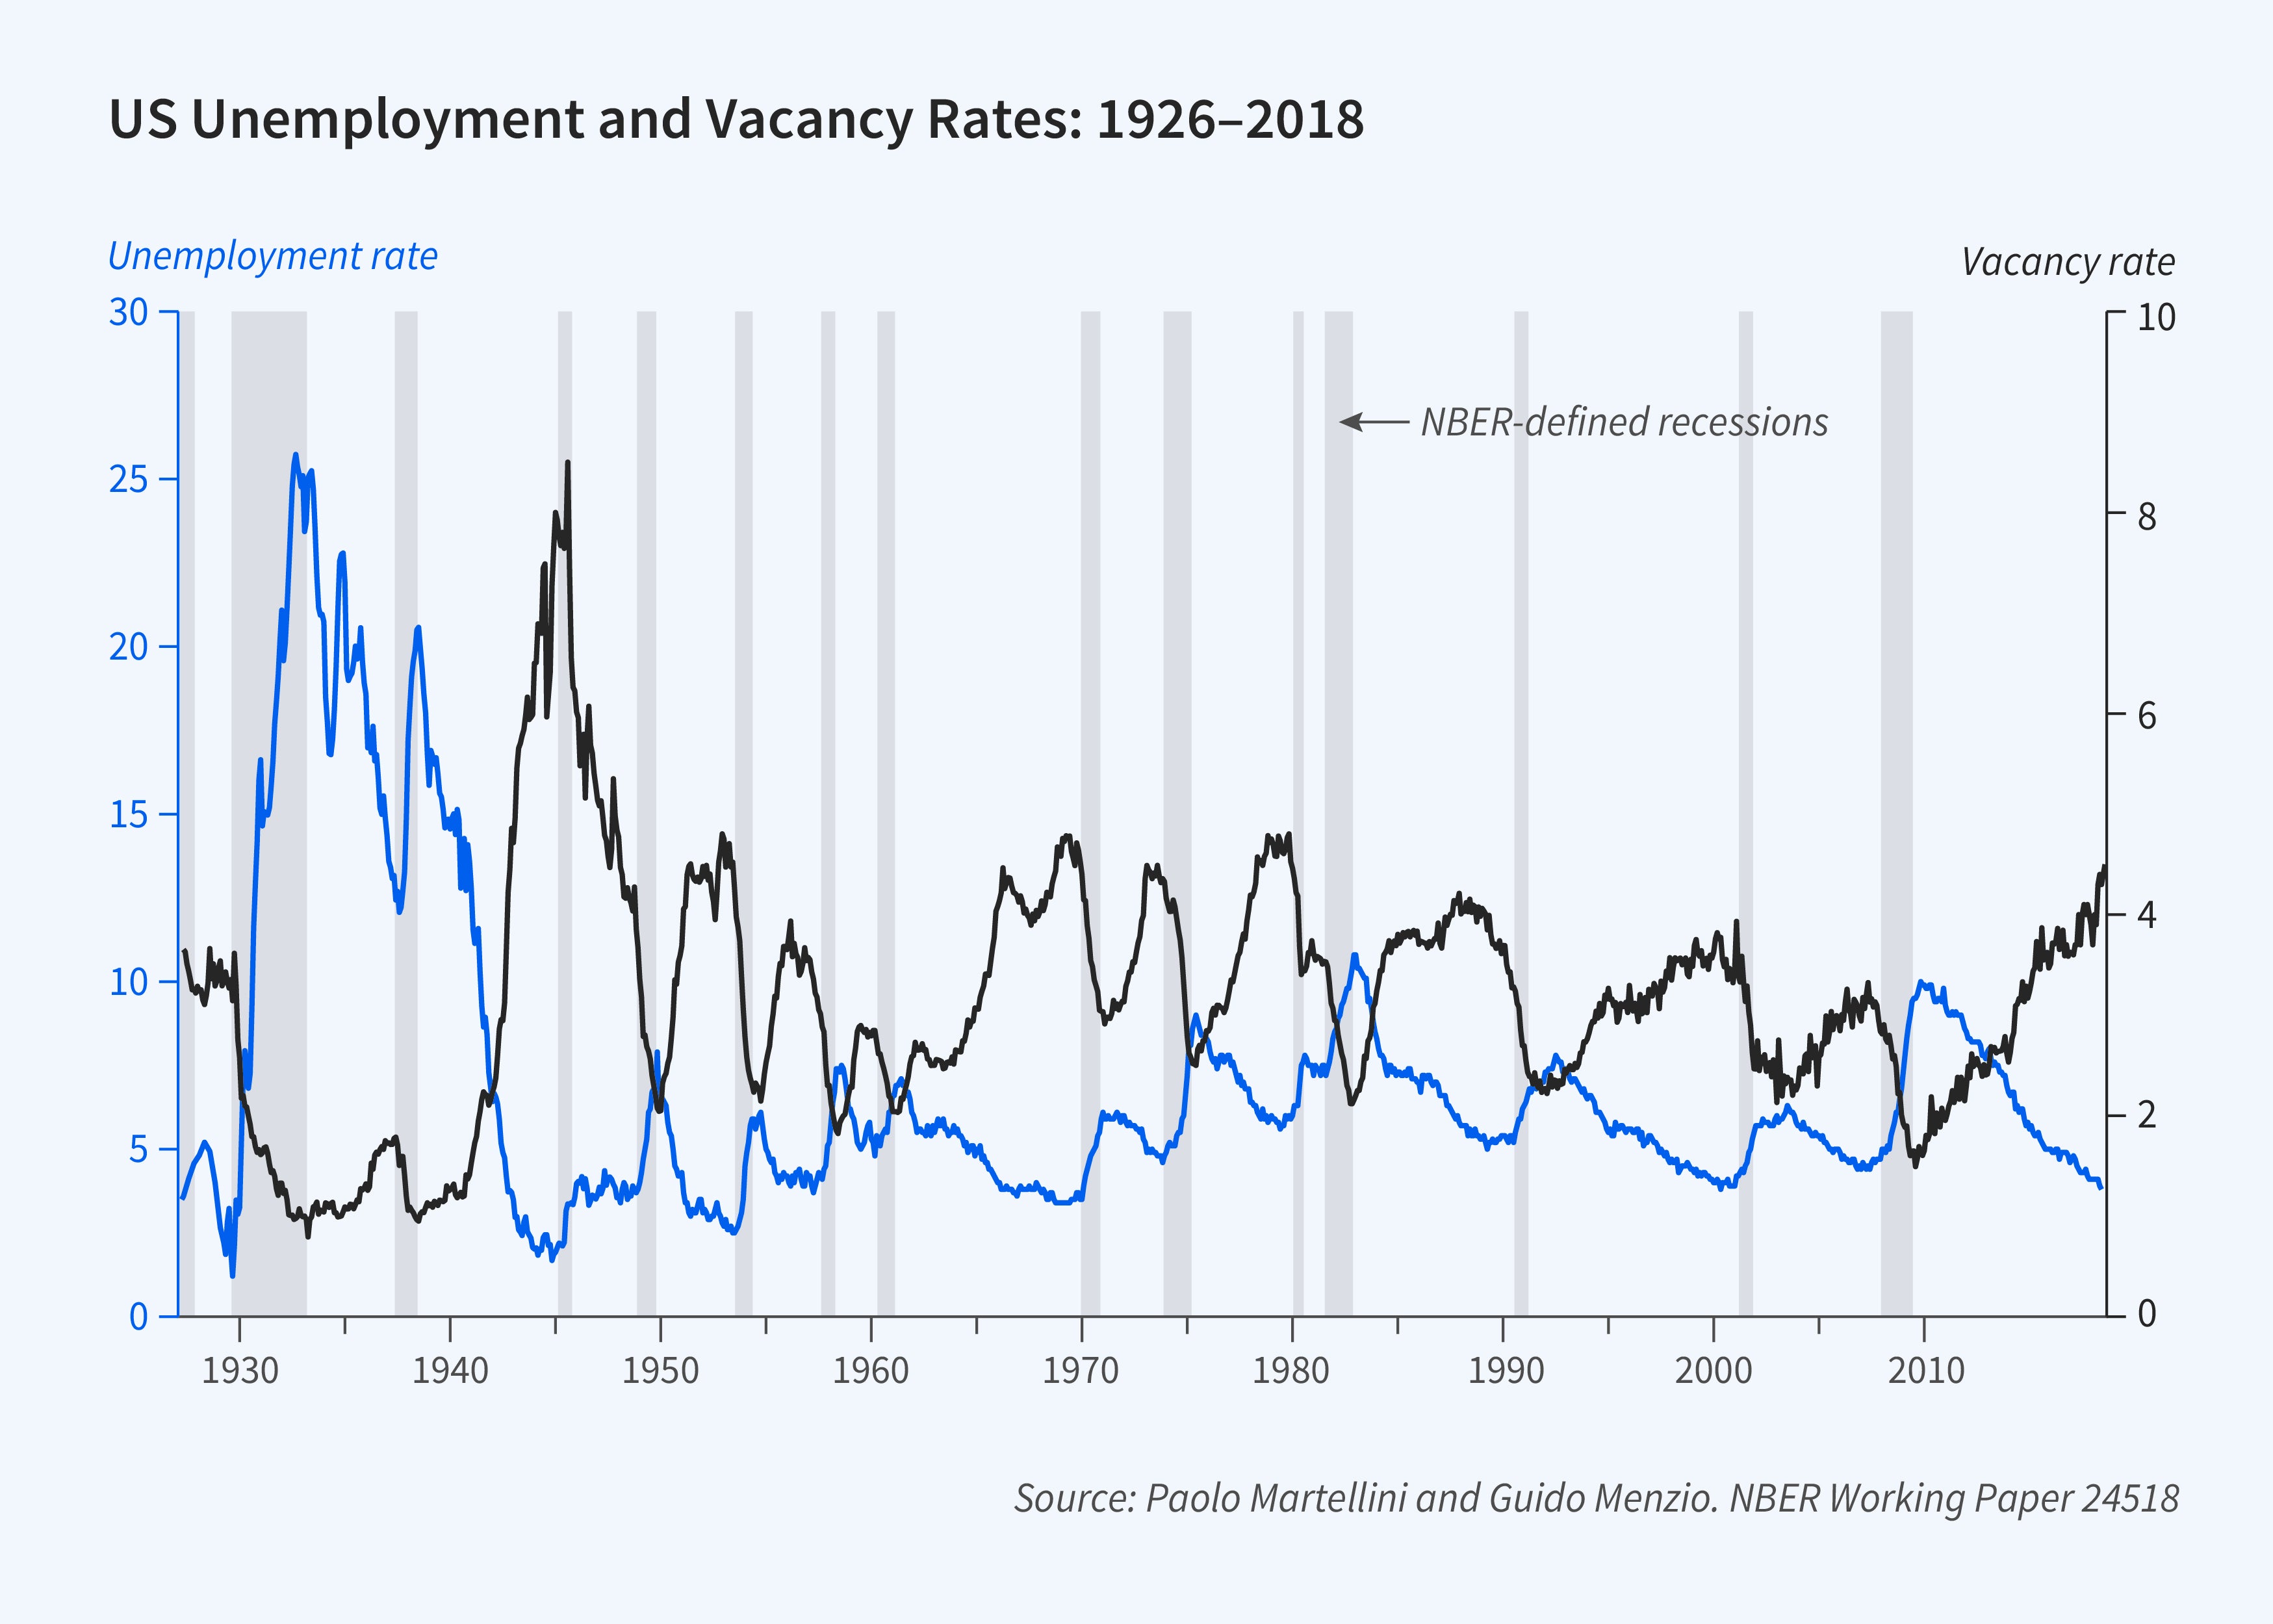
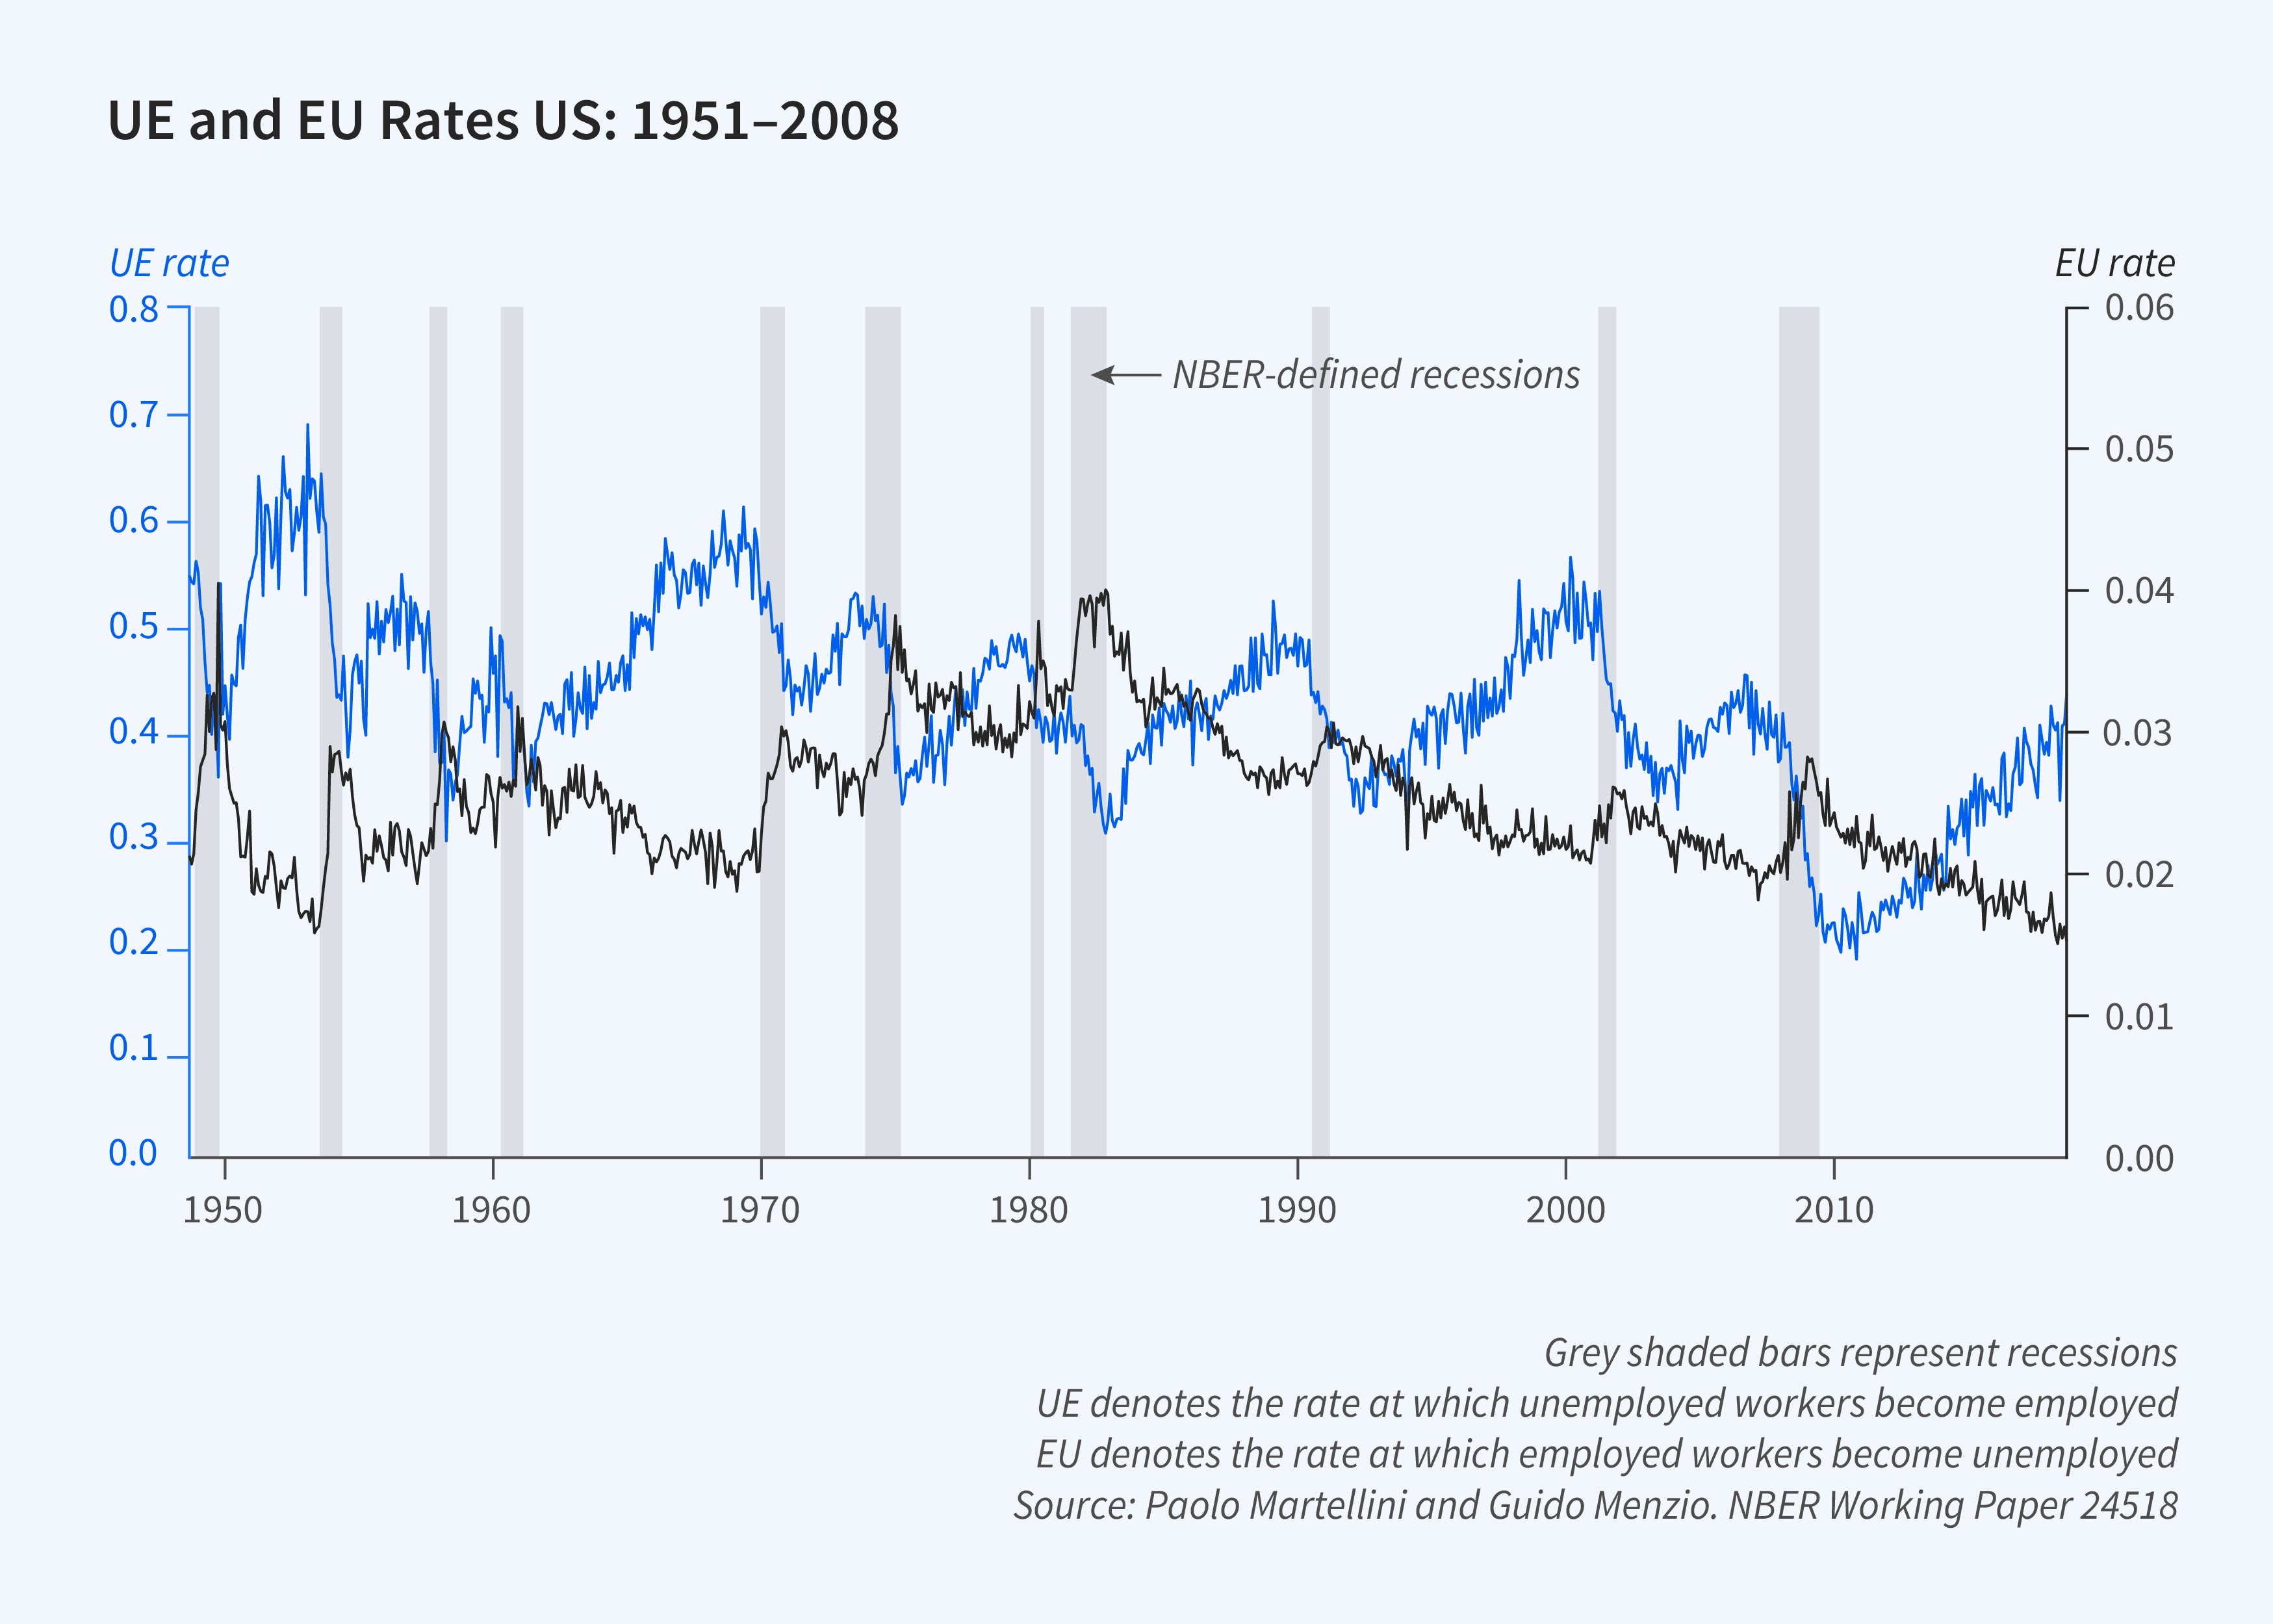
A credible search model must rationalize the stability of the Beveridge curve and the stationarity of unemployment, vacancy, UE, and EU rates in the face of the massive improvements in ICT that took place between 1927 and 2018. How can it do that? Suppose that firms and workers searching the labor market meet according to some matching function with an efficiency parameter that grows over time at the rate of gA. Suppose that upon meeting, a firm and a worker observe how productive their match will be, and based on that, they decide whether to enter an employment relationship. In such a model, declining search frictions have two countervailing effects on the unemployment rate. On the one hand, declining search frictions increase the rate at which workers meet firms, which tends to lower the unemployment rate. On the other hand, declining search frictions increase the quality cutoff above which workers and firms are willing to enter an employment relationship, which tends to increase the unemployment rate. If match quality is distributed according to a Pareto distribution, the two effects cancel out. Specifically, there exists a balanced growth path along which the unemployment, vacancy, UE, and EU rates remain constant and the Beveridge curve remains stable. Along the balanced growth path, declining search frictions generate economic growth and labor productivity grows at the rate of gA/α, where α is the tail index parameter for the Pareto distribution of match quality.
The rate of “Stiglerian growth” in the labor market, gA/α, thus depends on the product of the rate at which search frictions decline, gA, and the reciprocal of the Pareto distribution parameter, 1/α, which is a measure of the heterogeneity in a worker’s productivity when employed in different jobs. Conceptually, measuring these two quantities is a straightforward task. The rate at which search frictions decline is equal to the growth rate of the average number of workers who apply to a vacancy before the vacancy is filled. The tail index α of the Pareto distribution of match quality is related to the cross-sectional dispersion of wages for identical workers. Concretely, measuring gA and α is difficult. It is, nonetheless, possible to carry out some back-of-the-envelope calculations.
In 1980, the average number of applicants per vacancy was around 24. In 2010, it was around 45. Thus, over the period 1980–2010, the average growth rate of applicants per vacancy was about 2.2 percent per year; this is an estimate of gA. If the Pareto parameter is 5, the productivity of a worker who draws a match at the 90th percentile of the distribution — a very good match — is 37 percent greater than that of an identical worker who draws a median (50th percentile) match. In light of empirical studies that provide structural decompositions of wage dispersion, a 90-50 percentile ratio of 37 percent seems like a conservative estimate of the extent of residual wage dispersion. For gA = 2.2 percent and α = 5, Stiglerian growth in the labor market is about 0.44 percent per year, about 20 percent of the observed long-term growth rate of labor productivity.
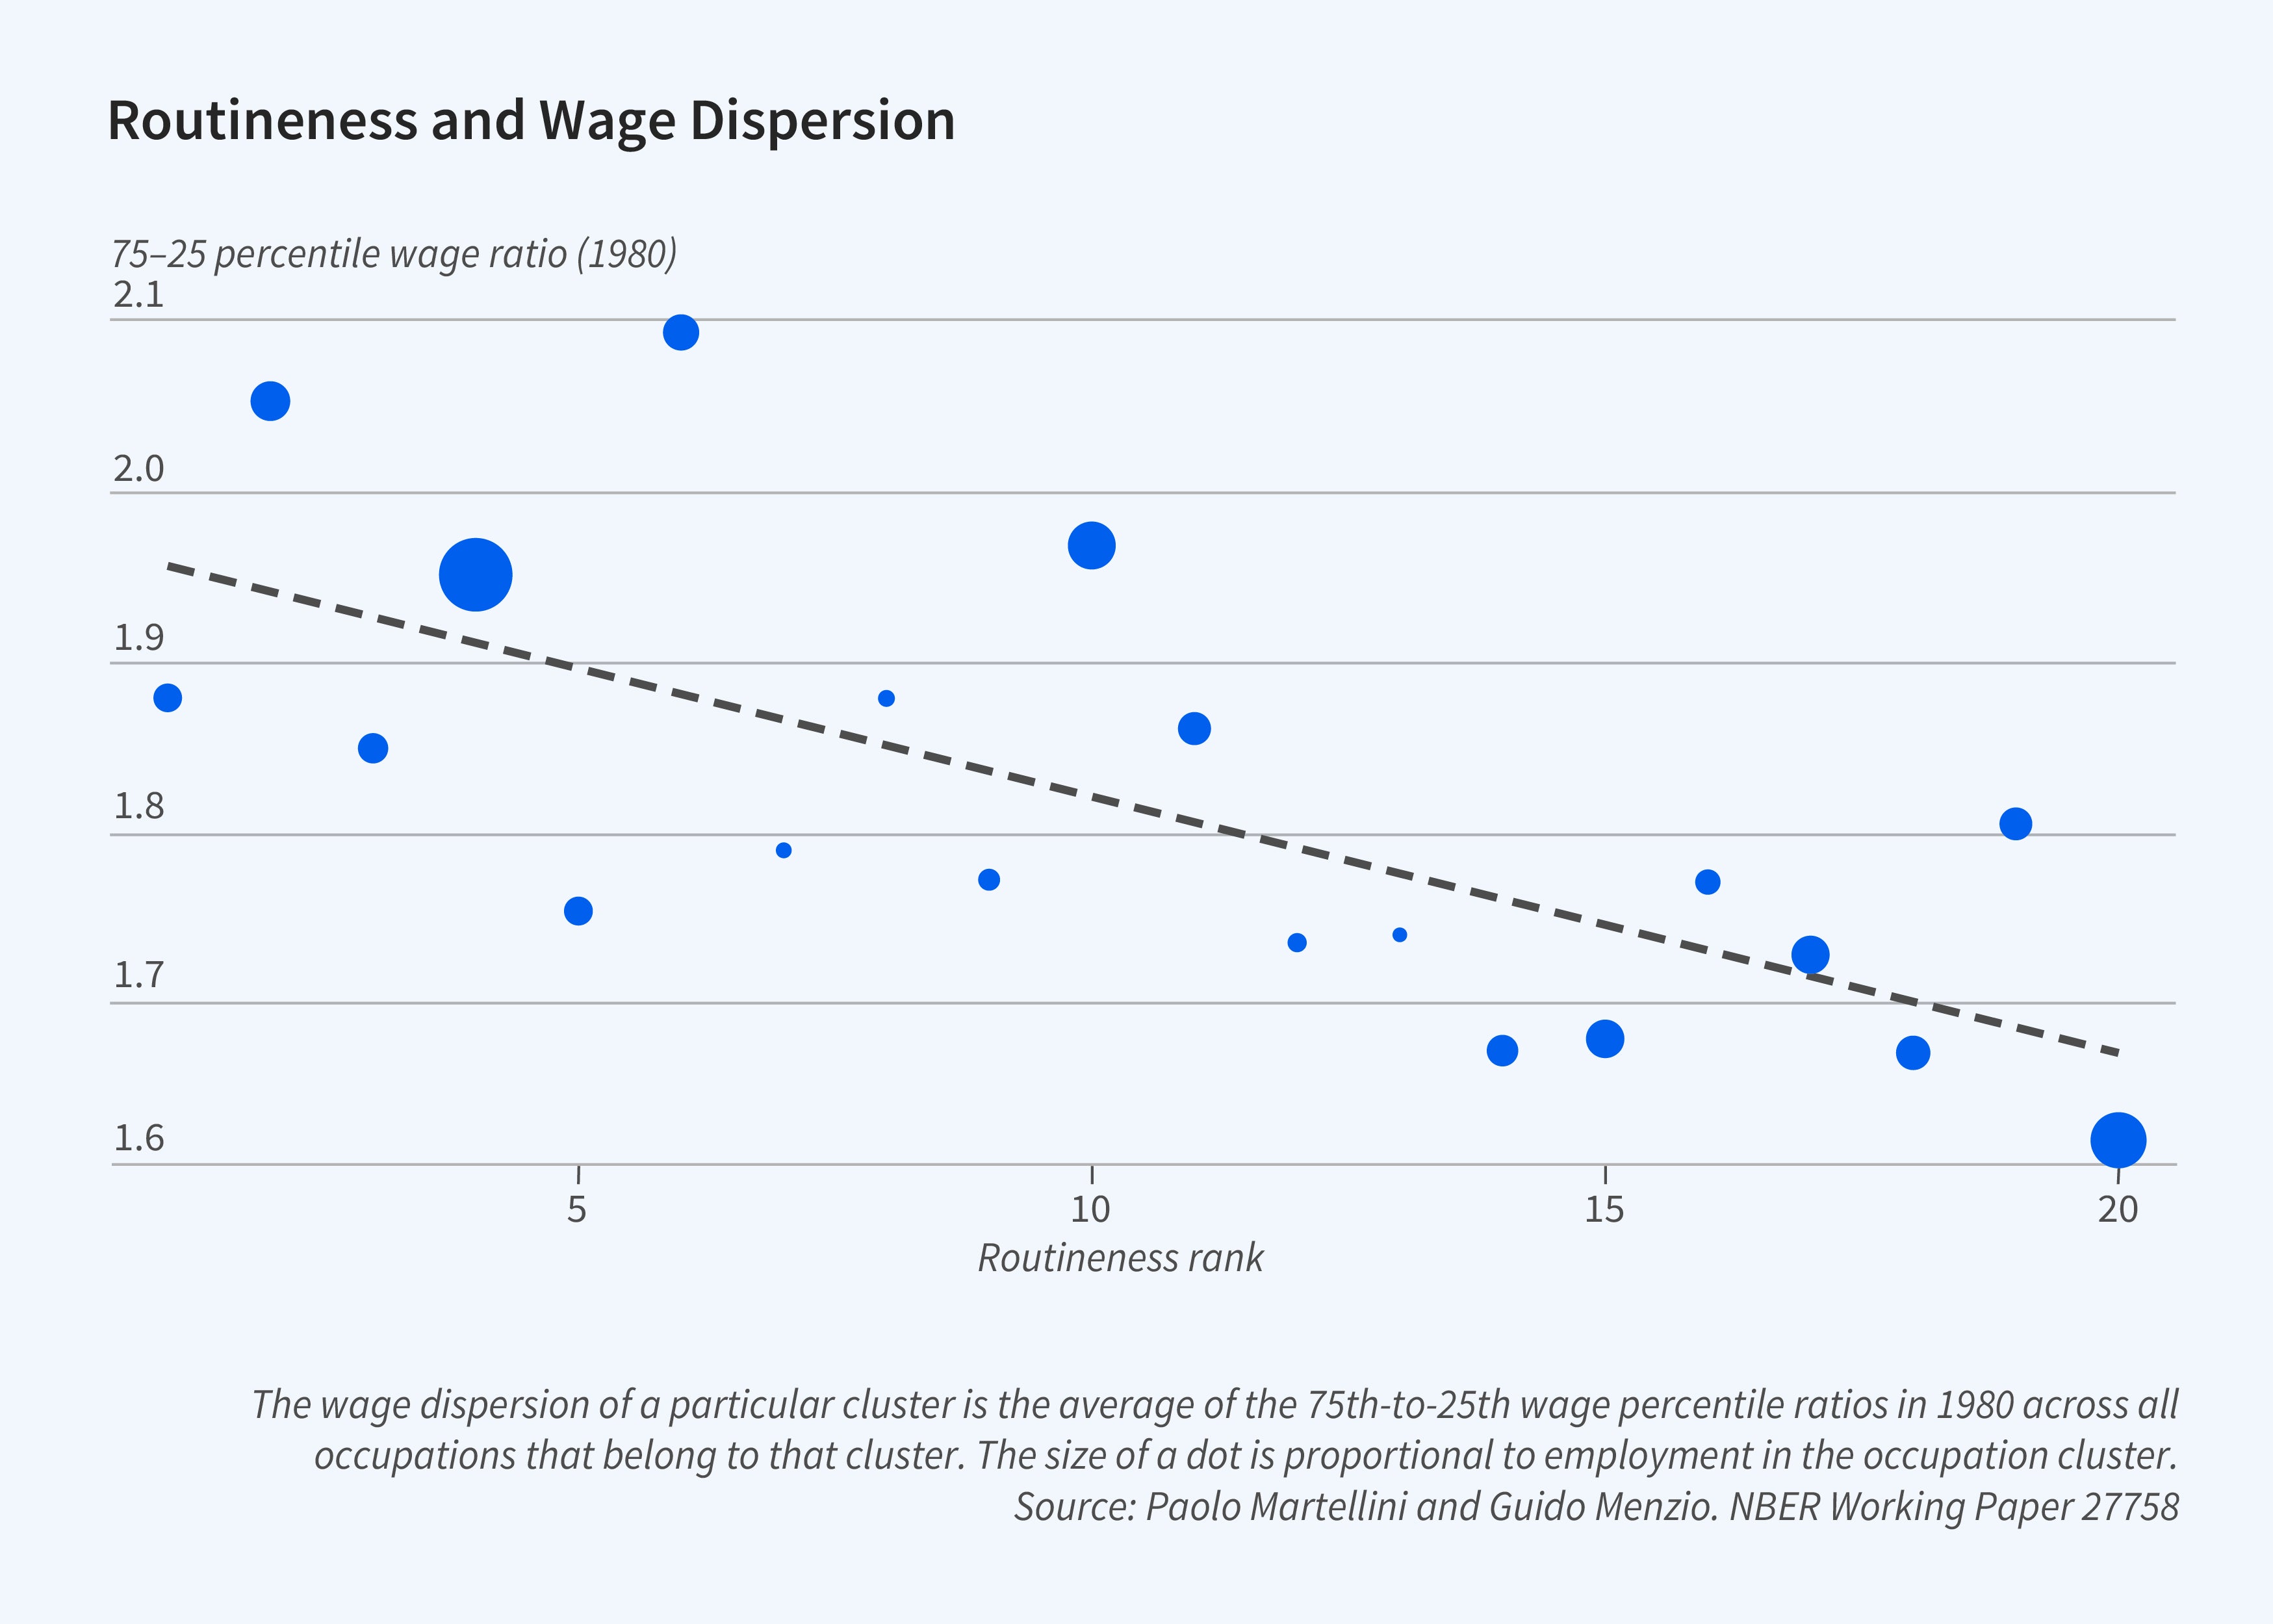
In follow-up research, Martellini and I try to measure the extent to which Stiglerian growth has unequal effects across different workers.3 The aggregate return to declining search frictions depends on the extent to which, on average, the productivity of an individual worker varies across different jobs. If the heterogeneity in a worker’s productivity in different jobs varies systematically across different subgroups of workers, the return to declining search frictions will also vary across groups. The growth rates of productivity and wages will also vary. For workers who are equally productive across many different jobs, who we call “jacks of all trades,” the return to additional job search is minimal and so are the productivity and wage gains from declining search frictions. For workers whose productivity is very different in different jobs, “masters of one trade,” the return to search is large and so are the productivity and wage gains from declining search frictions. We similarly classify occupations based on the tasks that workers in them must perform. We assume that workers in routine occupations — where the same tasks are performed over and over again, for example by retail clerks or machine operators — are more likely to be jacks of all trades. We correspondingly assume that workers in nonroutine occupations are more likely to be masters of one trade, since the nature of their tasks may vary significantly from job to job.
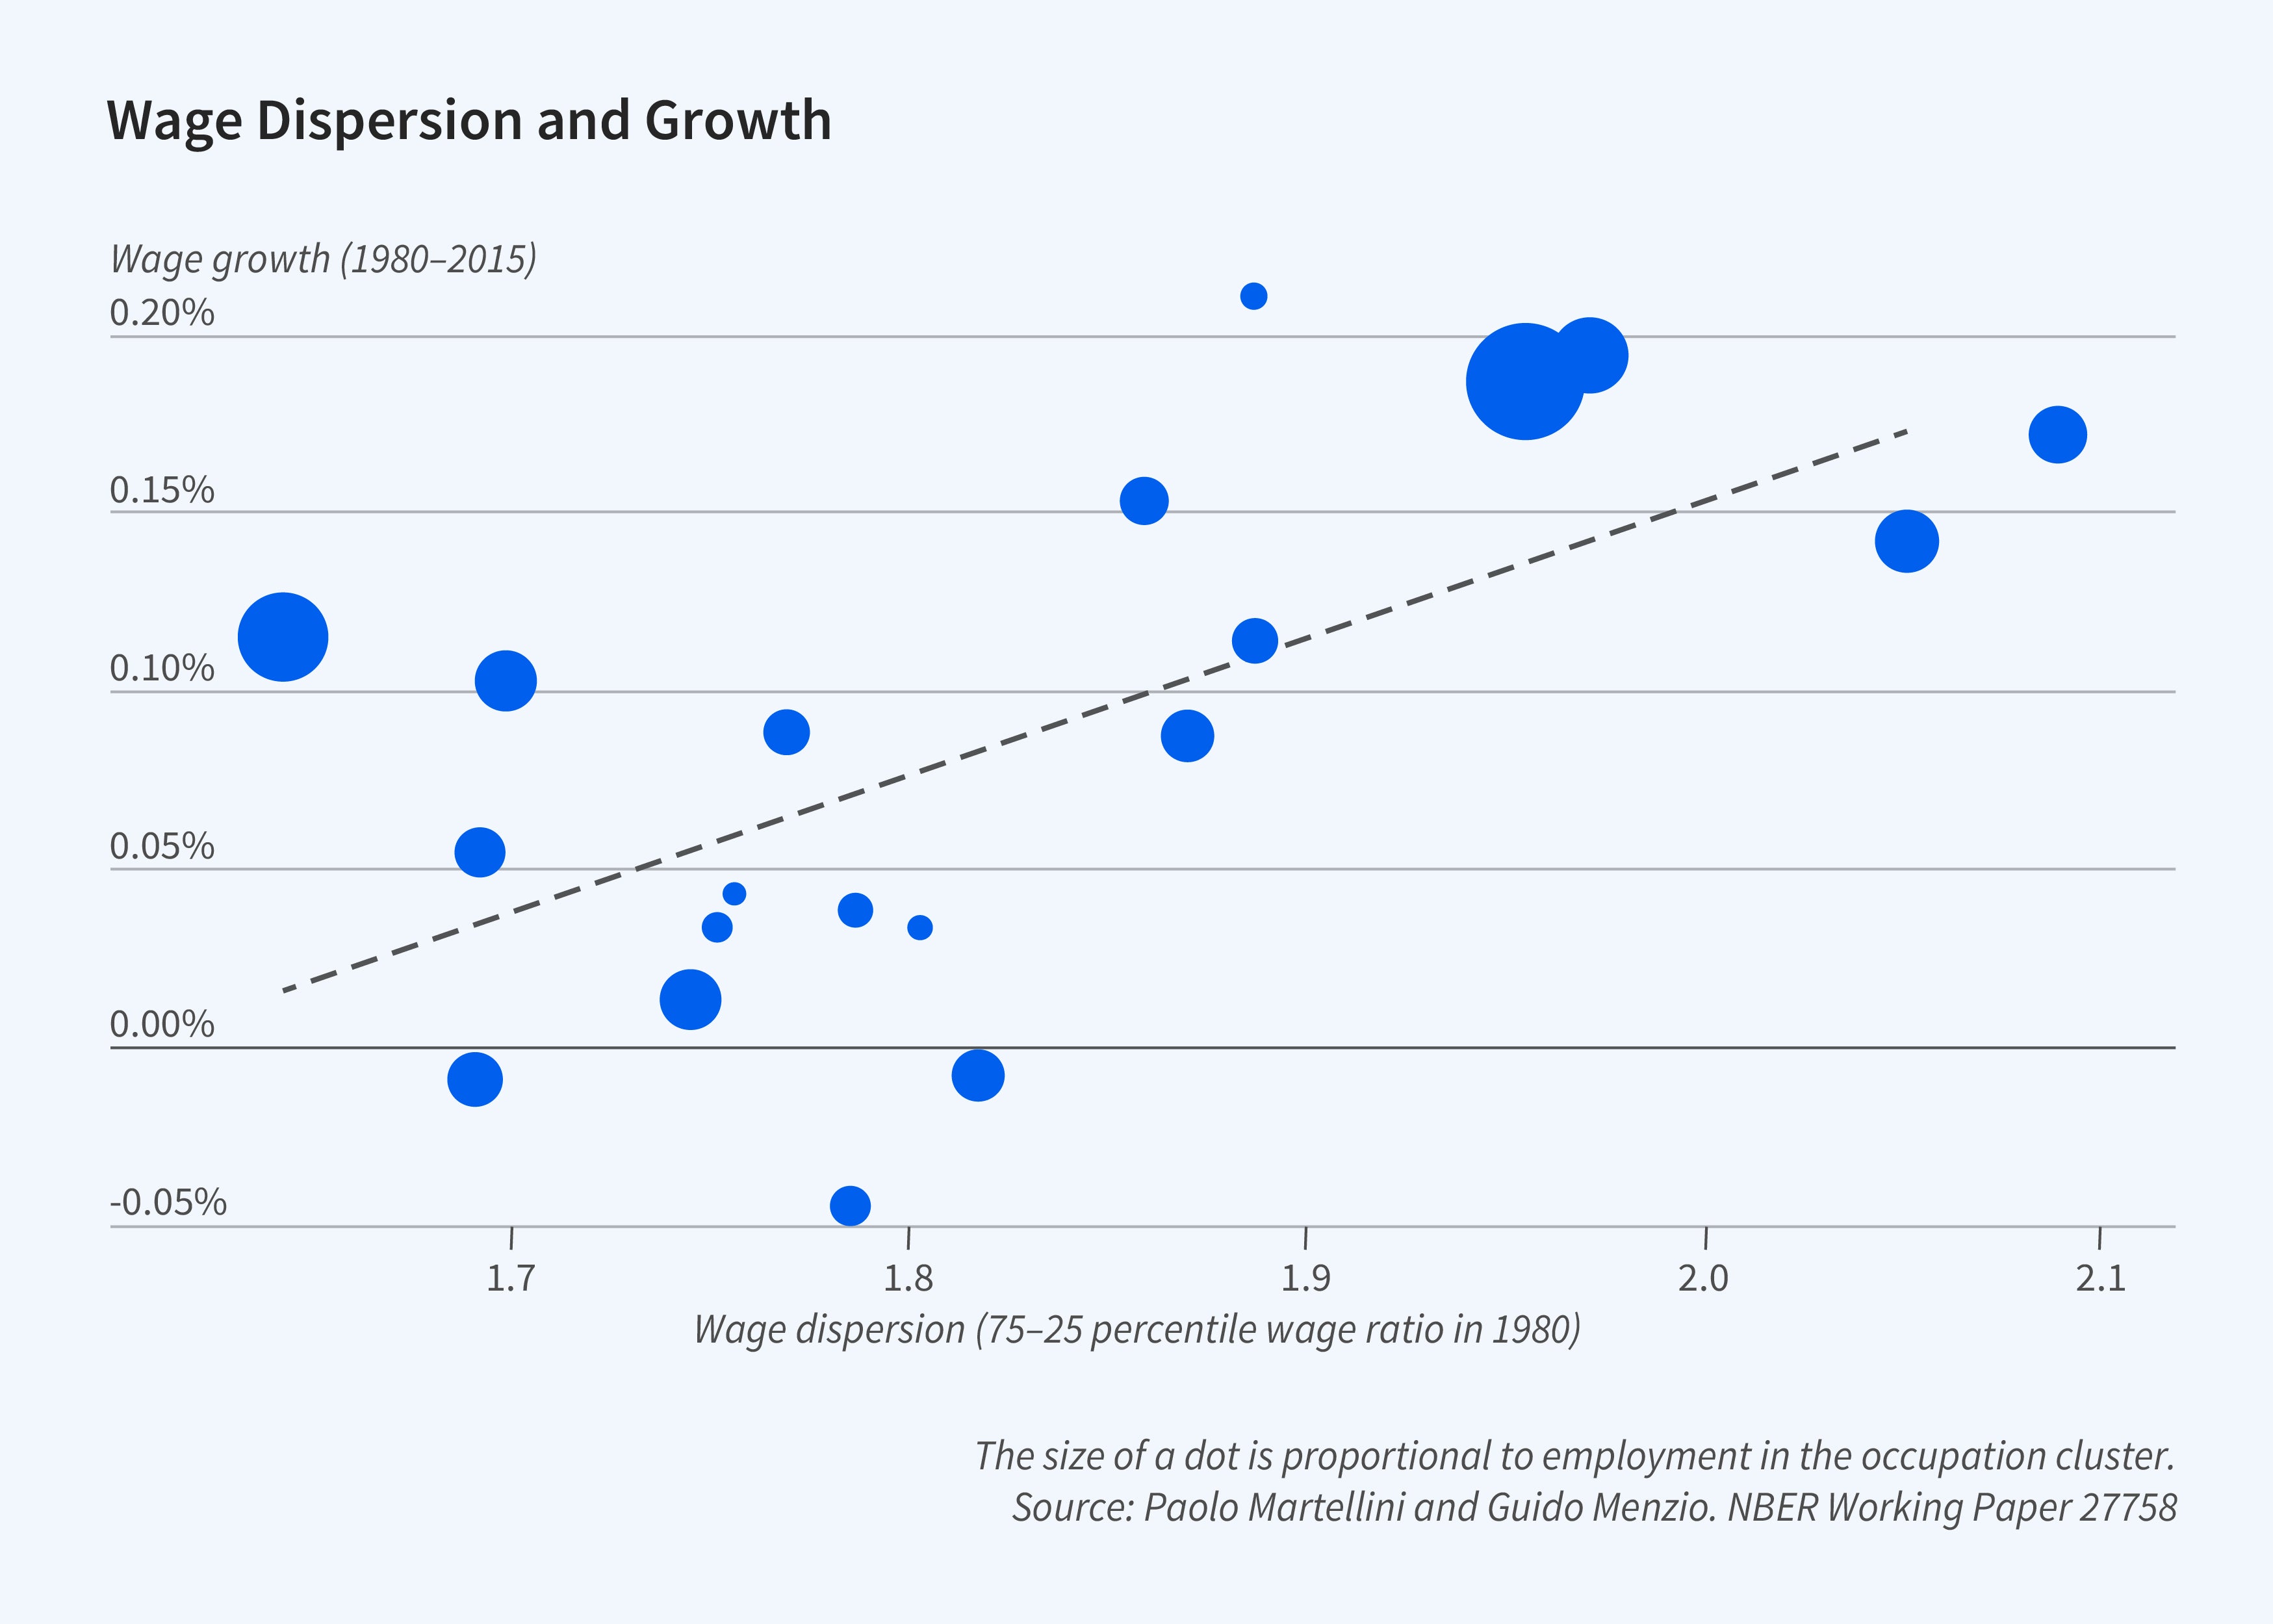
We sort occupations into bins based on their degree of routine. Figure 4 plots the average ratio of the 75th percentile wage to the 25th percentile wage in the 1980 cross-sectional distribution of wages for occupations with different degrees of routine. There is a clear negative relationship between the degree of routine in an occupation and its wage dispersion, which corroborates the presumption that the productivity of a worker in a routine occupation is less heterogeneous across jobs than the productivity of a worker in a nonroutine one. Figure 5 plots an occupation’s 75-25 percentile ratio in 1980 and the growth rate of wages between 1980 and 2015 for occupations in different bins. There is a clear positive relation between an occupation’s wage dispersion and the growth of wages in that occupation. Since an occupation’s degree of routine is related to its wage dispersion, this finding is consistent with the prediction of Stiglerian growth: the return to declining search frictions positively depends on the extent of heterogeneity in a worker’s productivity across different jobs. Naturally, not all the difference in wage growth between routine and nonroutine occupations is due to unequal returns to declining search frictions. Back-of-the-envelope calculations suggest that about 30 percent is.
Stiglerian Growth in the Product Market
My recent work seeks to understand the implications of declining search frictions for price dispersion, competition, and growth in product markets.4 In the context of a product market, search frictions mean that buyers cannot purchase from just any seller, but only from those with which they come into contact. With search frictions, there is price dispersion in equilibrium. Buyers cannot eliminate price dispersion through arbitrage because they are not in contact with all of the sellers. Sellers post different prices because mass points in the price distribution create opportunities to increase profits. As search frictions decline, the market becomes more competitive: sellers post lower prices, price dispersion declines, and buyers capture an increasing share of the gains from trade. As search frictions vanish, sellers post prices equal to marginal cost, price dispersion disappears, and buyers capture all of the gains from trade. These are the predictions of the canonical search-theoretic model of the product market of Gerard Butters,5 Hal Varian,6 and Kenneth Burdett and Kenneth Judd.7
From the perspective of the model, it is puzzling that improvements in ICT — which presumably made it easier for buyers to contact sellers — have not led to a noticeable decline in price dispersion. Indeed, the extent of price dispersion in the 1970s, in the 1990s, and in the 2000s is quite similar. Relatedly, price dispersion does not appear to be significantly lower in online than offline markets.
How can the search-theoretic model of the product market be reconciled with the empirical evidence? Suppose that sellers choose whether to design more or less specialized varieties of a product. Varieties that are more specialized appeal to a smaller fraction of buyers but, conditional on being appealing to a buyer, they provide higher value. Varieties that are less specialized appeal to a larger fraction of buyers but, conditional on being appealing to a buyer, they provide lower value. Buyers contact a number of randomly selected sellers. This number is assumed to be drawn from a Poisson distribution with a mean that grows over time, reflecting declining search frictions. Declining search frictions once again have countervailing effects on the extent of market competition. On the one hand, they allow buyers to contact more sellers. This effect tends to make the market more competitive. On the other hand, declining search frictions imply that sellers meet more potential buyers and, for this reason, they find it optimal to design more specialized product varieties. This tends to make the market less competitive, as it reduces the probability that a buyer finds a particular seller’s variety appealing. Under some conditions, the two effects offset each other. More specifically, there exists a balanced growth path along which the shares of the gains from trade accruing to buyers and sellers and the extent of price dispersion remain constant in the face of declining search frictions.
A version of the search-theoretic product market model in which sellers can decide to horizontally differentiate explains why price dispersion has not been trending down. The same version of the model implies that declining search frictions generate economic growth. In fact, along the balanced growth path, declining search frictions raise buyers’ gains from trade, sellers’ gains from trade, and welfare at the rate which is proportional to the elasticity of the buyers’ utility with respect to the degree of specialization of a variety of the product that the buyer finds appealing. Intuitively, declining search frictions increase welfare because they allow sellers to design varieties of the product that are more precisely tailored to the heterogeneous preferences of different buyers. As in the labor market, the return to lower search frictions, and hence Stiglerian growth, leverages heterogeneity. In the labor market, the relevant notion of heterogeneity is the extent to which the productivity of an individual worker varies across different jobs. In the product market, the relevant notion is the extent to which buyers differ in their valuation of a particular product variety.
In follow-up work, James Albrecht, Susan Vroman, and I examine the effect of declining search frictions on competition and growth in a version of the search-theoretic model of the product market in which sellers can decide to vertically differentiate.8 Buyers have identical preferences. Sellers invest in the quality and variety of their products. Now, in contrast to the search-theoretic model with horizontal differentiation, declining search frictions make sales more concentrated and quality more dispersed. Intuitively, as search frictions decline, buyers’ set of choices grow, high-quality sellers trade with more buyers, and low-quality sellers trade with fewer. Since high-quality sellers trade more, they choose to invest more in quality, while low-quality sellers trade less and disinvest in quality. Price dispersion may actually increase.
As in the version of the model with horizontal differentiation, declining search frictions generate economic growth, but for different reasons. Declining search frictions make the gains from trade accruing to buyers and to sellers as well as total welfare grow at a rate that depends on the rate at which frictions decline and the elasticity of the sellers’ product design cost with respect to quality. With horizontal differentiation, declining search friction leads to growth by leveraging the heterogeneity in the preferences of different buyers. With vertical differentiation, it leads to growth by leveraging increasing returns to scale. Returns to scale are increasing because a seller’s cost of designing a product variety is a fixed cost. Search frictions constrain the reach of a seller and limit the extent to which increasing returns can be realized. As search frictions decline, the reach of a seller grows, which unlocks the power of increasing returns.
Endnotes
“Information in the Labor Market,” Stigler G. Journal of Political Economy 70(5) part 2, October 1962, pp. 94–105.
"Declining Search Frictions, Unemployment, and Growth,” Martellini P, Menzio G. NBER Working Paper 24518, April 2018, and Journal of Political Economy 128(12), December 2020, pp. 4387–4437.
“Jacks of All Trades and Masters of One: Declining Search Frictions and Unequal Growth,” Martellini P, Menzio G. NBER Working Paper 27758, August 2020, and American Economic Review: Insights 3(3), September 2021, pp. 339–352.
“Optimal Product Design: Implications for Competition and Growth under Declining Search Frictions,” Menzio G. NBER Working Paper 28638, April 2021, and Econometrica 91(2), March 2023, pp. 605–639.
“Equilibrium Distributions of Sales and Advertising Prices,” Butters G. Review of Economic Studies 44(3), October 1977, pp. 465–491.
“A Model of Sales,” Varian H. American Economic Review 70(4), September 1980, pp. 651–659.
“Equilibrium Price Dispersion,” Burdett K, Judd KL. Econometrica 51(4), July 1983, pp. 955–969.
“Vertical Differentiation in Frictional Product Markets,” Albrecht J, Menzio G, Vroman S. NBER Working Paper 29618, January 2022, and forthcoming in the Journal of Political Economy: Macroeconomics.


