The COVID-19 Pandemic and Challenges Facing State and Local Governments
Economic crises bring questions about the design and implications of fiscal systems to the forefront. In the United States, state and local governments employ roughly one in seven workers and spend an amount equivalent to one-fifth of GDP. Because many of these entities operate with balanced budget requirements, downturns create pressure because declines in revenue coincide with a rise in demand for public services. These pressures come with some urgency, as state and local governments play roles in the administration and financing of safety net programs, the delivery of public health services, and the provision of public transit and education.
At the outset of the COVID-19 pandemic, concerns over the budgetary health and service performance of state and local governments were top of federal policymakers’ minds. This was driven in part by the experience of the Great Recession, after which the state and local public sectors were widely perceived as a drag on the broader economy. In an effort to avoid a repeat of this, federal policymakers legislated close to $1 trillion in fiscal assistance to state and local governments, substantially exceeding the roughly $225 billion in fiscal assistance appropriated during the Great Recession through the American Recovery and Reinvestment Act (ARRA).
Three distinct sets of questions relate to the design of federal fiscal assistance. One involves the design of formulas through which the assistance is delivered. Another addresses the macroeconomic impacts of federal fiscal assistance, an issue on which research blossomed following the Great Recession. A third set relates to the core functions of state and local governments: how was fiscal assistance deployed and what impacts did it have on outcomes under the purview of public health officials, safety net program administrators, school districts, and other government agencies?
The Stabilization Problem
At the pandemic’s outset, Stan Veuger and I projected the potential effects of the pandemic on the revenues of state and local governments, as did a number of independent research teams.1 An objective of our work was to inform policymakers regarding the amount of aid that might be justified on revenue stabilization grounds. We illustrated how the Congressional Budget Office’s (CBO’s) early-pandemic forecasts for personal income and personal consumption expenditures could be used as forecasts of the evolution of state and local tax bases. Multiplied by historical estimates of the elasticity of revenues with respect to fluctuations in tax bases, CBO’s forecasts of declines in economic activity could be translated into forecasts of revenue shortfalls.
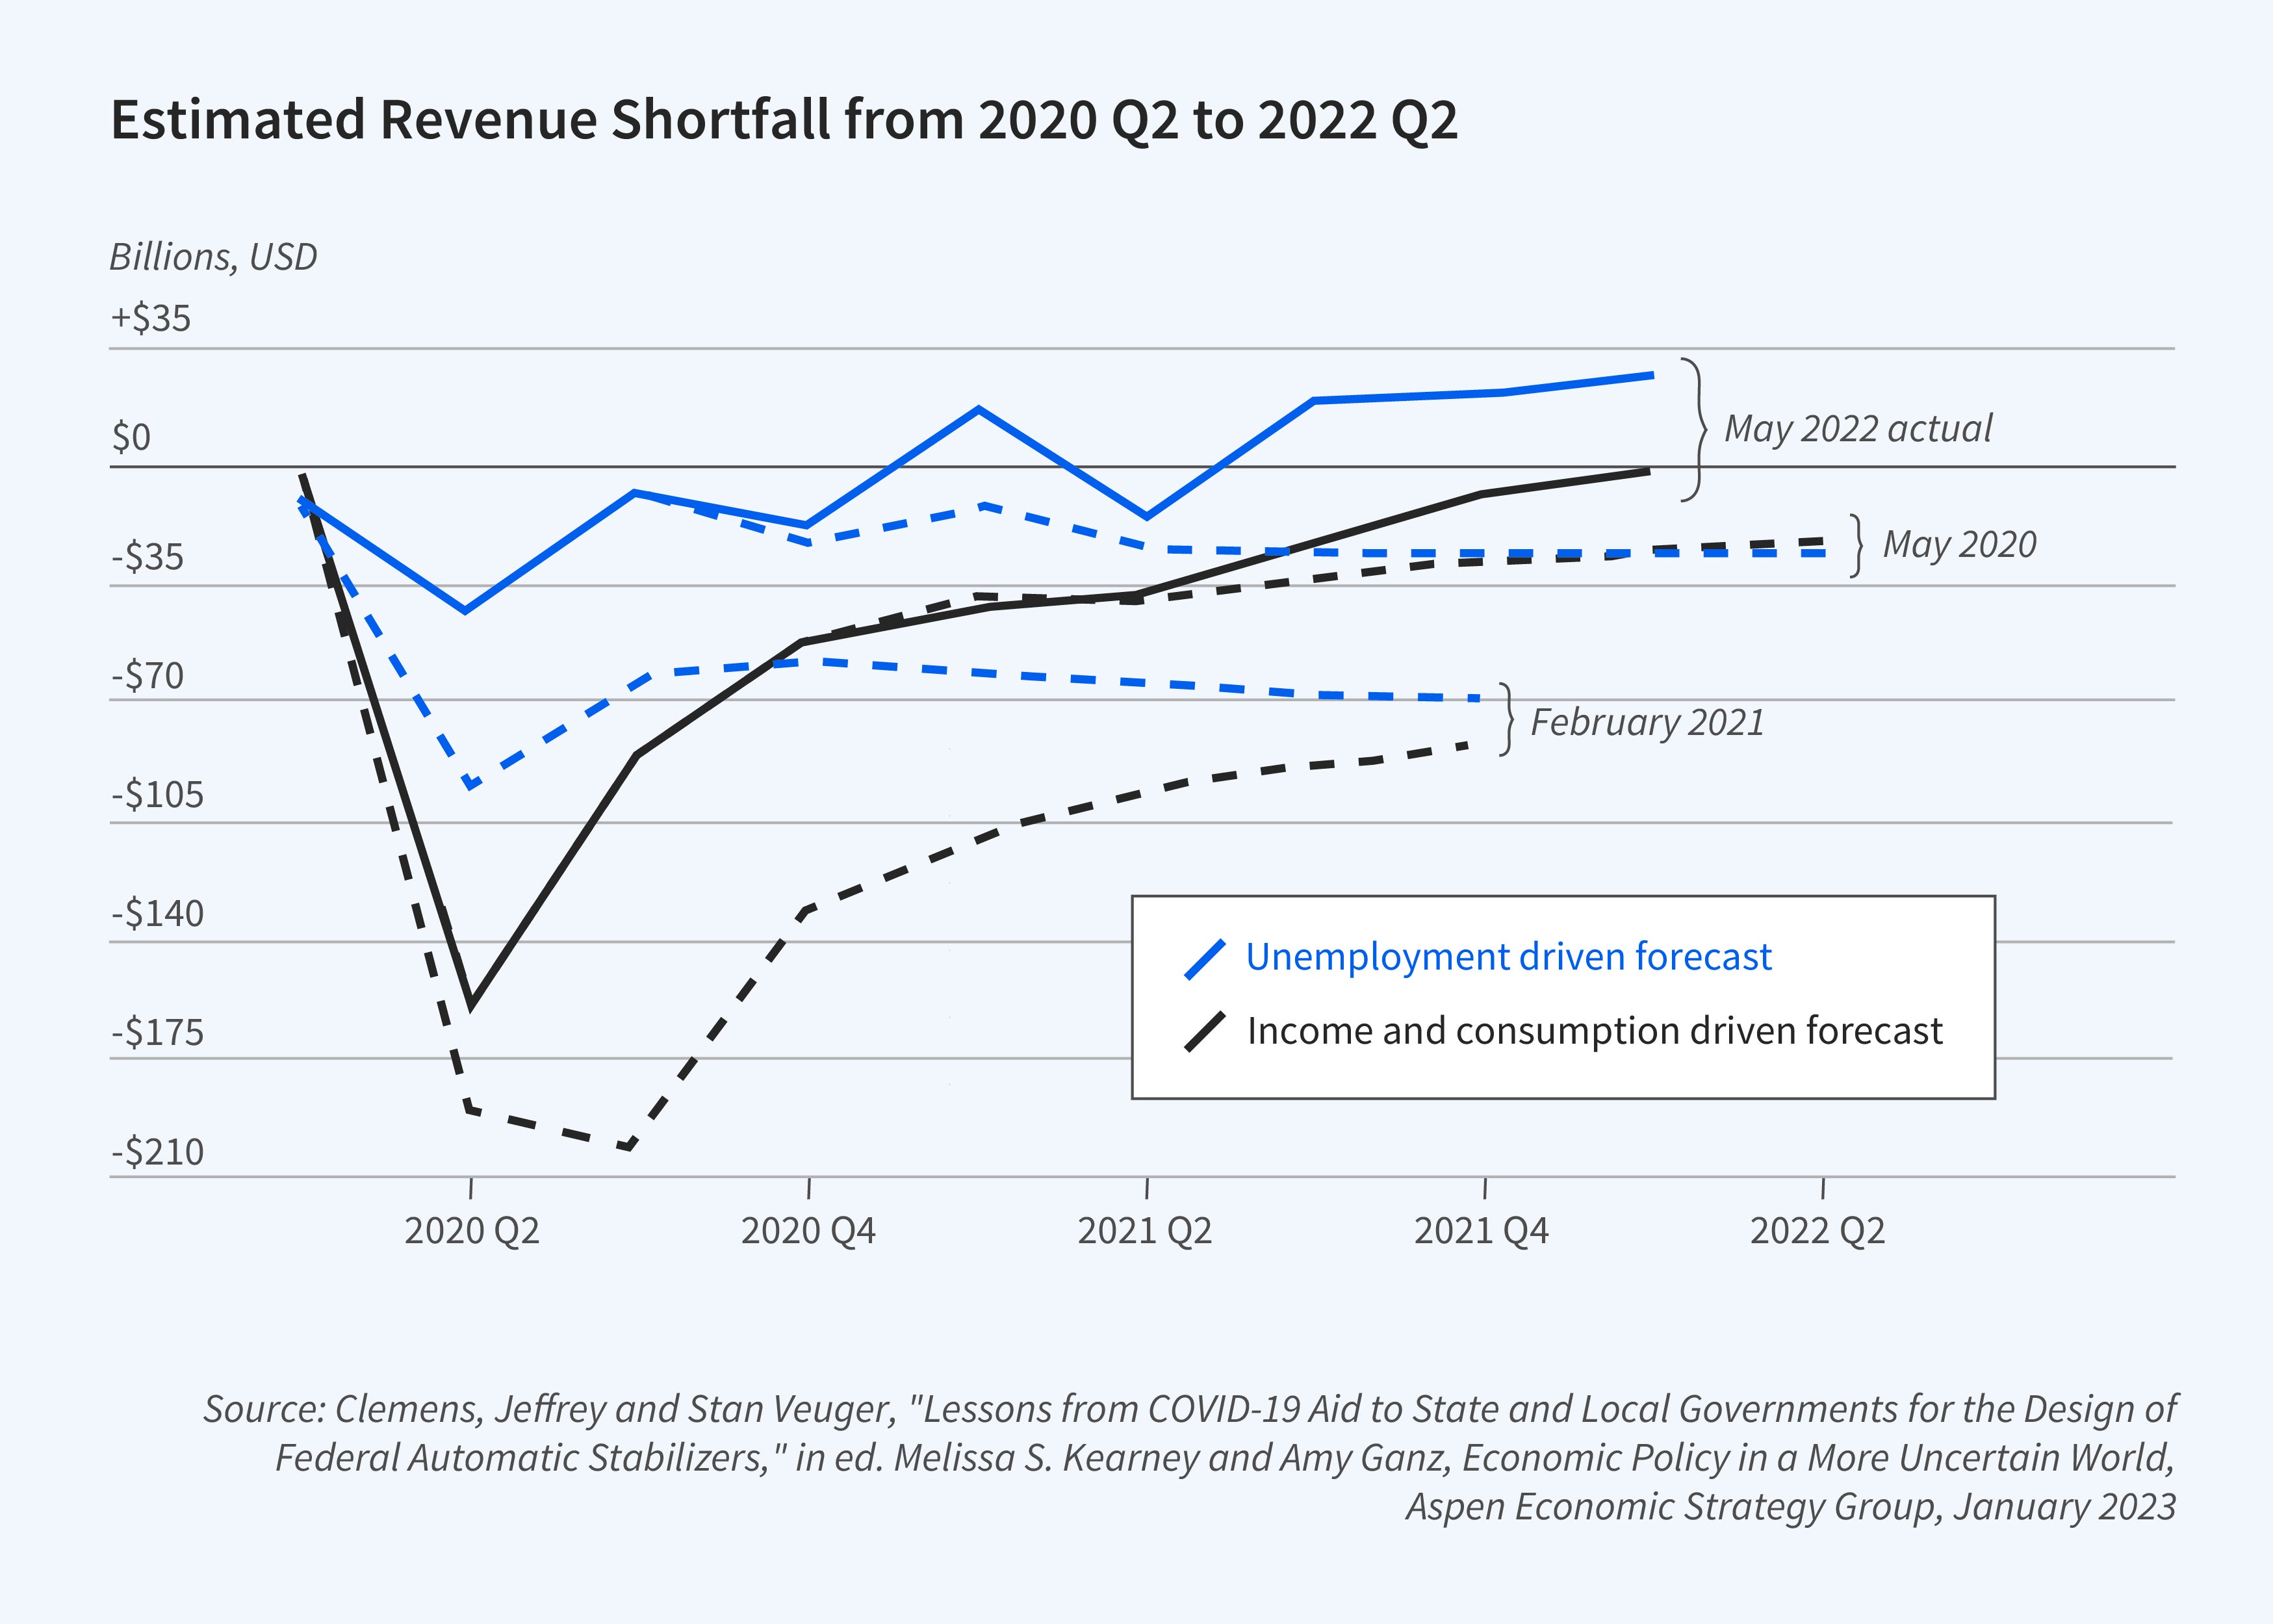
As Veuger and I explained later, two lessons emerged from our analysis.2 First, in a predictive sense, revenue forecasts tended to perform better when they relied on close rather than distant proxies for state and local governments’ tax bases. At the COVID-19 pandemic’s onset, forecasts that relied on the historical relationship between revenues and states’ unemployment rates produced relatively inaccurate predictions. This is illustrated in Figure 1, which shows one set of projections, by Timothy Bartik of the Upjohn Institute,3 that relied on forecasts of the unemployment rate, and another, by Veuger and me, that was based on projections of aggregate income and consumption. Because realized revenues would ultimately — and, to be clear, surprisingly — exceed prepandemic forecasts, larger shortfall forecasts were less accurate than smaller shortfall forecasts.4 Forecasts that relied on disaggregated consumption and income data performed even better.5 The shift in consumption towards goods and away from services led sales tax revenues to be more robust than most analysts expected. Predictions based on forecasts of disaggregated consumption data thus performed better than predictions based on forecasts of aggregate data.
Second, revenue forecasts suffered from a reliance on forecasts of economic activity that, in CBO’s tradition, reflected “current law.” Consequently, the associated forecasts for the evolution of states’ tax bases did not account for the effects of not-yet-passed pandemic-related aid for households and businesses. As a result, the forecasts of revenue shortfalls were based on a conceptual error of viewing revenue shortfalls and household and business financial stress as separate rather than interconnected phenomena.
The pandemic experience raises interesting questions about the tradeoffs associated with assistance distributed through pre-designed automatic stabilizers versus assistance delivered through ad hoc legislation. On the one hand, the use of automatic stabilizers enables aid to adjust seamlessly in response to economic conditions. This makes either over- or undershooting less likely and eases the pressure to legislate large-scale aid provisions in the midst of a crisis. On the other hand, ad hoc assistance packages might be better suited for targeting states in greatest need, since plans can be drawn up in response to events on the ground.
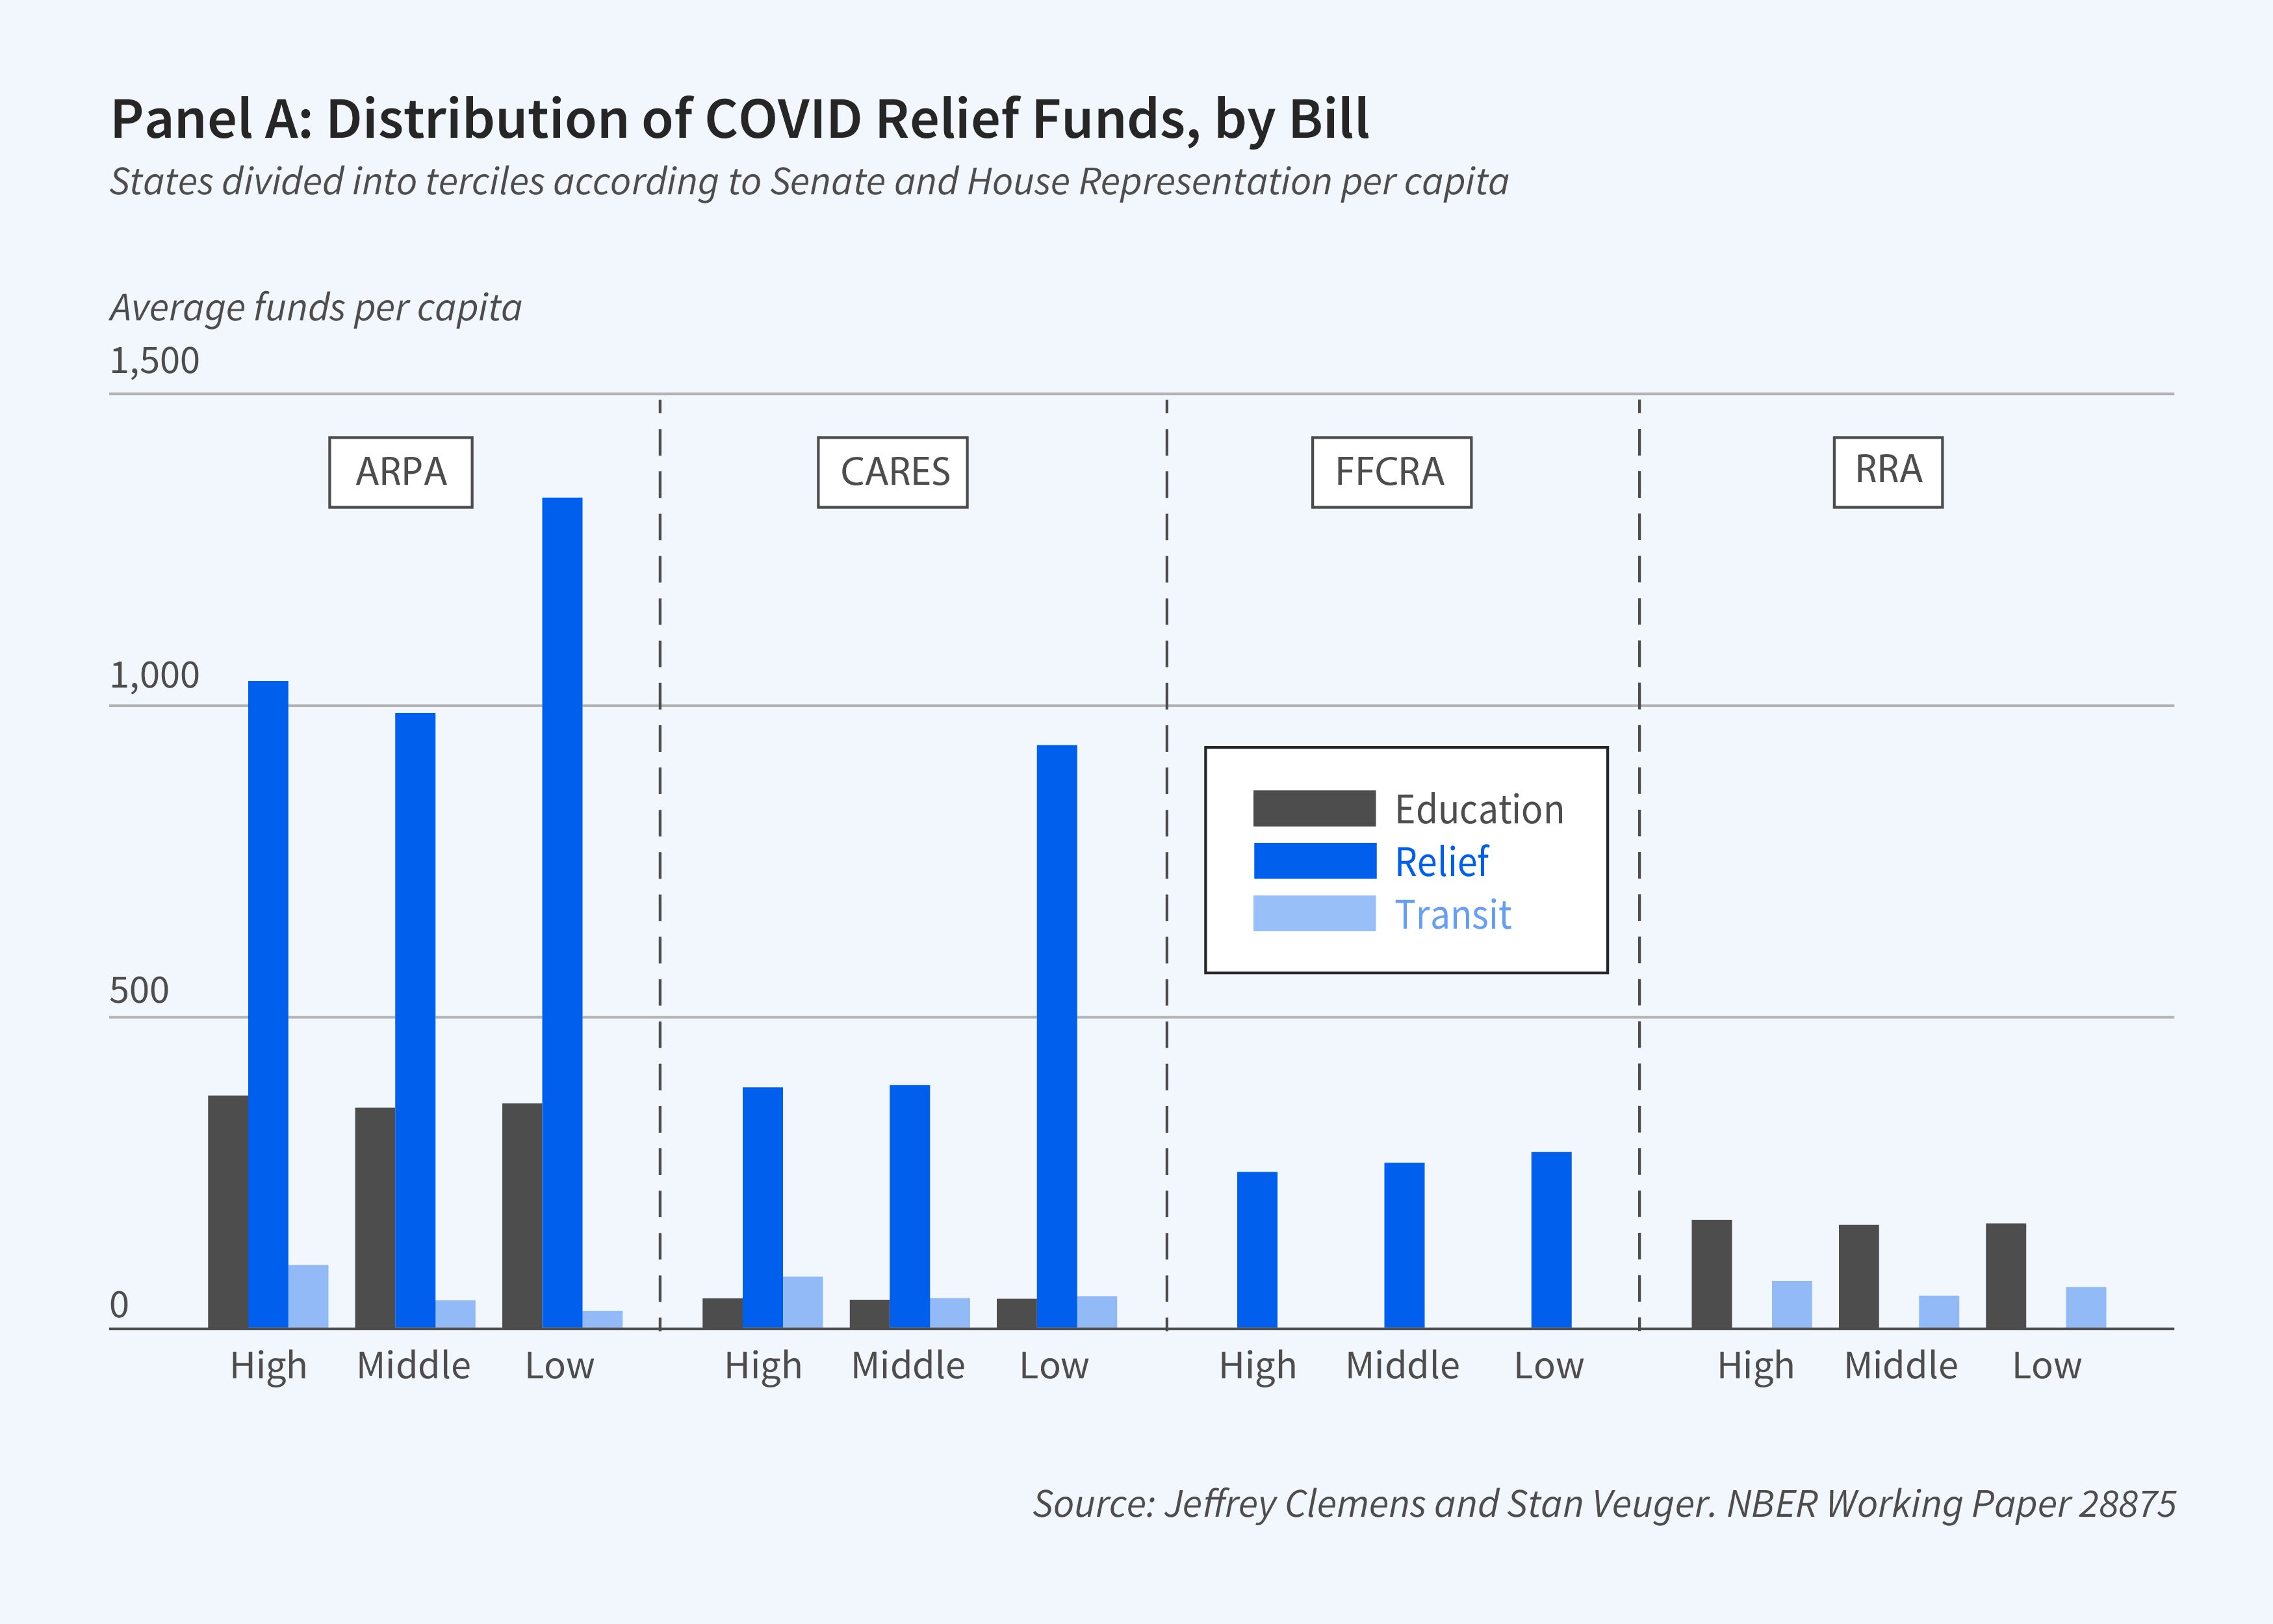
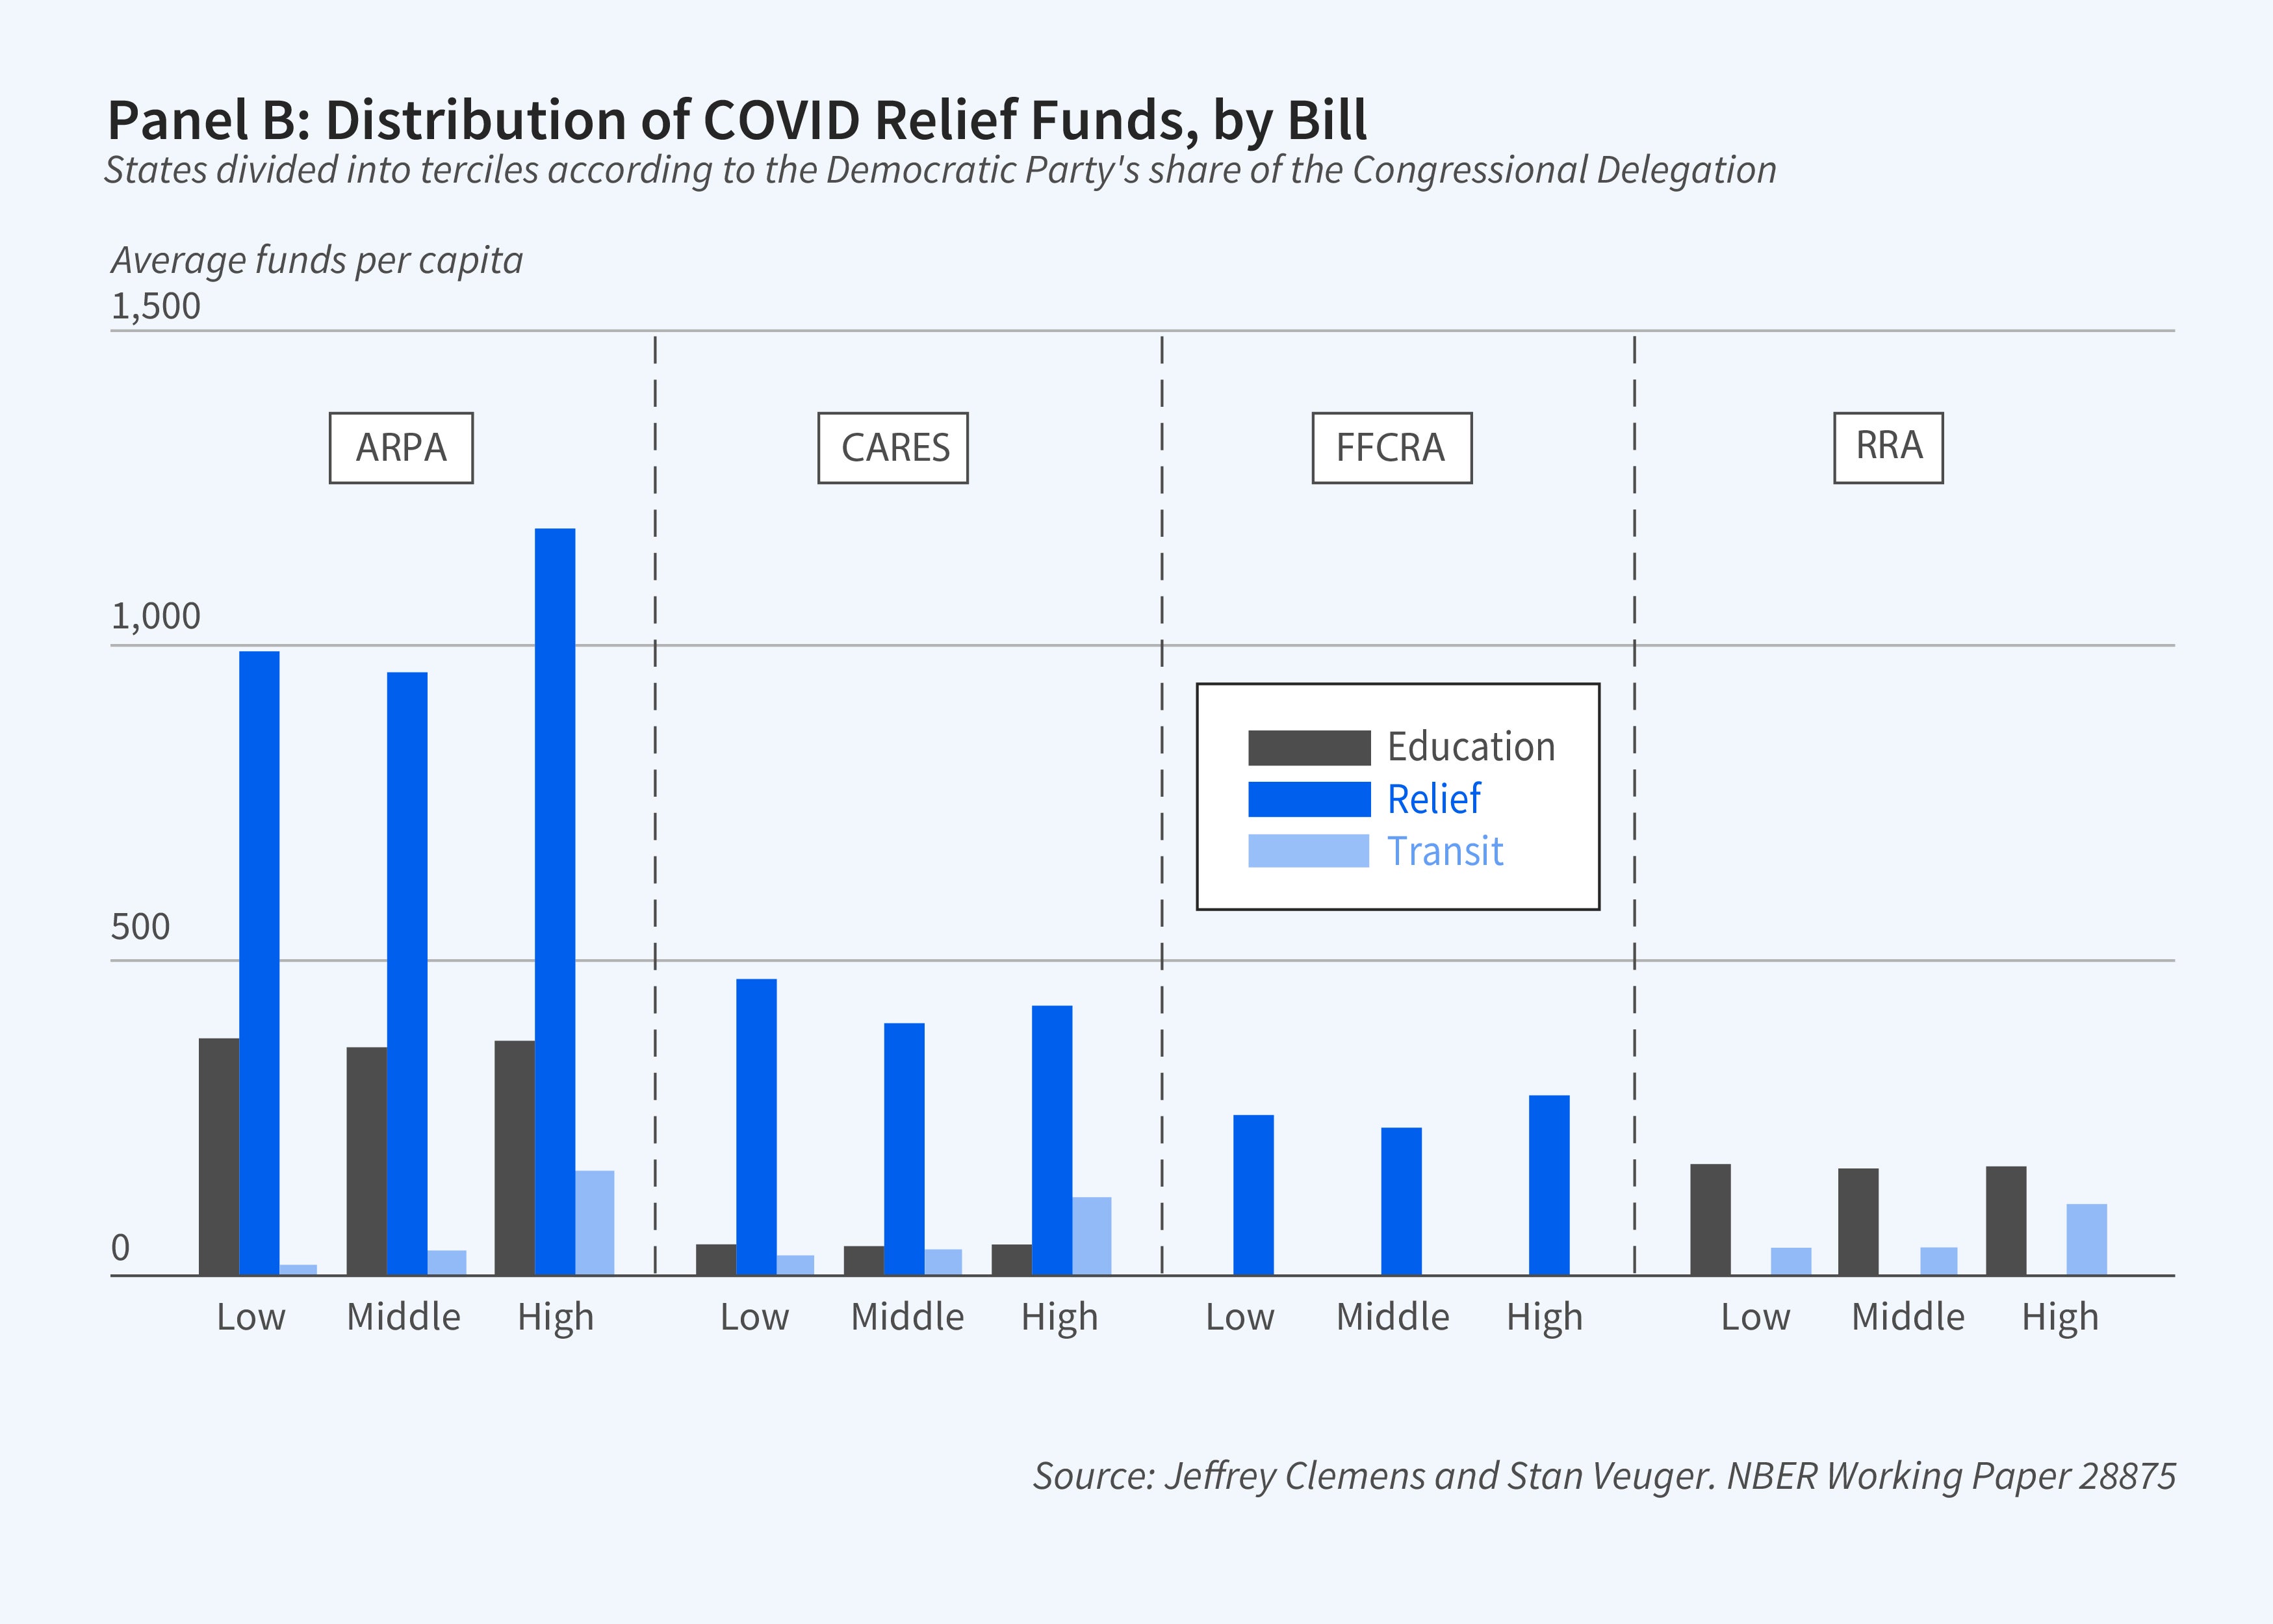
Veuger and I also examined the design of the specific formulas through which aid is dispensed. In one study, we explored the predictors of variations in per capita aid distributions across states.6 Two interesting results emerged from this analysis, both of which connect aid distributions to variations in political representation. First, small states, which enjoy disproportionate representation in the Senate, received much larger per capita aid distributions than their midsize and large state counterparts. This “small-state bias” is illustrated in Panel A of Figure 2. At the extremes, the smallest, most overrepresented states enjoyed allocations in excess of $3,000 per capita larger than the largest and least represented states. Second, the transition from divided government to unified Democratic control in January 2021 mattered. Consistent with a role for this political shift, the formulas adopted for distributing general fiscal assistance and transportation grants became more favorable to Democratic-leaning states, as illustrated in Panel B of Figure 2. Education aid, by contrast, does not appear to have been reshuffled in a way that correlates with state-level partisanship.
In a second paper on the design of fiscal assistance formulas, Veuger, Benedic Ippolito, and I consider the prominent role of the Medicaid program in the design of fiscal assistance packages.7 During each of the last three recessions, Congress has legislated aid to state governments in part by increasing the Federal Medical Assistance Percentage (FMAP) — the share of Medicaid expenditures reimbursed by the federal government. Such provisions distribute greater aid to states with higher baseline levels of Medicaid spending. It is of interest to know whether this aid targets states that experienced larger shocks to their Medicaid spending needs, rather than simply their baseline spending levels. On this first point, we found that changes in Medicaid enrollment through September 2020 were weakly correlated with the relief funds states received. Second, the Coronavirus Aid, Relief, and Economic Security Act linked the increase in states’ FMAPs to their compliance with a requirement known as the continuous coverage provision. It prevented states from terminating benefits for Medicaid beneficiaries whose incomes rose beyond applicable eligibility thresholds. Congress removed the link between this provision and the availability of pandemic support funds in late 2022, and some states have now dropped it. We found that the projected costs of the continuous coverage requirement and the projected revenues linked to the enhancement of the FMAP were of similar magnitudes, making the net implications of these provisions for state budgets roughly neutral based on forecasts that were available when we conducted our analysis.
Effects of Fiscal Assistance on Macroeconomic Outcomes
Macroeconomic recovery, the preservation of employment, and the delivery of vital health and educational services were the primary stated goals of the federal government’s fiscal assistance to state and local governments during the pandemic. What impact did federal fiscal assistance have on these outcomes in practice?
The key challenge to estimating the effects of fiscal stabilization funds is a standard endogeneity concern: stabilization efforts tend to target areas where conditions are poor, and therefore correlate negatively with economic activity. To overcome this source of bias, Philip Hoxie, Veuger, and I study the macroeconomic effects of pandemic fiscal assistance using an instrumental variables strategy.8 Veuger’s and my earlier work on the relationship between per capita aid distributions and political representation examined whether the large distributions of aid to small states could be explained by other factors. We found that factors including estimated state-level revenue shortfalls, the severity of the threat to public health, or other proxies for funding needs are only weakly correlated with variations in political representation. These findings support the use of the outsize aid distributions received by comparatively high-representation states as a form of natural experiment.
Using the variations in aid predicted by variations in political representation as a source of quasi-experimental variation, Hoxie, Veuger, and I analyzed the effects of fiscal assistance on employment and other macroeconomic outcomes. We estimated that the federal government allocated $855,000 for each state or local government job-year preserved, with plausible estimates ranging from $400,000 to $1.3 million. Further, we found little evidence for spillovers to either the broader labor market or to macroeconomic indicators including output and income. In a companion paper, John Kearns, Beatrice Lee, Veuger, and I found little evidence that pandemic fiscal assistance raised economic activity through spillovers that extended across state lines.9
The estimated effects of fiscal assistance on economic activity and employment are modest when compared to the estimated effects of similar programs during the Great Recession. Studies of the ARRA of 2009 suggest an employment multiplier ranging between $50,000 and $112,000 per job-year.10 Our estimates of the cost per job-year also exceed estimates from analyses of the Paycheck Protection Program.11 Furthermore, we find no effect on aggregate income, and cannot reject an output multiplier of zero for this spending, while estimates of the multiplier from previous periods dating back to the 1930s range from $0.50 to $2 in overall economic activity per dollar of government spending.12
More work on how pandemic fiscal assistance affected macroeconomic outcomes is sorely needed. While macroeconomic research has illuminated a pandemic’s potential influence on both fiscal and monetary policy transmission mechanisms, direct evidence on the effects of pandemic-era fiscal assistance packages is limited.13 In the wake of the Great Recession, by contrast, a wave of research on the stimulus impact of government spending exploited the rules that were used to allocate ARRA funds. Studies focused on variations in funding associated with Medicaid expenditures, highway assistance, and other assorted programs, arguing that the rules by which assistance was allocated were plausibly exogenous for the purpose of estimating jobs multipliers.14 Of course, the renaissance in fiscal policy research following the Great Recession extended well beyond studies of the ARRA.15 To date, few studies have considered the stimulus and jobs multipliers effects of pandemic fiscal assistance to state and local governments. Future research comparing the effects of pandemic and Great Recession-era fiscal assistance may have high returns, as the contrast between these episodes can help to shed further light on mechanisms through which fiscal assistance impacts economic activity.
Effects of Fiscal Assistance on Microeconomic Outcomes
One of the goals of policymakers designing pandemic-era fiscal assistance was the maintenance of education and public health services. The latter include the distribution of tests and vaccines and the collection of data describing the pandemic’s advance. Hoxie, Kearns, Veuger, and I analyzed whether states that received more generous allocations of fiscal assistance established more robust testing and vaccination campaigns.16 We estimated that fiscal assistance had at most a modest impact on the pace of vaccine rollouts, although it did have a substantial impact on the volume of tests administered. With respect to vaccines, these findings are consistent with the possibility that efforts to expand take-up of vaccines had reached their limit, making it difficult for additional federal funds to move the needle further. The demand for tests, by contrast, is less readily satiated, since tests deliver value with repeat rather than one-time use. Additional federal funds thus appear to have had room to expand the demand for and consumption of tests.
The data required to fully analyze the incidence of the pandemic fiscal relief packages on different spending programs and on tax revenues are not yet complete. For example, while data on school enrollments, staffing, and test scores well into the pandemic are now available, data on school district finances from the National Center for Education Statistics are processed with longer lags. Similarly, the Census Bureau’s Annual Survey of State and Local Government Finances was not updated to include 2020 data until July 2022. It will thus take time before the budgetary impacts of pandemic fiscal assistance can be more fully understood.
In contrast, data on major tax policy changes already exist. Veuger and I have found that larger fiscal relief allocations predict a lower likelihood of reductions in corporate tax rates, suggesting that fiscal assistance packages did not initiate a wave of corporate tax competition.17 Future analyses can explore the impact of pandemic fiscal assistance on a richer array of tax policy instruments, budgetary outcomes, educational attainment outcomes, and other outcomes linked to the core functions of state and local governments.
Endnotes
“Implications of the COVID-19 Pandemic for State Government Tax Revenues,” Clemens J, Veuger S. NBER Working Paper 27426, June 2020, and National Tax Journal 73(3), September 2020, pp. 619–644. “The COVID-19 Pandemic and the Revenues of State and Local Governments: An Update,” Clemens J, Veuger S. AEI Economic Perspectives, September 2020. “Estimates of State and Local Government Revenue Losses from Pandemic Mitigation,” Whitaker SD. Cleveland Fed District Data Brief, May 13, 2020, Federal Reserve Bank of Cleveland. “How Much Help Do State and Local Governments Need? Updated Estimates of Revenue Losses from Pandemic Mitigation,” Whitaker SD. Cleveland Fed District Data Brief, June 29, 2020. “Effects of COVID-19 on Federal, State, and Local Government Budgets,” Auerbach AJ, Gale WG, Lutz B, Sheiner L. Brookings Papers on Economic Activity COVID-19 and the Economy: Part Two, Fall 2020, pp. 229–270.
“Lessons from COVID-19 Aid to State and Local Governments for the Design of Federal Automatic Stabilizers,” Clemens J, Veuger S. Paper, Aspen Economic Strategy Group, January 9, 2023.
“An Updated Proposal for Timely, Responsive Federal Aid to State and Local Governments during the Pandemic Recession,” Bartik TJ. Research Highlights, W. E. Upjohn Institute for Employment Research, May 22, 2020.
“The Fiscal Survey of the States: An Update of State Fiscal Conditions,” Report, National Association of State Budget Officers, Fall 2021.
“How Much Help Do State and Local Governments Need? Updated Estimates of Revenue Losses from Pandemic Mitigation,” Whitaker SD. Cleveland Fed District Data Brief, June 29, 2020. “Effects of COVID-19 on Federal, State, and Local Government Budgets,” Auerbach AJ, Gale WG, Lutz B, Sheiner L. Brookings Papers on Economic Activity COVID-19 and the Economy: Part Two, Fall 2020, pp. 229–270.
“Politics and the Distribution of Federal Funds: Evidence from Federal Legislation in Response to COVID-19,” Clemens J, Veuger S. NBER Working Paper 28875, May 2021, and Journal of Public Economics 204, December 2021, 104554.
“Medicaid and Fiscal Federalism during the COVID-19 Pandemic,” Clemens J, Veuger S. NBER Working Paper 28670, April 2021, and Public Budgeting & Finance 41(4), Winter 2021, pp. 94–109.
“Was Pandemic Fiscal Relief Effective Fiscal Stimulus? Evidence from Aid to State and Local Governments,” Clemens J, Hoxie P, Veuger S. NBER Working Paper 30168, June 2022.
Spatial Spillovers and the Effects of Fiscal Stimulus: Evidence from Pandemic-Era Federal Aid for State and Local Governments,” Clemens J, Kearns J, Lee B, Veuger S. AEI Economics Working Paper 2022-14, December 2022.
“Ten Years after the Financial Crisis: What Have We Learned from the Renaissance in Fiscal Research?” Ramey V. NBER Working Paper 25531, February 2019, and Journal of Economic Perspectives 33(2), Spring 2019, pp. 89–114.
“An Evaluation of the Paycheck Protection Program Using Administrative Payroll Microdata,” Autor D, Cho D, Crane LD, Goldar M, Lutz B, Montes JK, Peterman WB, Ratner DD, Vallenas DV, Yildirmaz A. NBER Working Paper 29972, April 2022. “The Economic Impacts of COVID-19: Evidence from a New Public Database Built Using Private Sector Data,” Chetty R, Friedman JN, Hendren N, Stepner M, Opportunity Insights Team. NBER Working Paper 27431, June 2020.
“Ten Years after the Financial Crisis: What Have We Learned from the Renaissance in Fiscal Research?” Ramey V. NBER Working Paper 25531, February 2019, and Journal of Economic Perspectives 33(2), Spring 2019, pp. 89–114. “Geographic Cross-Sectional Fiscal Spending Multipliers: What Have We Learned?” Chodorow-Reich G. NBER Working Paper 23577, July 2017, and American Economic Journal: Economic Policy 11(2), May 2019, pp. 1–34.
“Macroeconomic Implications of COVID-19: Can Negative Supply Shocks Cause Demand Shortages?” Guerrieri V, Lorenzoni G, Straub L, Werning I. NBER Working Paper 26918, April 2020, and American Economic Review 112(5), May 2022, pp. 1437–1474.
“Does State Fiscal Relief during Recessions Increase Employment? Evidence from the American Recovery and Reinvestment Act,” Chodorow-Reich G, Feiveson L, Liscow Z, Woolston WG. American Economic Journal: Economic Policy 4(3), August 2012, pp. 118–145. “The American Recovery and Reinvestment Act: Solely a Government Jobs Program?” Conley TG, Dupor B. Journal of Monetary Economics 60(5), July 2013, pp. 535–549. “A Cup Runneth Over: Fiscal Policy Spillovers from the 2009 Recovery Act,” Dupor B, McCrory PB. The Economic Journal 128(611), June 2018, pp. 1476–1508. “Fiscal Spending Jobs Multipliers: Evidence from the 2009 American Recovery and Reinvestment Act,” Wilson DJ. American Economic Journal: Economic Policy 4(3), August 2012, pp. 251–282.
“Fiscal Policy Multipliers on Subnational Government Spending,” Clemens J, Miran S. American Economic Journal: Economic Policy 4(2), May 2012, pp. 46–68. “Fiscal Stimulus in a Monetary Union: Evidence from US Regions,” Nakamura E, Steinsson J. NBER Working Paper 17391, June 2013, and American Economic Review 104(3), March 2014, pp. 753–792. “Estimating Local Fiscal Multipliers,” Suárez Serrato JC, Wingender P. NBER Working Paper 22425, July 2016. “Using State Pension Shocks to Estimate Fiscal Multipliers since the Great Recession,” Shoag D. American Economic Review 103(3), May 2013, pp. 121–124.
“How Did Federal Aid to States and Localities Affect Testing and Vaccine Delivery?” Clemens J, Hoxie PG, Kearns J, Veuger S. NBER Working Paper 30206, July 2022.
“Intergovernmental Grants and Policy Competition: Concepts, Institutions, and Evidence,” Clemens J, Veuger S. Forthcoming in Policy Responses to Tax Competition, Agrawal DR, Poterba JM, Zidar OM, editors. Chicago: University of Chicago Press.


