Immigration and Productivity Growth in the OECD
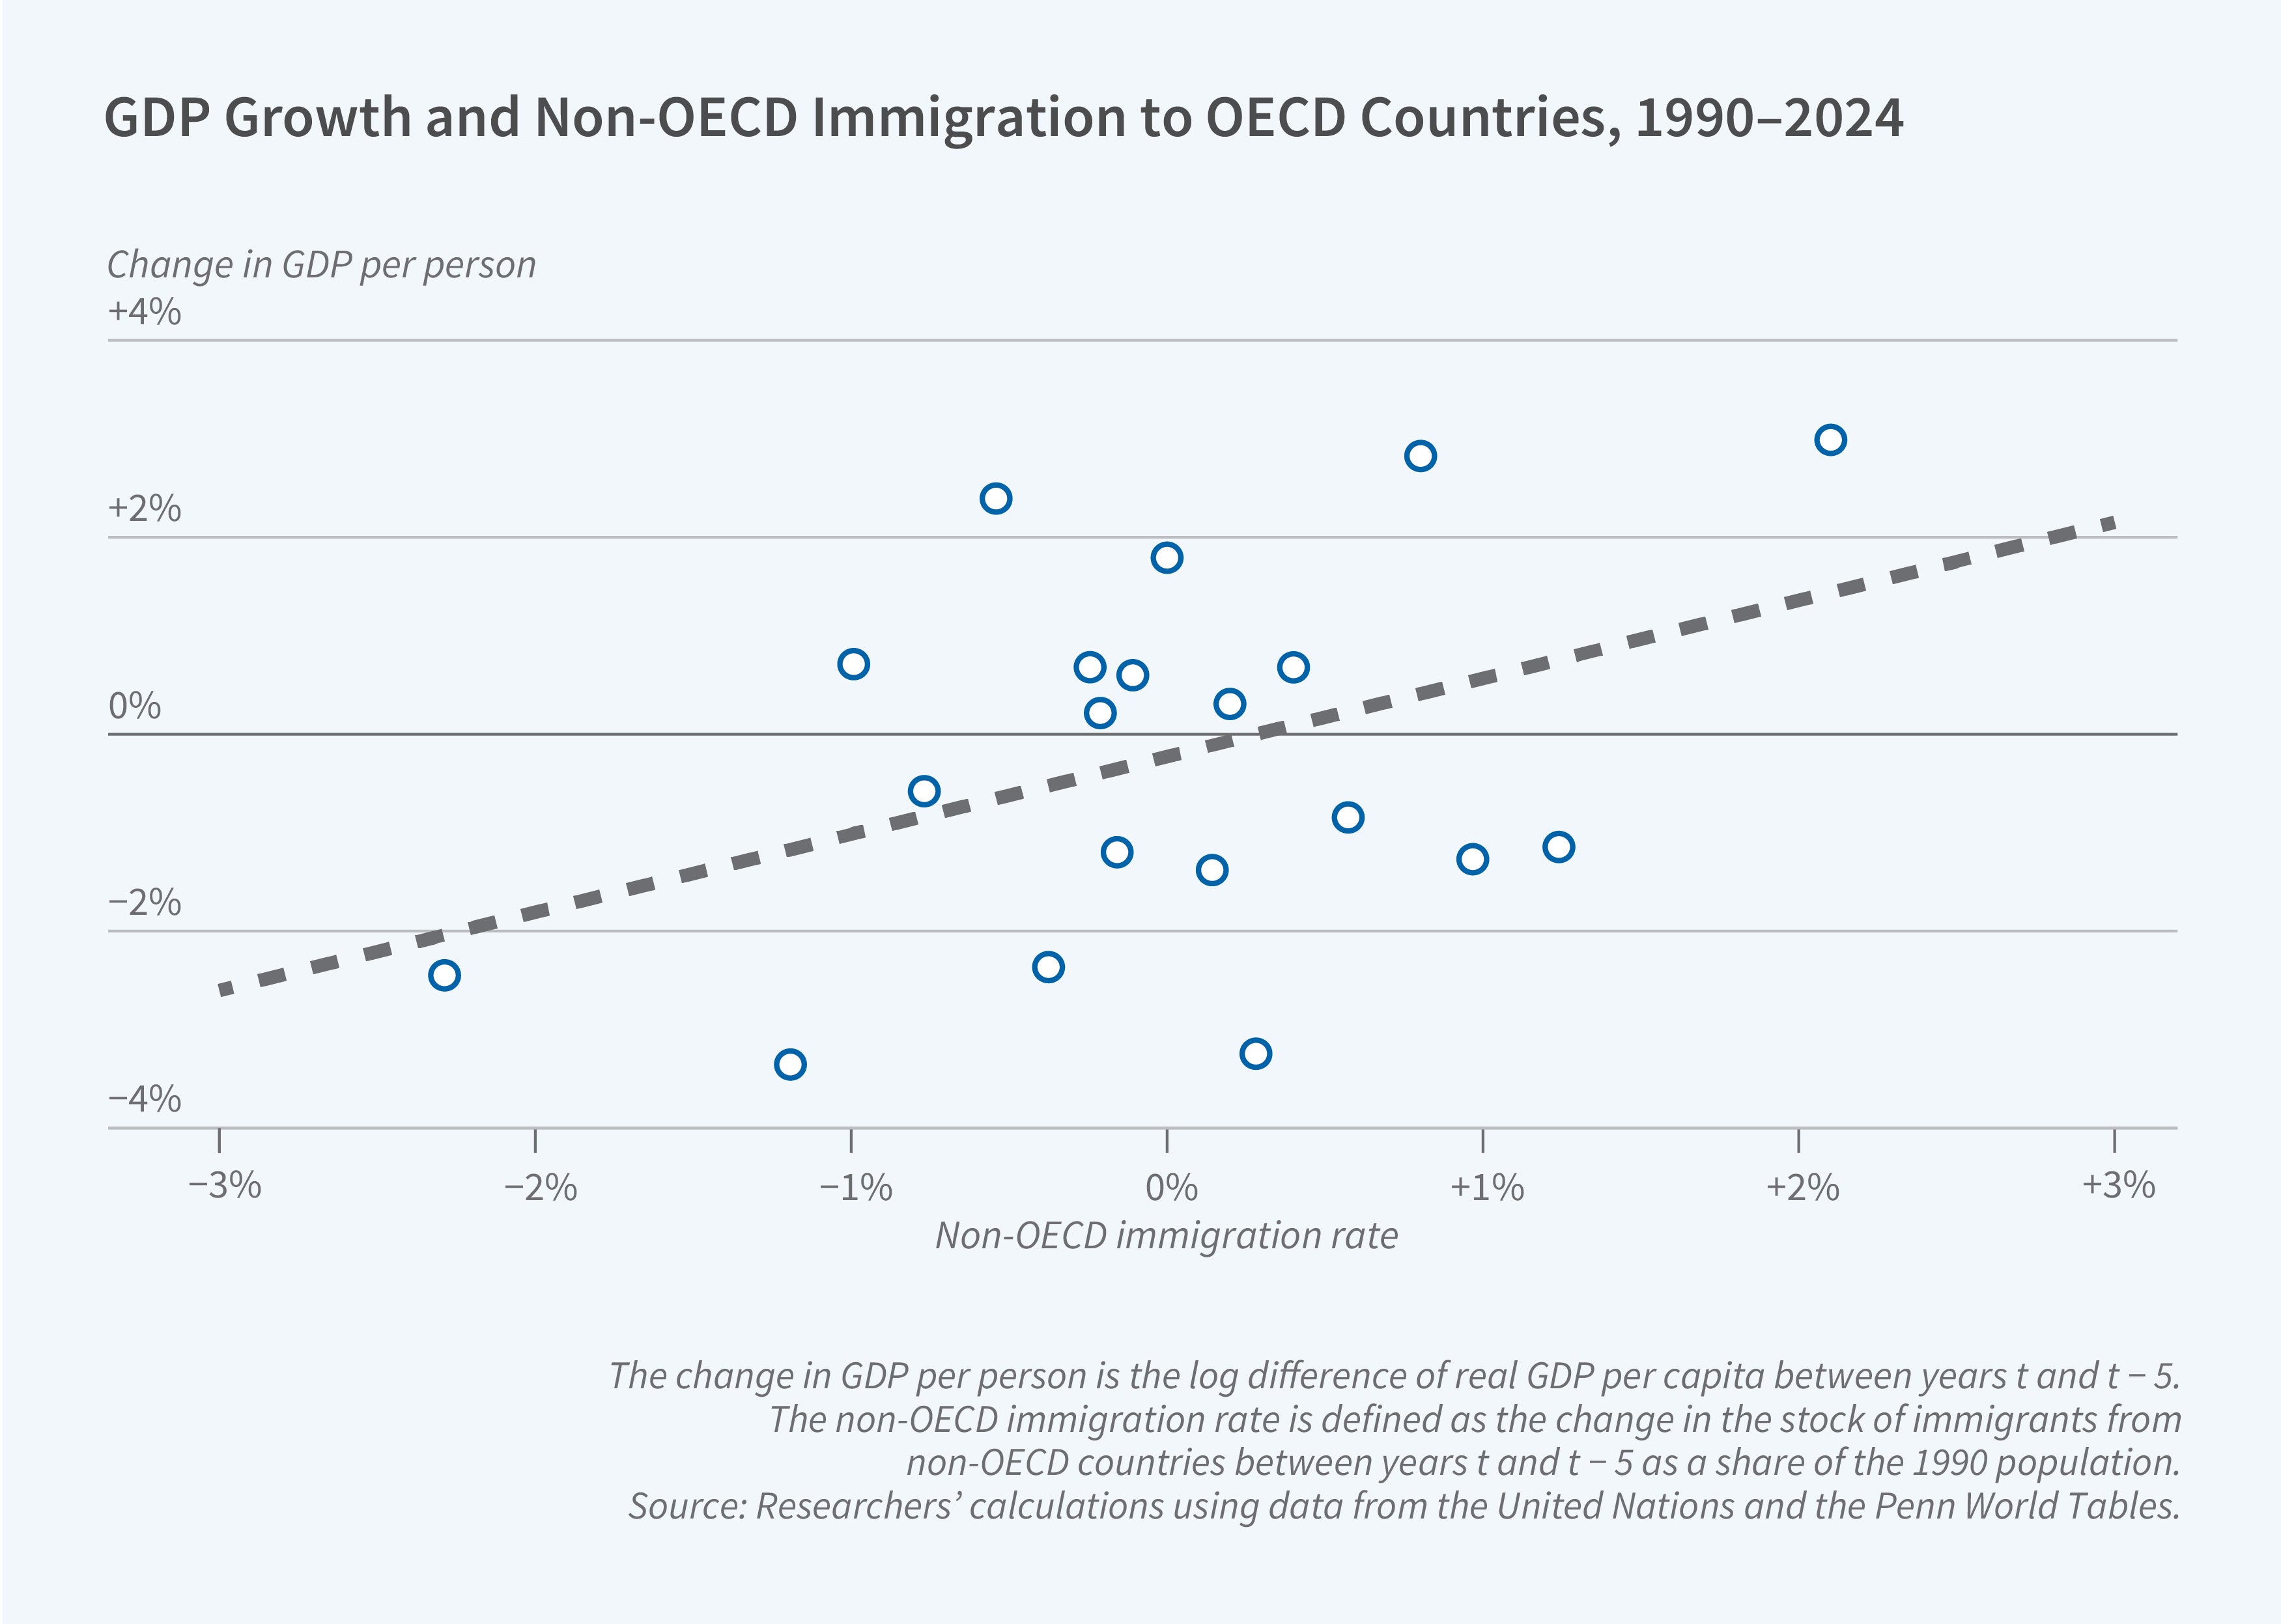
Birth rates across Organisation for Economic Co-operation and Development (OECD) countries have fallen in recent decades and native working-age populations have begun to shrink. At the same time, immigration—particularly from lower- and middle-income countries outside the OECD—has risen sharply. It has become the main source of labor force growth in much of Europe. In Immigration and Macroeconomic Outcomes in OECD Countries (NBER Working Paper 35523), Gaetano Basso, Mitali R. Mathur, and Giovanni Peri examine how immigration correlated with growth in GDP per worker, investment, human capital, and productivity across OECD economies over the 1990 to 2024 period.
GDP growth per worker was positively correlated with non-OECD immigration to OECD countries between 1990 and 2024, but not with native population growth.
The researchers measure net immigration—the five-year change in the stock of foreign-born residents as a share of the initial adult population—for 38 OECD countries, drawing on United Nations, OECD, and Eurostat census-based sources. They combine this with Penn World Tables data on GDP per capita, GDP per worker, capital per worker, human capital, and total factor productivity (TFP).
Non-OECD immigration accounted for most of the overall rise in immigration to OECD countries over this period and was, on average, evenly split between college-educated and non-college-educated arrivals—making immigrants more skilled than the native population in the large majority of country-period observations. Immigration policy indices and origin-country push factors explained little of the substantial variation in immigration rates across countries; large, unpredictable immigration shocks and surges were common.
The researchers estimate that a rise in the non-OECD immigration rate equal to 1 percent of the adult population was associated with 1.2 percent higher growth in GDP per worker within five years and 1.9 percent higher growth over ten years. Native population growth, by contrast, showed no significant association with GDP per worker and had a negative correlation at the five-year horizon. Additionally, for each percentage-point rise in the immigration rate, capital per worker rose 1.6 percentage points in the first five years and 2.9 percentage points in the next ten. Native population growth showed no comparable effect on investment.
High-skilled immigration was associated with significantly faster growth in human capital and TFP over the longer run, along with a marginally significant increase in GDP per worker. Low-skilled immigration mechanically lowered the human capital index but had no statistically significant effect on TFP, capital-per-worker, or GDP-per-worker growth. The per-unit effect on capital-per-worker growth was somewhat smaller in countries with larger existing immigrant shares, though the overall boost to GDP-per-worker growth did not decline substantially within the observed range of immigrant inflows. Sudden, less predictable episodes of high immigration produced similarly positive effects on investment, with capital per worker rising by a statistically significant 3.3 percentage points over 10 years following a surge.
The researchers estimate that Canada’s 17-percentage-point rise in immigrant population share between 1990 and 2024 was associated with a 19.9 percent increase in GDP per worker—more than half of the country’s actual 33 percent growth over that period. Comparable calculations imply that immigration accounted for about one-quarter of GDP-per-worker growth in the United Kingdom and roughly one-sixth in France.